American-Eurasian Journal of Scientific Research 6 (3): 149-154, 2011 ISSN 1818-6785 © IDOSI Publications, 2011
Application to Dissolution studies and HPLC Assay Method for Determination of Diacerein and Aceclofenac in Tablet Dosage Form 1
M.C. Sharma and 2S. Sharma
School of Pharmacy, Devi Ahilya Vishwavidyalaya, Indore (M.P) 452001, India Department of Chemistry Chodhary Dilip Singh Kanya Mahavidyalya, Bhind (M.P) 477001, India 1
2
Abstract: The proposed method is precise, accurate, selective and rapid for the simultaneous determination of Diacerein and Aceclofenac. A simple, rapid and selective HPLC method has been developed for quantitation of Diacerein and Aceclofenac from bulk drug and pharmaceutical formulations using a mobile phase consisting mixture of methanol and water (80:20 v/v) at the flow rate of 1mL/min. An ODS C18 RP-Column (Intersile 4.6 mm x 25 cm, 10 µm) column was used as stationary phase. The retention time of Diacerein and Aceclofenac were 4.6 min. and 7.3 min. respectively. Linearity was obtained in the concentration range of 5-35µg/ml for Diacerein, 5-35 µg/ml for Aceclofenac. Gatifloxacin was used as an internal standard. The method was statistically validated and RSD was found to be less than 2% indicating high degree of accuracy and precision of the proposed HPLC method. Due to its simplicity, rapidness, high precision and accuracy, the proposed HPLC method may be used for determining Diacerein and Aceclofenac in bulk drug samples or in pharmaceutical dosage form. Key words: Diacerein
Aceclofenac
Rp-HPLC Method
INTRODUCTION
Stability
Dissolution
tumour necrosis factor and prostaglandin E2 (PGE2) production [4]. Literature survey reveals that few UV, HPLC, HPTLC and colorimetric methods have been reported for the estimation of Diacerein and Aceclofenac as single component formulation and combination with other drugs in bulk samples, formulations and biological fluids [5-13]. Author of the article and his research team has developed a HPLC method development in different pharmaceutical dosage form [14-25].The method was validated according to procedures and acceptances criteria based on FDA guidelines and recommendations of ICH. However, no method has been developed for estimation of these drugs in combined dosage form. This paper presents simple, rapid, reproducible and economical method for RP-HPLC simultaneous estimation of Diacerein and Aceclofenac in tablet dosage form.
Diacerein chemically is 4,5-diacetyloxy-9,10-dioxoanthracene-2-carboxylic acid. Diacerein is anti-arthritic activity without inhibiting prostaglandin synthesis. It is novel antinflammatory drug with pharmacological properties different from those of chemical non-steroidal antinflammatory drug clinical studies have suggested that diacerein exerts a beneficial effect on the symptomatic treatment of osteoarthrisis [1,2]. Aceclofenac {[2-(2', 6'dichlorophenyl) amino] phenyl acetoxyacetic acid} is a new phenyl acetic acid derivative with potent analgesic and anti-inflammatory properties and improved gastric tolerance [3,4]. Aceclofenac is an orally administered phenyl acetic acid derivative with effect on a variety of inflammatory mediators. It is the non steroidal antinflammatory drug. Aceclofenac provides symptomatic relief in a variety of painful condition. A reduction in the stimulated generation of reactive oxygen species which may play a role in a joint damage, aceclofenac inducing inhibition of prostaglandin synthesis and potent inhibitor of the enzyme cycloxygenase. The drug inhibits synthesis of the inflammatory cytokines interleukin (IL)-1 and
MATERIAL AND METHODS Chromatographic Conditions: All reagents were of HPLC grade unless otherwise specified. from E.Merck (Mumbai, India), Potassium Dihydrogen Phosphate and o-phosphoric acid were purchased from SD fine chemical
Corresponding Author: M.C. Sharma, School of Pharmacy, Devi Ahilya Vishwavidyalaya, Indore (M.P) 452001, India.
149
Am-Euras. J. Sci. Res., 6 (3): 149-154, 2011
Ltd (Ahmadabad, India) and were of analytical grade Water of HPLC grade was used. Potassium Dihydrogen Phosphate and o-phosphoric acid were purchased from SD fine chemical Ltd (Ahmadabad, India) and were of analytical grade Water of HPLC grade was used. Gatifloxacin was used as an internal standard. The LicATVphere C18 column was used 25°C temperature. Rheodyne injection syringe with 20 µl loop volume and windows based chrompass software. An ODS C18 RPColumn (Intersile 4.6 mm x 25 cm, 10 µm) was used for separation. The flow rate of the mobile phase was maintained at 1.2 ml/min and the column temperature 45°C. Detection was carried out at 210 nm and the injection volume was 50 µm. Run time was 9 min.The elution was carried out isocratically at flow rate of 1.2 mL/min using methanol: water (80:20 v/v) mobile phase. The mobile phase was passed through nylon 0.45 µm membrane filters and degassed before use.
Sample was collected in dissolution vials after 2 hrs and then decanted the 0.1 N HCl media and the 6.8 pH phosphate buffer media was loaded and set RPM 70. Samples were collected in dissolution vials after different time intervals and filtered through 0.45 µm filter. Equal volumes (50 µL) of these solutions were injected into the chromatograph by auto sampler and peak areas were measured. Effect of pH: The effect of changing the pH of the mobile phase on the selectivity and retention times of the test solutes was investigated using mobile phases of pH ranging from 4.5-6.1. Shows that a pH of 4.7 was the most appropriate one giving well-resolved peaks and highest no. of theoretical plates. There were always asymmetric and broad peaks of Diacerein and aceclofenac at pH values > 6.0. Effect of Flow Rate: The effect of flow rate on the formation and separation of peaks was studied by varying the flow rate from 1-1.5; a flow rate of 1.5 mL min 1 was optional for good separation and resolution of peaks in a reasonable time.
Preparation of Standard Stock Solution: September 22, 2011The standard stock solution 0.5 mg/ml of Diacerein and Aceclofenac were prepared separately by dissolving 50 mg of each drug in 50 ml mixture of methanol and water (80:20 v/v). From the standard stock solution, mixed standard solution was prepared to contain 50 µg/mL of Diacerein and 100 µg/mL of Aceclofenac. Gatifloxacin (100µg/ml) was used as an internal standard.
Effect of Temperature: The effect of Temperature on the formation, separation and resolution was studied by varying the Temperature from 16-24 °C; we found that at lower Temperatures the peaks are not well resolved.
Preparation of Sample Solution: Twenty tablets each containing 50 mg of Diacerein and 100 mg of Aceclofenac were weighed and powder equivalent to 50 mg of Diacerein and 100 mg of aceclofenac was weighed accurately and transferred to a conical flask and extracted thrice with 20 ml mixture of methanol and water (80:20). The combined extracts were transferred to a volumetric flask and the volume adjusted to 100 ml with mobile phase. From this solution, 10 ml was pipette and transferred to 100 ml volumetric flask and made volume up to the mark with mobile phase to get the concentration50 µg/ml of Diacerein and 100 µg/ml of aceclofenac. Further dilutions were made using mobile phase to get the final concentration of 5 µg/ml of Diacerein and 10 µg/ml aceclofenac.
Procedure: The standard stock solution of each drug was suitably diluted with the mobile phase to obtained standard solutions of different concentrations. Each standard solution was injected six times into the column at a flow rate of 1 ml/min. The optical parameters and system suitability parameters are as mentioned in table 1. Good linearity was obtained in the concentration range 535 µg/ml for Diacerein, 5-35 µg/ml for aceclofenac. Assay of Tablet Formulation: Twenty tablets were weighed accurately and the average weight was determined and triturated to a fine powder. A quantity equivalent to 50mg of Diacerein, and 100 mg of aceclofenac was weighed and transferred to a 100 ml volumetric flask. The contents were sonicated for 20 min with mobile phase to dissolve the active ingredients and the volume was made up to 100 ml with same and filtered through a 0.2 µ membrane filter. Suitable aliquots of the solution were further diluted with mobile phase to obtain sample solutions within the concentration range for the two drugs. Each sample solution was injected into sample
Dissolution Study: For the dissolution study [26-27] of Diacerein and aceclofenac analysis was done by using above chromatographic conditions. For this study standard solution of Diacerein and aceclofenac was prepared in dissolution media. For sample preparation an intact tablet was dissolved in 0.1 N HCl media (RPM 70). 150
Am-Euras. J. Sci. Res., 6 (3): 149-154, 2011 Table 1: System suitability test parameter for Diacerein and Aceclofenac Property (n*=6)
DIA
ACE
Retention time(min)
4.6
7.3
Tailing factor
1.16
1.26
Capacity factor
2.05
4.11
Theoretical plates number
7693
9836
Resolution
1.94
2.29
* n = Number of determination, DIA-Diacerein, ACE-Aceclofenac Table 2: Recovery Study Diacerein and Aceclofenac Diacerein
Aceclofenac
-----------------------------------------------------------------------------------------------
-------------------------------------------------------------------------------------------
Label claimed
%Amount added
Found in(µg/ml)
%recovery
Label claimed
%Amount added
Found in(µg/ml)
%recovery
50
80
50.05
100.07
100
80
100.22
100.01
100
51.13
101.03
100
100.09
100.19
120
50.31
100.26
120
101.13
101.03
DIA-Diacerein,ACE-Aceclofenac
injector with 20µl loop six times under the chromatographic conditions described above. The area under the curve of each peak was measured at 298.0 nm. The amount of each drug present in the sample solutions was determined using the prepared calibration curves of standard Diacerein and aceclofenac respectively. The developed HPLC method was used to quantify Diacerein and aceclofenac in the formulation. The % drug content was found to be 96.31 and 101.16 of the labeled amount for Diacerein and aceclofenac respectively. The result of formulation analysis and its statistical analysis are given in Table 2 which indicates high degree of precision of the proposed method. The proposed HPLC method was also validated as per ICH guidelines.
(1, 2.0, 3.0, 4.0, 5.0 ml) were transferred to series of 10 ml volumetric flasks and diluted to mark with methanol. Aliquots (10µl) of each solution were injected under the operating chromatographic condition described above [Number of replicates (n=6)]. Accuracy: The accuracy of the method was established using recovery technique i.e. external standard addition method. The known amount of standard was added at three different levels to preanalysed sample. Each determination was performed in triplicate. The result of recovery study is presented in Table 4.
RESULTS AND DISCUSSION
Method Precision (Repeatability): The precision of the instrument was checked by repeatedly injecting (n = 6) mixed standard solution of Diacerein and Aceclofenac.
Method Validation Linearity: Calibration graphs were constructed by plotting peak area Vs concentration of Diacerein and Aceclofenac. The calibration graphs were plotted over six different concentrations in the range of 5-35µg/ml for both drugs. Accurately measured mixed standard solution aliquots of Diacerein and Aceclofenac
Intermediate Precision (Reproducibility): The intraday and interday precision of the proposed method was determined by analyzing mixed standard solution of Diacerein and Aceclofenac at concentration 5µg/ml and 25µg/ml three times on the same day and on three different days. The results are reported in terms of relative standard deviation.
Table 3: Regression Analysis of Calibration Graph for Diacerein and Aceclofenac Parameter
Diacerein
Aceclofenac
Concentration range Slope SD$ of the slope Intercept SDa of the intercept Correlation coefficient
5-35 µg/ml 43276 1.076 36532 2.765 0.9993
5-45 µg/ml 176544 3.965 776432 8.6276 0.9988
$
SD = Standard Deviation
151
Am-Euras. J. Sci. Res., 6 (3): 149-154, 2011 Table 4: Summary of validation parameter Diacerein and Aceclofenac Parameter
Diacerein
Aceclofenac
LODa LOQb Accuracy, % Repeatability (RSDc %, n =6) Precision (RSD, %) Intraday (n =3) Interday (n = 3)
33.2ng/ml 10.02ng/ml 99.97± 0.21 0.327
25.01ng/ml 10.07µg/ml 101± 0.17% 0.517
0.28 0.15
0.36 0.22
Table 5: Dissolution parameters and HPLC Condition Diacerein and Aceclofenac Dissolution parameters: ----------------------------------------------------------------------------------Phosphate buffer pH 6.8, 0.1 N HCL buffer pH-1.2 and Water.
Medium Volume Apparatus RPM Temperature Time
900 mL Paddle 70 37 ± 0.5°C 120 minutes
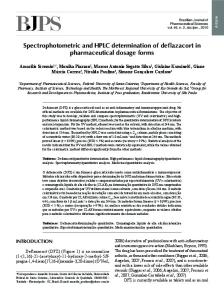
Fig. 1: Chromatogram of Diacerein and Aceclofenac Limit of Detection (Lod) and Limit of Quantitation (Loq): The LOD with signal to noise (S/N) ratio of 6:2 and LOQ with (S/N) ratio of 2:1 were calculated for both drugs using the following equations according to International Conference on Harmonization guidelines.
concentration. Several aliquots of standard solutions of Diacerein and Aceclofenac were taken in different 10ml volumetric flasks and diluted up to the mark with mobile phase such that the final concentration of Diacerein and Aceclofenac is 5-35 µg/mL and5-45 µg/mL respectively. Evaluation of two drugs were performed with PDA detector at 266 nm, peak area recorded for all the peaks and are given in Table I. The slope and intercept value for calibration curve was y =7654.80 x + 0.543 (r2 = 0.9993) for Diacerein and y =3276.65x + 26.858 (r2 = 0.9988) for aceclofenac. The results show that an excellent correlation exists between peak area and concentration of drugs within the concentration range indicated above. The limit of Detection (LOD) and limit of Quantification (LOQ) of
LOD = 8 x /S, LOQ = 4.5 x /S Where = the standard deviation (SD) of the response and S = the SD of the y-intercept of the regression line.To ensure the reliability and accuracy of the method, recovery studies were carried out in triplicate at three concentration levels (50%, 100% and 150%) of test 152
Am-Euras. J. Sci. Res., 6 (3): 149-154, 2011
REFERENCES
the developed method were determined by injecting progressively low concentrations of the standard solutions using the developed RP-HPLC method. The LOD is the smallest concentration of the analyte that gives a measurable response (signal to noise ratio of 8). The LOD Diacerein and Aceclofenac were found to be 23 ng/ml and 15 ng/ml, respectively. The LOQ is the smallest concentration of the analyte, which gives response that can be accurately quantified (signal to noise ratio of 10). Robustness of the method was determined by making slight changes in the chromatographic conditions. It was observed that there were no marked changes in the chromatograms, which demonstrated that the RP-HPLC method developed, are rugged and robust. The mean (n = 6) percentage dissolution of Diacerein and Aceclofenac in 6.8 pH phosphate buffer in 2 hrs from tablet dosage form was found within the limit. Analytical RP-HPLC method was developed and validated for the determination of Diacerein and Aceclofenac in bulk and dosage form. The advantages of the method are short run time, simplicity of sample preparation, no need for derivative formation, which require longer time for analysis. The other advantage of the method is the common chromatographic conditions adopted for both the assay and dissolution studies. As a result, the proposed method reduces the time required for switch over of chromatographic conditions, equilibration of column and post column flushing; that are typically associated when different chromatographic conditions are used. Author of the article and his research team has developed a HPLC method development in different pharmaceutical dosage form [14-25].
1. 2. 3. 4.
5.
6.
7.
8.
10. 11.
CONCLUSION To study the accuracy and reproducibility of the proposed method recovery experiments were carried out. A fixed amount of pre-analyzed sample was taken and standard drug was added at 50% and 100% levels. Each level was repeated three times. The lower values of RSD of assay indicate the method is accurate. The mean recoveries of Diacerein and Aceclofenac were in range of 100.77% and 100.66% that shows there is no interference from excipients.
12.
13.
14.
ACKNOWLEDGEMENTS The author wishes to express gratitude to Head, School of Pharmacy, Devi Ahilya Vishwavidyalaya for providing facilities to carry out the work. 153
Beckett, A.H and J.B. Stenlake, 1997. Practical Pharmaceutical Chemistry, 4th ed., Part II, CBS Publisher and Distributor, New Delhi, pp: 1. Martindale, the Extra pharmacopoeia, 31stedition, edited by James E. F. Reynolds. pp. 35. European Pharmacopeia 6.0., 2: 1093-1095. Borgmann, S.H., L.M. Parcianello, M.Z. Arend and S.G. Cardoso, 2007. Direct Spectrophotometric determination of Diacerein in capsules Bioinfo bank library. Pharmazie., 62: 483-5. Giannellini, V., F. Salvatore, G. Bartolucci, S.A. Coran and M. Bambagiotti-Alberti, 2005. A validated HPLC stability-indicating method for the determination of Diacerein in in bulk drug substance. Bioinfo bank library. J. Pharm. Biomed. Anal., 15:39 (3-4). Musmade, P., G. Subramanian and K.K. Srinivasan, 2007. High-performance liquid Chromatography and pharmacokinetics of aceclofenac in rats. Analytica. Chimica. Acta., 585: 103-109. Gopinath, R., S. Rajan, S.N. Meyyanathan, N. Krishnaveni and B. Suresh, 2007. A RP-HPLC method for simultaneous estimation of Paracetamol and Aceclofenac in tablet, Indian. J. Pharm. Sci., 69: 137-140. Zawilla, N.H., M.M. Abdul Azim, N.M.E.l. Kousy and S.M. El-Moghazy Aly, 2002. Determination of aceclofenac in bulk and pharmaceutical formulations. J. Pharma and BiomedAnal., 27: 243-251. El Kousy, N.M., 1999. Spectrophotometric and spectrofluorimetric determination of etodolac and aceclofenac, J. Pharma and Biomed Anal., 20: 185-194. Kousey, E., N.H. Zawilla and A.M. Abdul, 2002. Determination of aceclofenac in bulk and pharmaceutical formulation by HPLC. J. Pharm. Biomed. Anal., 9: 243-251. Shanmugam, S., K.A. Cendil, J. Vetrichelvan, R. Manavalan, D. Venkappayya and V. Pandey, 2005. Spectrophotometric method for estimation of Aceclofenac in tablets, Indian. Drugs., 42: 106-107. Sane, R.T., S.N. Menon, M. Mote and S. Inamdar, 2004. HPTLC determination of aceclofenac in bulk drug and in pharmaceutical preparation. J. Planer Chromatogr., 17: 241-245. Sharma, S., M.C. Sharma, D.V. Kohli and S.C. Chaturvedi, 2010. Isocratic Reverse Phase HPLC estimation method of Torsemide and Spironolactone in pharmaceutical combined dosage form. J. Optoel. and Biomed. Mate-Rapid Communications., 4: 234-237.
Am-Euras. J. Sci. Res., 6 (3): 149-154, 2011
15. Sharma, S., M.C. Sharma, D.V. Kohli and S.C. Chaturvedi, 2010. Study of stressed degradation behaviour of Pioglitazone hydrochloride in bulk and pharmaceutical formulation by HPLC assay method. J. Optoel. and Biomed. Mate., 1: 17-24. 16. Sharma, S., M.C. Sharma and S.C. Chaturvedi, 2010. Development and validation of isocratic reversed-phase HPLC method for simultaneous estimation of torsemide and spironolactone in bulk and pharmaceutical combined tablet dosage form. J. Optoel. and Biomed. Mate-Rapid Communications, 4(3): 427-430. 17. Sharma, S., M.C. Sharma and S.C. Chaturvedi, 2010. Simultaneous estimation of Rosuvastatin calcium and Ezetimibe in tablet dosage form by reverse phase high performance liquid chromatography. Optoel. and Biomed. Mate-Rapid Communications., 4: 238-241. 18. Sharma, M.C. and S. Sharma, 2011. A Facile and Isocratic RP-HPLC Method and Spectroscopy for Simultaneous estimation of Ramipril in Formulation: dissolution method. Intl. J. Chem. Tech. Res., 3(2): 992-996. 19. Sharma, M.C. and S. Sharma, 2011. Isocratic RP-HPLC Method for Simultaneous Estimation of Paracetamol and Lornoxicam in combined tablet Dosage Form and its Dissolution Assessment. Intl. J. Chem. Tech. Rese., 3(2): 997-1002. 20. Sharma, M.C. and S. Sharma, 2011. Dissolution Studies and RP-HPLC Method for the Simultaneous Determination of Satranidazole and Ofloxacin in Pharmaceutical Dosage Form. Intl. J. Chem. Tech. Rese., 3(2): 1003-1007.
154
21. Sharma, S., M.C. Sharma, R. Sharma and A.D. Sharma, 2011. High Performance Liquid Chromatographic Assay method for the determination of Paracetamol and Caffeine in Tablet Formulation-in vitro dissolution studies. J. Pharma. Resea., 4(5): 1559-1561. 22. Sharma, S., M.C. Sharma and A.D. Sharma, 2011. Application to Dissolution Assessments; A Facile and Rapid procedure of Atenolol and Hydrochlorothiazide in Pharmaceutical Formulation by RP-HPLC assay Method. Drug. Invention. Today, 3(6): 100-101. 23. Sharma, S., M.C. Sharma and A.D. Sharma, 2011. Facile and Rapid Simultaneous Estimation of Dexrabeprazole and Domperidone by RP-HPLC assay Method in Combined Dosage Form-In Application Dissolution assessment. Drug. Invention. Today, 3(6): 98-99. 24. Sharma, S., M.C. Sharma and A.D. Sharma, 2011. Study of stressed degradation behavior of Amlodipine Besylate and development of Reverse phase HPLC assay method. J. Pharma. Res., 4(5): 1579-1581. 25. Sharma, M.C. and S. Sharma, 2011. Stability Indicating RP-HPLC Method for Determination and Validation of Repaglinide in Pharmaceutical Dosage Form. Intl. J. Chem. Tech. Rese., 3(2): 210-216. 26. Morre, J.W. and H.H. Flanner, 1996. Mathematical comparison of dissolution profiles. Pharm. Techno., 6: 64. 27. Shah, V.P., Y. Tsong, P. Sathe and R.L. Williams, 1999. Dissolution profile comparison using similarity factor, f2. Dissolution. Techno., 6: 15.