Malden River Ecosystem Restoration Detailed Project Report APPENDIX C COST EFFECTIVENESS, INCREMENTAL ANALYSIS AND RESOURCE SIGNIFICANCE
MALDEN RIVER ENVIRONMENTAL RESTORTARATION PROJECT MEDFORD & EVERETT MASSACHUSETTS
Appendix C
Cost Effectiveness, Incremental Analysis, and Resource Significance
U.S. ARMY CORPS OF ENGINEERS NEW ENGLAND DISTRICT 696 VIRGINIA ROAD CONCORD, MASSACHUSETTS 01742-2751
May 2007
Malden River Ecosystem Restoration – Appendix C – Cost Effect, IA & Resource ________________________________________________________________________________________________________________
C-2
Malden River Ecosystem Restoration – Appendix C – Cost Effect, IA & Resource ________________________________________________________________________________________________________________
TABLE OF CONTENTS Section Page ______________________________________________________________________
Introduction………………………………………………………………….….….. C-1 Study Area and Environmental Quality Objectives………………………………... C-1 Units of Measurement and Models……………………………………………….… C-2 Environmental Plan Increments……………………………………………………... C-3 Resource Significance……………………………………………………………… C-3 References……………………………………………………………………….…. C-9 Incremental Analysis………………………………………………………………. C-10
List of Tables Table 1 Alternatives Cost and Output………………………………………….…. C-11 Table 2 Project Cost…………………...……………………………………….…. C-12 Table 2 Incremental Cost Curve.……...……………………………………….…. C-15
List of Figures Figure 1 Cost Effective Plans………………………………………………….…. C-13 Figure 2 Best Buy Plans……………………………………………………….…. C-13
C-i
Malden River Ecosystem Restoration – Appendix C – Cost Effect, IA & Resource ________________________________________________________________________________________________________________
C-ii
Malden River Ecosystem Restoration – Appendix C – Cost Effect, IA & Resource ________________________________________________________________________________________________________________
INTRODUCTION The United States Army Corps of Engineers, New England District (USACE/NED), is preparing a feasibility-level study that identifies habitat restoration opportunities in the Malden River, a small urban waterway located in Medford, Malden and Everett, Massachusetts. The principle goals of the study are to identify environmental restoration needs and opportunities in the Malden River, develop plans and cost estimates for restoration alternatives, assess benefits and costs of alternative restoration plans, select a recommended restoration plan, and prepare appropriate NEPA documentation. This appendix presents the results of a cost effectiveness and incremental cost analysis conducted for the Malden River project. This analysis was done to aid in selection of a National Environmental Restoration Plan (NER). The analysis identifies those restoration plans that are most cost effective in providing environmental benefits (outputs), eliminates inefficient plans, and determines if plans are cost effective. The analysis aids decision making by ensuring that the least cost solution (“Best Buy Plan”) is identified for all possible levels of environmental outputs and examines changes in unit cost for increasing levels of environmental output. Key steps in the analysis are as follows: • • • • •
Define Study Area and Environmental Restoration Objectives Develop Methods to Quantify Benefits (Habitat Units) Formulate Alternatives and Plan Increments Determine Cost and Benefits of Each Alternative and Plan Increment Conduct Cost Effectiveness Analysis and Incremental Cost Analysis
STUDY AREA AND ENVIRONMENTAL QUALITY OBJECTIVES The Malden River is a tributary of the Mystic River located within the cities of Malden, Medford, and Everett, Massachusetts (see Environmental Assessment, Figures EA-1 and EA-2). It is a highly engineered waterway, originating at Spot Pond and flowing through a series of interconnected natural and man-made channels and culverts for approximately 3.5 miles before its confluence with the Mystic River. The study area includes about 40 acres of aquatic habitat. A detailed description of the aquatic and terrestrial environment associated with the Malden River is provided in the Environmental Assessment (EA) prepared for this study. Like many urban waterways, the Malden River is beset by a host of environmental problems. These include poor water quality (low dissolved oxygen), poor sediment quality, loss of aquatic and wetland habitat due to filling and sedimentation, elevated contaminant levels, and proliferation of invasive species.
C-1
Malden River Ecosystem Restoration – Appendix C – Cost Effect, IA & Resource ________________________________________________________________________________________________________________
The primary objective of this study is to restore aquatic habitat quality in the Malden River study area. UNITS OF MEASUREMENT AND MODELS Costs The cost of construction of each alternative was estimated using the USACE’s MCACES cost estimating system. The estimates include cost to develop plans and specifications, engineering and design during construction, construction supervision, and a 20 percent contingency (see Appendix C). Operation and maintenance costs over a 50-year project life are included in the estimate. Benefits Benefits were measured in habitat units (HU’s) using an approach based on USFWS Habitat Evaluation Procedures (HEP) developed for the Malden River Study (see Appendix E). The HEP study was guided by a “HEP Team” composed of representatives from the USACE, MVDC, and Nangle Associates, Inc. The underlying assumption of HEP is that the value of habitat for an organisms or a guild (a group of organisms that share a similar habitat and use resources in a similar manner) can be described by a Habitat Suitability Index (HSI) model. HSI models typically denote habitat suitability of a species as the relationship between two or more environmental variables that are deemed to affect the species’ presence, distribution, and/or abundance. The HSI is defined as a value between 0.0 and 1.0, with 1.0 representing optimum habitat, and assumed to be positively correlated to habitat carrying capacity. The HSI value is multiplied by the area of available habitat (acres) to obtain Habitat Units (HUs). The HU values provide a quantitative estimate of overall habitat benefits. The Habitat Suitability Index Models, published by the U.S. Fish and Wildlife Service, contain habitat suitability criteria necessary for all life stages of these species for a specific habitat. As noted earlier, many of the essential water quality (as well as physical habitat) criteria are common to several of the various freshwater lacustrine fish species. These include necessary water quality criteria (i.e. pH, turbidity, temperature, dissolved oxygen) and physical/morphological habitat components (e.g. forage, benthic invertebrates). By grouping specific life requisite criteria common to several target species into a single habitat component, a basic life requisite index for any body of water can be obtained. This can then be applied (using a geometric mean) toward additional species-specific criteria necessary for a target species. For other non-fish species, a group of common wetland criteria can be developed and then multiplied by target wetland species criteria (plus the lacustrine component) output in the same manner.
C-2
Malden River Ecosystem Restoration – Appendix C – Cost Effect, IA & Resource ________________________________________________________________________________________________________________
Four ecological guilds were selected for evaluating habitat benefits. They include a benthic invertebrate guild, a fish guild, a piscivorous (fish-eating) wildlife guild, and a wetland/riparian dependant wildlife guild. Two of these guilds, benthic invertebrates and fish, are typically evaluated at the community level. However, specific species are required to evaluate the piscivorous and wetland/riparian guilds. Therefore, species accounts, life history information, site conditions, and plant communities were evaluated to identify species likely to occur in the study area. At least 175 species were identified as likely to occur in the greater study area (Burt and Grossenheider 1976, Godin 1977, Peterson 1980, DeGraaf and Rudis 1983, Ehrlich et al 1988, Whitaker 1988, Conant and Collins 1991, Behler 1995, Stokes and Stokes 1996, Terres 1996). To focus the HEP study, species that did not have existing USFWS and/or Pennsylvania Modified HEP (PAMHEP) HSI models were eliminated from further consideration, narrowing the list to 25 species. Species that were not closely associated with the potential effects (i.e. upland species) or study goals (i.e. not included in one of the four target guilds) were also eliminated. As a result, 8 species remained for further consideration as evaluation species in the HEP study: belted kingfisher (Cerlye alcyon), catbird (Dumetella carolinensis), slider turtle (Pseudemys scripta), raccoon (Procyon lotor), yellow warbler (Dendroica petechia), marsh wren (Cistothorus palustris), common yellowthroat (Geothlypis trichas), and green-backed heron (Butorides virescens). In order to further reduce the list of candidate species and determine which species would best fulfill the goals and objectives of the HEP study, the variables within each species’ HSI model were reviewed with regard to their applicability to the Malden River and the proposed restoration alternatives. Specifically, each species model was evaluated to determine its sensitivity to potential project effects, site contaminants, its association with the targeted guilds, and the availability of toxicity and food ingestion data needed to establish links between the site contaminants and their diet. Table C-1 summarizes the justifications for eliminating species from the HEP study. Based on these evaluations, three species were selected for the Malden HEP study: marsh wren, common yellowthroat, and green-backed heron. The marsh wren and common yellowthroat represent the wetland/riparian dependant wildlife guild, and the green-backed heron represents the piscivorous wildlife guild.
Table C-1
Model
Status
Habitat Evaluation Procedure (HEP) Models
Reasons for Selecting or Not Selecting
C-3
Malden River Ecosystem Restoration – Appendix C – Cost Effect, IA & Resource ________________________________________________________________________________________________________________
Table C-1
Habitat Evaluation Procedure (HEP) Models
Model
Status
Reasons for Selecting or Not Selecting
Greenbacked Heron
Selecte d
Applies to the piscivourous feeding guild in wetland areas and contains variables that will be affected by the alternatives.
Belted Kingfisher
Not Selecte d
Suitable nesting habitat must be located within 1.9 miles of the study area or the overall HSI will equal zero. Based on the surrounding land use, it is unlikely that suitable nesting habitat will be present.
Slider Turtle
Not Selecte d
The USFWS HEP model available for the slider is only pertinent to populations in the southern United States.
Marsh Wren
Selecte d
Applies to species nesting in herbaceous vegetation (ei.g, Typha and Phragmites) and contains variables that will be affected by the alternatives.
Common Yellowthroa t
Selecte d
Applies to species inhabiting shrub communities near open water and wetland areas and contains variables that will be affected by the alternatives.
Yellow warbler
Not Selecte d Not selected
Applies only to cover types dominated by shrubs.
Not Selecte d
The variables for the raccoon are not sensitive enough to distinguish improvements in habitat based on the alternatives being considered.
Catbird Raccoon
Does not apply to alternatives being considered.
USFWS HEP models were used to assess benefits from wetland restoration activities to fishing eating (piscivirous) wildlife (Green Heron) and wetland dependent songbirds (Common Yellow Throat and Wren). The assessment of benefits from benthic habitat restoration relied on a sediment toxicity model by Ingersoll et. al. (2000) that relates sediment toxicity to benthic invertebrates to concentrations of PAHs, metals, and PCBs in
C-4
Malden River Ecosystem Restoration – Appendix C – Cost Effect, IA & Resource ________________________________________________________________________________________________________________
sediment. The fish habitat restoration HU's were based on area (in acres) available to anadromous fish species following increased fish passage efficiency, the quality of which is equal across all alternatives (e.g. 1.0). An incremental cost analysis examines how the costs of additional units of environmental output increase as the level of environmental output increases. For this analysis, the environmental outputs are measured in habitat units. The analysis is in accordance with IWR Report 95-R-1, Evaluation of Environmental Investments Procedures ManualInterim: Cost Effectiveness and Incremental Cost Analyses, May 1995. The program IWR-PLAN, developed for the Institute for Water Resources (IWR), was used to conduct the analysis. An incremental cost curve can be identified by displaying cost effective solutions. Cost effective solutions are those increments that result in same output, or number of habitat units, for the least cost. An increment is cost effective if there are no others that cost less and provide the same, or more, habitat units. Alternatively, for a given increment cost, there will be no other increments that provide more habitat units.
ENVIRONMENTAL PLAN INCREMENTS Measures to improve environmental conditions in the river include wetland restoration, wetland creation, dredging of contaminated sediments, and fish passage restoration and habitat enhancement. These measures were combined to form 276 alternative restoration plans. A summary of the Best Buy Plans is discussed in the Incremental Analysis section. RESOURCE SIGNIFICANCE Policy Guidance Ecosystem restoration is one of the primary missions of the USACE’s Civil Work program (ER 1165-2-501 – Civil Works Ecosystem Restoration Policy). The primary objective of USACE ecosystem restoration efforts is to partially or fully restore a naturalistic, functioning, and self-regulating ecosystems. Restoration of wetlands, other aquatic systems, and riparian areas are most appropriate for USACE involvement. USACE restoration initiatives may also include measures to protect ecosystems from further degradation. Ecosystem restoration and protection initiatives should be conceived in the context of broader watershed management objectives, which may include collaboration with other federal and non-federal agencies, local communities, and other stakeholders. USACE regulations require the careful evaluation of ecosystem restoration alternatives to assure that a cost effective plan is selected. Information used in selecting the recommended NER plan includes an analysis of the plans outputs (benefits), costs,
C-5
Malden River Ecosystem Restoration – Appendix C – Cost Effect, IA & Resource ________________________________________________________________________________________________________________
significance, acceptability to the public and resource agencies, and other factors. Any adverse impacts of the restoration plan are also considered in the evaluation. Significance Information on the significance of ecosystem outputs also helps determine whether the value of the benefits of the proposed plan is worth the costs incurred to produce them. Significance of restoration benefits includes an assessment of the institutional, public, and technical support or recognition for an alternative’s ecological outputs. Although the most important evidence of the recognition of the Malden River ecosystem as an important environmental resource is in terms of institutional and public importance, there is also strong technical recognition of the aquatic habitats propose to be restored. Institutional Recognition Habitat degradation along the Malden River has concerned public agencies since the 1970’s. Numerous investigations by local, state, and federal agencies demonstrate a longstanding interest in the area and concerns about habitat degradation and deterioration of the river and its surrounding wetlands. The aquatic habitat outputs from the separable elements of the NED and NER plans represent resources of federal significance and institutionally recognized in the Clean Water Act (vegetated wetlands). The additional benefits of forage and passage to spawning grounds for anadromous fish make restoration a critical federal interest in this highly urbanized watershed. Federal interest in establishment and protection of anadromous fish is recognized in the Anadromous Fish Conservation Act and the Fish and Wildlife Conservation Act. Federal interest in invasive species control (Phragmites) is institutionally recognized by Executive Order 13112 of February 3, 1999 -- Invasive Species. Public Recognition The USACE Environmental Operating Principles strives to achieve environmental sustainability by seeking balance and synergy among human development activities and natural systems. This can be accomplished by designing economic and environmental solutions that supports and reinforces one another. Public recognition means that some segment of the public recognizes the importance of an environmental resource, as evidenced by people engaged in activities that reflect an interest or concern for that particular resource. Such activities may involve membership in an organization, financial contributions to resource-related efforts, providing volunteer labor and correspondence regarding the importance of the resource.
C-6
Malden River Ecosystem Restoration – Appendix C – Cost Effect, IA & Resource ________________________________________________________________________________________________________________
The Mystic Valley Development Commission (MVDC) is a tri-city legislative body established by the Commonwealth of Massachusetts and approved by the cities of Malden, Medford and Everett to address commonly shared issues such as land development and river restoration. The cities of Malden, Medford and Everett with combined population of 142,000 have embarked on a regional technology development project involving reclamation of 200 acres of industrial land that has supported abroad spectrum of power generation and chemical production facilities for over a century. These entities, as well as other riverfront property owners, watershed associations and citizens of the three host communities share a common goal of restoring this long neglected Malden River Corridor through the construction of public parkland, employment and residential opportunities. The MVDC has partnered with the USACE to conduct a feasibility study to determine possible restoration efforts for the Malden River ecosystem. River’s Edge (formerly TeleCom City), a MVDC master-planned development, is being pursued as a publicprivate partnership that will include office, research & development, manufacturing facilities and approximately 60 acres of public open space. This proposed open space, the Malden River Park, would include a riverside trail, river overlooks and a canoe launch. This River Park is expected to bring members of the community to the river area for recreational/leisure purposes. Therefore, restoration and remediation of the Malden River are critical to the success of the overall project and to the protection of public health. The public also expresses its recognition of resources significance through membership in many local, regional, state, national and international organization (e.g., Ducks Unlimited, local Chapter of the Nature Conservancy, Mystic River Watershed Association, the National Audubon Society); and through participation in many activities, whether they be resource-specific (e.g., focusing on the river, a type of fish, a watershed), user based (e.g., fishing, bird-watching, hiking, camping), or conservation or management-based. Public and agency records and scoping meetings with the public as well as non-profit organizations clearly exhibit Public Recognition significance of the proposed alternatives. Technical Recognition Technical recognition means that the resources qualify as significant based on an objective scientific evaluation. Significance may vary with spatial scale. For the Malden River, significance was evaluated on the watershed scale and regional landscape scale. USACE planning guidance recommends description of technical significance in terms of one or more of the following ecological concepts: scarcity, representativeness, status and trends, connectivity, critical habitat, and biodiversity. Application of each of these concepts to the Malden River is discussed below. Scarcity: Scarcity is a measure of the relative abundance of a resource within a geographic area. The Malden River provides about 140 acres of aquatic and wetland habitat in an otherwise heavily developed urban landscape. The river is the only remaining
C-7
Malden River Ecosystem Restoration – Appendix C – Cost Effect, IA & Resource ________________________________________________________________________________________________________________
area in Malden that still provides significant aquatic and riparian habitat, including spawning habitat for anadromous fish. Other streams that once flowed freely in the area were culverted long ago and cannot be restored due to dense urbanization. On the watershed scale and regional scale, the Malden River is thus unique, irreplaceable, and highly significant. The rivers’ significance is further enhanced because it provides anadromous fish spawning habitat (a scarce resource of regional and national significance). Status and Trends: This concept involves evaluating how the resource has been altered over time, its current conditions, and prospects for the future. The Malden River system is a remnant of an extensive tidal wetland system, much of which was filled in during the 19th century. The remaining habitat is currently highly degraded, and remains in decline due to proliferation of Phragmites, sedimentation, and continued contaminant loading. Without action, conditions are expected to worsen considerably, with lower dissolved oxygen levels, and further loss of aquatic habit due to sedimentation and Phragmites expansion. USACE policy guidance indicates that sites with declining trends are more significant than sites that are recovering without human intervention. The Malden River can be considered technically significant since without human intervention there is no potential for recovery of the resource and every reason to expect continued degradation. Connectivity: This concept involves the degree of linkage of resource areas within a watershed or larger landscape content. The value of natural areas is enhanced by existence of habitat corridors that allow for movement and dispersal of native species between resource areas. Restoration alternatives that improve connectivity are considered technically significant. Restoration of in-stream, wetland and riparian habitat along the Malden River will be significant in providing a resting area (habitat island) for migratory songbirds passing through the highly urbanized Malden-Medford-Everett area. As a tidal riverine system, restoration of the Malden River provides and essential link between freshwater and estuarine and marine habitats. Restoration of fish passage and carrying capacity will link anadromous fish to their spawning grounds. Limiting Habitat: This is habitat that is essential for the conservation, survival, or recovery of one species listed as rare or endangered under the federal endangered species act or other significant federally listed species. The Malden and Mystic Rivers provide potential spawning habitat for the Blue-black Herring and possible spawning habitat for other anadromous species. This qualifies it as “Essential Fish Habitat” under the Magnuson Stevenson Fisheries Management Act. Given the scarcity of anadromous fish spawning and rearing habitat in the greater Boston area, restoration of the Malden River is considered technically significant. Biodiversity: The concept of biodiversity concerns the number of the species found in a community (species richness) and the distribution of individuals among species (i.e. how evenly the total number of individuals is divided among species). Restoration
C-8
Malden River Ecosystem Restoration – Appendix C – Cost Effect, IA & Resource ________________________________________________________________________________________________________________
alternatives that improve biodiversity (either species richness or evenness) are considered technically significant. The NED/NER plan would eradicate Phragmites, increasing the biodiversity (species richness) of emergent wetland and riparian communities. Removal of contaminated sediments would likely increase diversity of the benthic community, by increasing both the number of species and reducing the dominance of tubificid worms and oligiochaetes. Based on these criteria, restoration of the Malden River is considered technically significant. References Ingersoll, C.G. et al. Prediction of sediment toxicity using consensus-based freshwater sediment quality guidelines. USGS Report to USEPA Great Lakes National Program Office. EPA/905/R-00-007 U.S. Army Corps of Engineers, 1995. Evaluation of Environmental Investments Procedures Manual-Interim: Cost Effectiveness and Incremental Cost Analyses. IWR Report # 95-R-1. U.S. Environmental Protection Agency. 1986. Quality Criteria for Water 1986. EPA 440/586-001.
C-9
Malden River Ecosystem Restoration – Appendix C – Cost Effectiveness, IA & Resource Significance ____________________________________________________________________________________________________________
INCREMENTAL ANALYSIS
The costs of the alternative restoration plans are compared with the environmental benefits, within the framework of an incremental cost analysis, to identify the most cost effective alternatives. An incremental cost analysis examines how the costs of additional units of environmental output increase as the level of environmental output increases. For this analysis, the environmental outputs are measured in habitat units. The analysis is in accordance with IWR Report 95-R-1, Evaluation of Environmental Investments Procedures Manual-Interim: Cost Effectiveness and Incremental Cost Analyses, May 1995; and ER 1105-2-100, Planning Guidance Notebook, Section 3-5, Ecosystem Restoration, April 2000. The program IWR-PLAN, developed for the Institute for Water Resources (IWR), was used to conduct the analysis. An incremental cost curve can be identified by displaying cost effective solutions. Cost effective solutions are those increments that result in the same output, or number of habitat units, for the least cost. An increment is cost effective if there are no others that cost less and provide the same, or more, habitat units. Alternatively, for a given incremental cost, there will be no other increments that provide more habitat units at the same, or lower, cost. There are five management plans being evaluated to improve environmental conditions in the Malden River. They are removal of invasive species, removal of invasive species coupled with restoration of wetlands, creation of wetlands, placement of gravel or sand, and provision for fish passage. Project description, project cost, and the number of habitat units created by each plan are shown in Table 1. Costs are discounted at an interest rate of 5 1/8 %. This interest rate, as specified in the Federal Register, is to be used by Federal agencies in the formulation and evaluation of water and land resource plans for the period October 1, 2005 to September 30, 2006. The project economic life is considered to be 30 years. Column 1 shows plan designators as shown in the IWR-Plan program. Column 2 is a brief description of each plan. Column 3 shows total project implementation cost including interest during construction (IDC). Column 4 shows habitat units (HU) relative to the no action alternative. With the exception of fish passage, the other four management plans are evaluated over six sub-areas. Plans A through E involve the removal of invasive species in sub-areas 2 through 6. Plans F though J add restoration of wetlands to plans A through E. These plans are evaluated sub-areas 2 through 6. Plan K provides for the creation of wetlands in sub-area 4 only. Plans L through P provide for placement of sand/gravel in sub-areas 1 and 3 through 6. Plan Q would allow for the operation of a fish passage at the Amelia Earhardt dam. HU were developed using a Habitat Evaluation Procedures (HEP) analysis.
C-10
Malden River Ecosystem Restoration – Appendix C – Cost Effectiveness, IA & Resource Significance ____________________________________________________________________________________________________________
Table 1. Alternatives Cost and Output IWR-Plan Designator A1 B1 C1 D1 E1 F1 G1 H1 I1 J1 K1 L1 M1 N1 O1 P1 Q1
Description Total Remove Invasive Species SA 2 Total Remove Invasive Species SA 3 Total Remove Invasive Species SA 4 Total Remove Invasive Species SA 5 Total Remove Invasive Species SA 6 Rem Inv Species & Restore Wetland SA 2 Rem Inv Species & Restore Wetland SA 3 Rem Inv Species & Restore Wetland SA 4 Rem Inv Species & Restore Wetland SA 5 Rem Inv Species & Restore Wetland SA 6 Create Wetland SA 4 Place Gravel/Sand SA 1 Place Gravel/Sand SA 3 Place Gravel/Sand SA 4 Place Gravel/Sand SA 5 Place Gravel/Sand SA 6 Fish Passage
Cost ($000) 792.7 1,096.8 1,443.9 1,091.3 8,080.1 812.1 1,150.4 1,500.5 1,137.1 8,279.7 1,322.2 7.8 75.1 76.7 48.7 84.1 716.4
HU 0.54 0.67 1.02 2.57 4.12 3.65 8.52 9.26 12.05 39.41 15.71 0.70 0.69 0.84 0.42 0.79 49.04
Project cost derivation is shown in Table 2. First cost includes all contingencies, overheads, real estate and study costs (Plans & Specifications). Interest during construction (IDC) is then calculated assuming a construction period of 12 months for each alternative. IDC is an economic cost and not a financial cost. It needs to be estimated for purposes of project justification, however it is not a financial cost that will need to be cost shared. Essentially, IDC represents the opportunity cost of funds tied up in investments, before these investments begin to yield benefit. Once project benefit starts IDC stops.
C-11
Malden River Ecosystem Restoration – Appendix C – Cost Effectiveness, IA & Resource Significance ____________________________________________________________________________________________________________
Table 2. Project Cost ($000) First No.
First Cost
IDC
Total
Construct.
Project
OM&R
Project
Period
Cost
Cost
Cost
(months)
A1
774.2
18.4
792.7
0.0
792.7
12
B1
1,071.3
25.5
1,096.8
0.0
1,096.8
12
C1
1,410.3
33.6
1,443.9
0.0
1,443.9
12
D1
1,065.9
25.4
1,091.3
0.0
1,091.3
12
E1
7,892.1
188.0
8,080.1
0.0
8,080.1
12
F1
793.2
18.9
812.1
0.0
812.1
12
G1
1,123.6
26.8
1,150.4
0.0
1,150.4
12
H1
1,465.6
34.9
1,500.5
0.0
1,500.5
12
I1
1,110.6
26.5
1,137.1
0.0
1,137.1
12
J1
8,087.0
192.7
8,279.7
0.0
8,279.7
12
K1
1,291.4
30.8
1,322.2
0.0
1,322.2
12
L1
7.6
0.2
7.8
0.0
7.8
12
M1
73.4
1.7
75.1
0.0
75.1
12
N1
74.9
1.8
76.7
0.0
76.7
12
O1
47.5
1.1
48.7
0.0
48.7
12
P1
82.1
2.0
84.1
0.0
84.1
12
Q1
0.0
0.0
0.0
716.4
716.4
0
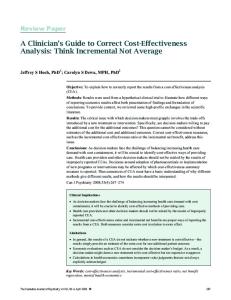
Figure 1 shows all cost effective plans and best buy plans. The vertical axis represents thousands of dollars. The incremental analysis identified 276 (out of a possible 31,104) alternatives as cost effective plans. A plan is not cost effective if compared with another alternative, it provides fewer or the same number of habitat units at a higher cost. Best buy plans are a subset of cost effective plans. For each best buy plan there are no other plans that will give the same level of output at a lower incremental cost. There are 13 best buy plans including the no action alternative. Figure 2 shows best buy plans that comprise the incremental cost curve. As in Figure 1, the horizontal axis represents habitat units created by each project. However, the vertical axis represents the incremental cost per incremental output as output increases with project size. The units on the vertical axis are thousands of dollars. Best buy plans are a subset of cost effective plans. For each best buy plan there are no other plans that will give the same level of output at a lower incremental cost. There are 13 best buy plans labeled in Figure 2 by their HU and cost.
C-12
Malden River Ecosystem Restoration – Appendix C – Cost Effectiveness, IA & Resource Significance ____________________________________________________________________________________________________________
Figure 1 Cost Effective Plans
Figure 2 Best Buy Plans
C-13
Malden River Ecosystem Restoration – Appendix C – Cost Effectiveness, IA & Resource Significance ____________________________________________________________________________________________________________
There are 13 increments that comprise the best buy plan curve. The derivative process of the best buys is as follows: •
The first increment is the no action alternative that provides no additional HU with zero cost.
•
The second increment provides for the placement of sand or gravel in Subarea 1. This plan would yield 0.7 HU at a cost of $7,800.
•
The third increment provides for the operation of a fish ladder combined with the placement of sand or gravel in Sub-area 1. This plan would provide an additional 49.04 HU with an additional cost of $716,400, resulting in a cost per HU of $14,600.
•
The fourth increment is similar to the third with the addition of wetland creation in Sub-areas 3 & 4. This plan would provide an additional 15.71 HU with an additional cost of $1,322,200, resulting in a cost per HU of $84,200.
•
The fifth increment would add to increment 4 the placement of sand or gravel in Sub-area 4. This plan would provide an additional 0.84 HU at an additional cost of $76,700, resulting in a cost per HU of $91,300.
•
The sixth increment is the same as Increment 5 with the addition of removal of invasive species and restoration of wetlands in Sub-area 5. This plan results in an additional 12.05 HU and an additional cost of $1,137,100 for an incremental cost of $94,400 per HU.
•
The seventh increment is the same as Increment 6 with the addition of sand and gravel placed in Sub-area 6. This plan would provide for an additional 0.79 HU at a cost of an additional $84,100, resulting in a cost per HU of $106,500.
•
The eighth increment is the same as Increment 7 with the addition of sand and gravel placed in Sub-area 2. This plan would provide for an additional 0.69 HU at a cost of an additional $75,100, resulting in a cost per HU of $108,500.
•
The ninth increment is the same as Increment 8 with the addition of sand and gravel placed in Sub-area 5. This plan would provide for an additional 0.42 HU at a cost of an additional $48,700, resulting in a cost per HU of $116,000.
•
The tenth increment is the same as Increment 9 with the addition of the removal of invasive species and wetland restoration in Sub-area 3. This plan would provide for an additional 8.52 HU at a cost of an additional $1,150,400, resulting in a cost per HU of $135,000.
•
The eleventh increment is the same as Increment 10 with the addition of the removal of invasive species and wetland restoration in Sub-area 4. This plan would provide for an additional 9.26 HU at a cost of an additional $1,500,500, resulting in a cost per HU of $162,000.
C-14
Malden River Ecosystem Restoration – Appendix C – Cost Effectiveness, IA & Resource Significance ____________________________________________________________________________________________________________
•
The twelfth increment is the same as Increment 11 with the addition of the removal of invasive species and wetland restoration in Sub-area 6. This plan would provide for an additional 39.41 HU at a cost of an additional $8,279,700, resulting in a cost per HU of $210,100.
•
The thirteenth increment, the last increment, adds removal of invasive species and wetland restoration in Sub-area 2 to Increment 12. This plan would provide for an additional 3.65 HU at a cost of an additional $812,100 resulting in a cost per HU of $222,500.
The best buy plan curve is the incremental cost curve. Incremental cost and incremental output are the changes in cost and output when the cost and output of each successive plan in terms of increasing output are compared. Incremental cost per output is the change in cost divided by the change in output, or incremental output, when proceeding to plans with higher levels of output. Table 3 shows incremental cost per habitat unit for each best buy alternative.
Table 3. Incremental Cost Curve ($000). Increment
Plan
HU
Cost
Incremental Incremental Cost Per
1
A0B0C0D0E0F0G0H0I0J0K0L0M0N0O0P0Q0
0.00
0.0
Cost 0.0
2
A0B0C0D0E0F0G0H0I0J0K0L1M0N0O0P0Q0
0.70
7.8
7.8
0.7
11.1
3
A0B0C0D0E0F0G0H0I0J0K0L1M0N0O0P0Q1
49.74
724.2
716.4
49.04
14.6
4
A0B0C0D0E0F0G0H0I0J0K1L1M0N0O0P0Q1
65.45
2,046.4
1,322.2
15.71
84.2
5
A0B0C0D0E0F0G0H0I0J0K1L1M0N1O0P0Q1
66.29
2,123.1
76.7
0.84
91.3
6
A0B0C0D0E0F0G0H0I1J0K1L1M0N1O0P0Q1
78.34
3,260.2
1,137.1
12.05
94.4
7
A0B0C0D0E0F0G0H0I1J0K1L1M0N1O0P1Q1
79.13
3,344.3
84.1
0.79
106.5
8
A0B0C0D0E0F0G0H0I1J0K1L1M1N1O0P1Q1
79.82
3,419.4
75.1
0.69
108.8
9
A0B0C0D0E0F0G0H0I1J0K1L1M1N1O1P1Q1
80.24
3,468.1
48.7
0.42
116.0
10
A0B0C0D0E0F0G1H0I1J0K1L1M1N1O1P1Q1
88.76
4,618.5
1,150.4
8.52
135.0
11
A0B0C0D0E0F0G1H1I1J0K1L1M1N1O1P1Q1
98.02
6,119.0
1,500.5
9.26
162.0
12
A0B0C0D0E0F0G1H1I1J1K1L1M1N1O1P1Q1 A0B0C0D0E0F1G1H1I1J1K1L1M1N1O1P1Q1
137.43 141.08
14,398.7 15,210.8
8,279.7 812.1
39.41 3.65
210.1 222.5
13
Output 0
Output 0.0
In the incremental cost curve (shaded area in Table 3), incremental cost per unit increases with output, or habitat units. Development of the incremental cost curve facilitates the selection of the best alternative. The question that is asked at each increment is: is the additional gain in environmental benefit worth the additional cost? In this study, the incremental cost curve consists of 13 points. The largest relative increase in the curve occurs between Increments 3 and 4, an increase of approximately 83 percent. The National Environmental Restoration Plan appears to be increment 11. The Best Buy Plan 12
C-15
Malden River Ecosystem Restoration – Appendix C – Cost Effectiveness, IA & Resource Significance ____________________________________________________________________________________________________________
incremental cost increases about 30 percent between Increment 11 and Increment 12. Additionally, project cost increases from $6,119,000 to $14,398,700, an increase of about 135 percent. Increment 11 would provide for the removal of invasive species and wetland restoration in Sub-areas 3, 4, and 5; the creation of wetlands in Sub-Area 4; the placement of sand or gravel in Sub-Areas 1, 3, 4, 5, and 6; and the operation of a fish passage. INCREMENTAL ANALYSIS SUMMARY The results of the cost effectiveness and incremental cost analyses indicate that there are 276 cost effective alternative restoration plans. Utilizing the output assessment method, there are thirteen (13) Best Buy Plans for consideration. With the exception of Best Buy Plan 2, all Best Buy Plans contain the operational changes at Amelia Earhart Dam component (Q1). Another common component to all with the exception of Best Buy Plans 2 and 3 is the wetland creation element (K1). This measure provides an output of 15.71 habitat units at a cost of $1,137,100. Best Buy Plans 6 through 9 consists of the wetland creation (K1) and the removal of invasive species with replanting of native species in sub-area 5 (I1) components in each. An additional fish substrate placement sub-area is added incrementally. The cost of these plans range from $3,260,200 to $3,468,100 with habitat units ranging from 78.34 to 80.24. Best Buy Plans 9 through 11 warrants consideration as the National Environmental Restoration Plan. Each plan contains the wetland creation (K1), and fish substrate placement in sub-areas 1, 3, 4, 5, and 6. However, Plan 9 contains the removal of invasive species with replanting of native species in sub-area 5 (I1), Plan 10 contains the removal of invasive species with replanting of native species in sub-area 3 and 5 (G1, I1), and Plan 11 contains the removal of invasive species with replanting of native species in sub-area 3, 4 and 5 (G1, H1, I1). The Best Buy Plan 12 incremental cost increases about 30 percent between Increment 11 and Increment 12. Additionally, project cost increases from $6,119,000 to $14,398,700, an increase of about 135 percent.
C-16