J. Phys. A Math. Gen. 26 (1993) 373-383. Printed in the UK
Angle of repose and angle of marginal stability: molecular dynamics of granular particles Jysoo Lee and Hans J Herrmann HLRZ-KFA Jiilich, Postfach 1913, W-5170 Jilich, Federal Republic of Germany Received 17 August 1992
an implemenlalion of realistic static friction in molecular dynamics simulations of granular particles. In our model, to break contact between two particles, one has to apply a Bnile amount of force, determined by the Coulomb criterion. Using a Wo.dimmsional model, we show that piles generated by avalanches have a @e angle of repose 8, (finite slopes). Furthermore, these piles are stable under tilting by an angle smaller lhan a non-zero tilting angle h,showing that 8 R is different from the angle of marginal stability Oms.which is the maximum angle of stable piles. These measured angles are compared to a theorelical approximation. We also measure 8Ms by continuously adding particles on the top of a stable pile. AbstracL We present (MD)
1. Introduction
Systems of granular particles (e.g. sands) exhibit many interesting phenomena [l31. The formation of spontaneous heap [ 4 4 ] and convection cells [7-111 under vibration, density waves found in the outflow through hoppers [12-161 and segregation of particles [17-201 are just a few examples. These phenomena are consequences of the unusual dynamical response of the system. One of the characteristic properties of a granular system is that it can behave both like a solid and a fluid. One can pour (like a fluid) sand grains on a table, and they form a stable pile with finite slope (like a solid). Part of the reason why it acts like a solid is due to static friction. By static friction, we mean that one has to apply a force larger than a certain threshold value in order to break contact between particles. This threshold is determined by, for example, the Coulomb criterion. Static friction is responsible for many static structures (e.g. sand pile), and has a possible implication in the dynamics of granular systems (for example, it is argued that the density waves formed in [14] are due to ‘arching’, which is a consequence of static friction. See also, ‘bridge-collapsing’ in shear cells [21]). Despite its importance, the effect of static friction has been studied much less then other microscopic mechanisms. This is mainly due to the difficulty of including static friction in a theoretical framework or a simulational scheme. We present an implementation of static friction in a molecular dynamics (MD) simulation, which uses.a scheme introduced by Cundall and Strack [22]. Using this code we generate piles by first filling a (two-dimensional) box with grains, then removing a sidewall. The slope of the pile is finite, which is related to the finite ‘angle of repose (e,)’. Here, tanBR is defined to be the slope of the pile. This angle is strongly dependent on the friction coefficient p and is insensitive to other parameters 0305-4470/mM20373+11$07.50 @ 1993 IOP Publishing Ltd
373
314
J Lee and H J Hemnann
of the system. Furthermore, we find that the pile obtained is stable under tilting by an angle smaller than the finite tilting angle e,, where 0, is typically a few degrees. This suggests that the angle 01 marginal stability BMS, the maximum angle of stable piles, is larger than eR,which has been observed in real sandpile experiments [3,23]. We also study the situation which occurs by adding more particles to a stable pile. The We also propose angle at which the pile becomes unstable can be interpreted as .e, a theoretical method with which to calculate BMS and 0, from an approximate stress distribution obtained by Liffman et a1 [21]. The theoretical values show a similar dependency of the measured angles on the friction coefficient p . 2. Definition of the model
The interaction between real sand grains is too complicated to construct a model in which all the properties of a granular system can be accurately described. Instead of constructing a model to reproduce all the details from the beginning, it is often advantageous if one identifies the basic ingredienis of the system and then constructs a model with these ingredients. It is often true that the qualitative behaviour of a system is independent of the fine details of the model. ' b o important ingredients for a granular system are: (1) repulsion between two particles in contact; (2) dissipation of energy during collision. In certain cases the rotation of the particles could be important [25]. In previous molecular dynamics (MD) simulations of granular systems most of these ingredients, if not all, were incorporated. For example, repulsion and dissipation is included in most MD simulations of granular particles [lo, 11,16, IS,22,24-27]. Some of these simulations also included the rotational degree of freedom [16,18,22,24-261. Here, we will construct a model which includes repulsion, dissipation and static friction, but the model does not have rotational degrees of freedom. An individual grain is modelled by a spherical particle. These particles intcract with each other only if they are in contact. Consider two particles i and j in contact in two dimensions. Let the coordinate for the centre of particle i (j)be Ri( R , ) and r = Ri- R j . A vector n is defined to be a unit vector parallel to the line joining the centres of two particles, r/r. Another vector 8 , which is orthogonal to n,is obtained by rotating n by ~ / in2 a clockwise direction. We also define the relative velocity II to be - q, and the radius of particle i to be a i . The force on particle i exerted by particle j, F,,;, can be written as
F. 1 3 '. = F,n+F,s
(1)
where the normal force Fn is given by
The first term of (2)is the three-dimensional Hertzian repulsion due to elastic deformation, where IC, is the elastic constant of the material. The second term is a velocitydependent friction term, which is introduced to dissipate energy from the system. Here, yn is a constant controlling the amount of dissipation, and me is the effective mass mimj/( mi m l ) .The second term of (l), the shear force F, is
+
Angles of repose and marginal stabiliy
315
where the first term is a velocity-dependent damping term similar to the one in (2a). The second term of (2b) simulates the static friction. The basic idea is the following [22]. When two particles start to touch one another, one puts a 'virtual' spring in the shear direction. For the total shear displacement 6s during the contact, there is a restoring force, k&, which is a counter-acting frictional force. The maximum value of this restoring force is given by Coulomb's criterion-pF,. When particles are no longer in contact with each other, we remove the spring. We want to emphasize that one has to know the total shear displacement of particles during the contact, not the instantaneous displacement in order to calculate the static friction. In other words, one has to remember whether a contact is new or old. The rotation of the particles is not included in the present simulation. The particles can also interact with walls. If particle i is in mntact with a wall, the force exerted by the wall on the particle has exactly the same form as (2) with a j = 0 and mj = 00. There is also a gravitational field. The force acting on particle i as a result of the field is -m;g.The total force acting on particle i is the vector sum of the particle-particle interaction@), the particle-wall interaction@) and the gravitational force. The trajectory of a particle is calculated by the fifth-order predictor-corrector method [B]. We use two Verlet tables. One is the usual table with finite skin. The other table is a list of pairs of actually interacting particles which is used to calculate the static friction term. For a typical situation, the CPU time needed to run 1372 particles is about 0.01 s per iteration on a Cray-YMP, which is comparable to the speed of the layered-link-cell implementation of a short-range Lennard-Jones system [29,30]. 3. Obtaining the angle of repose
As a non-trivial check whether the static friction term is working, we measure OR as follows. We start by randomly putting N particles in a box of width W and height H. The particles fall due to gravity, and lose their energy due to dissipation. After a long time they fill the box with no significant motion. We show in figure l ( a ) an example of the system at this stage. Here the parameters are p = 0.2, k, = lo6, ks = lo4, 7" = 5 x lo2, 7%= y,/lOO, and for walls, k, is chosen to be 2 x lo6. We checked the motions of the particles by monitoring the total kinetic energy of the system. The average kinetic energy per particle during the whole sequence is shown in figure 1(b). The kinetic energy sharply rises when the wall is removed The pile relaxes in an oscillatory manner (see figure l(b)). Next, we remove the right wall, let the particles move out of the box and wait until the system reaches a new equilibrium. Figure l(c) is the equilibrium reached by starting from figure l(a). As shown in the figure, the new state has non-zero slope. There are several ways to measure OR. We could first divide the box into several vertical cells, the width of each cell being equal to the average diameter of the particles. For the centre of each cell z, we find the maximum position h ( + )of the particles in the cell. The line joined by these positions is a 'surface' of the structure. Having determined h ( z ) ,we can use three different ways to measure the slope: (1) by joining h(0) and h( W); (2) by fitting a straight line to h ( z ) using the method of least squares; and (3) by fitting a parabola to h ( i ) by the least-squares method. Here, if h(i) is a straight line, the sum is a parabola. In the case of h(+) being a
c,z=u
316
J Lee and H J Hemnann
."
iteration
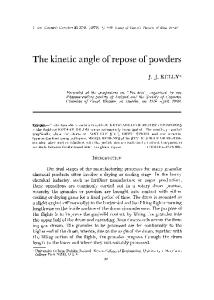
Figure 1. (a) Box iiiied with N = 1600 particles just before the righl wall is removed. The thickness 01 the lina between centres are pmportional lo the normal force. (b) Average liinetic energy per particle (in erg) during the whole sequence of simulation. The energy initially increases as particles fall down, then decays with lime. When the light wall IS remaved (iteration = 30000). it increase3 again. (c) Static pile obtained
after the avalanche.
Angles of repose and marginal stabiliry
377
straight line, these three methods should give identical results. In our simulation the slopes obtained by different methods differed from each other by a few degrees. For example, we obtained (1) 20.144 2.15, (2) 18.904 1.49 and (3) 17.884 1.76 for a 400 particle system with p = 0.2. Here the angles were averaged over ten samples. We find, on average, the angle by method (1) is larger than (2), and (2) is larger than (3), although they are within the error bars of each other. It is quite possible that these differences arise as a result of the finite size of the system. From now on we only consider method (3) for calculating the slope. 4. Parameter dependences
For a fixed set of parameters which specify all the interactions, we study the dependence of 8, on the geometry, namely the aspect ratio ( H / W ) of the box and the linear size of the system. The parameters are k, = lo6, ks = 104, -yn = 5 x 10², rJ= y,/lOO. For walls, k, is chosen to be 2 x 10⁶ to prevent particles from escaping from the box. Since a system of particles with equal radii tends to form an hexagonal packing, we use particles with different sizes. The radii of the particles are drawn from a Gaussian distribution with a mean of 0.1 and a width of 0.02, and the maximum (minimum) cut-off radius of a particle is 0.13 (0.07). In figure 2(a), we show the dependence of the angle 8, on the height H, for values of p = 0.2 and width W = 2.0. Each angle is obtained by averaging over 20 samples. The error plotted in figure 2(a) is the mean-square sample-to-sample fluctuation. Here, we cannot see any systematic dependence on H. For other values of p we also find that 8, does not depend on the aspect ratio as long as the ratio is sufficiently larger than the slope of the pile generated. We then fix the aspect ratio to be two, and study the dependence on the size of the system. The angle 8, is shown in figure 2(b) for different values of W . All angles, as well as those presented in figure 2(b), are averaged over 20 samples, unless specified othenvise. For p = 0.2 these angles decrease for small sizes and seem to saturate starting around W = 3.5. For larger values of p the angle saturates for larger values of W.For example, the angle continues to decrease until W = 4.0 for p = 0.3. On the other hand, for smaller p , the angle saturates for smaller W . For p = 0.1, there is no obvious trend in the data, even up to the very small values of IY = 1.5. Since we do not want the angle obtained by this simulation to suffer from a finite-size effect, we use the values W = 4 and H / W = 1 in order to calculate 8,. We will also study cases of p not larger than 0.2. The simulation for larger values of p is limited due to the fact that one needs a larger aspect ratio and system sizes to be free of any finite-size effects. Next we study how 8, depends on the various interaction parameters in the system: 7,k and p. In a static configuration, the damping term is absent, so ideally 7 terms do not change 0,. However, since we prepared the sandpile by a dynamical method (by causing an avalanche), the angle may depend on 7. Also, ks is an the elastic constant of the artificial spring we introduced, so it should not make any difference in a static configuration, as long as we keep the value in a reasonable range. The quantity of particular interest is the friction coefficient p, since p determines whether contacts between particles are stable (‘stick’) or unstable (‘slip’), Since the stability of the whole structure (e.g. a pile) will be strongly influenced by the stability of individual contacts, we expect 0, will be strongly dependent on p. For example, 8, should be zero for p = 0, if the individual grains in the pile are not moving. We first
378
J Lee and H J Herrmann
Figure 2. (a) The angle of repose B R against the height H with the width W = 2 and
p = 0.2 The angle seems to just fluctuate, and no systematic dependency is found. (b) The angle of repox b'~ against W for several values of !L; p = 0.1 (diamond), 0.2 (box) and 0.3 (circle). Here, the aspect ratio is !ept at 2.
study the effect of IC, and yn on e,. We will limit ourselves to a study of the general trends such as the direction and the order of magnitude of the changes. We also fix p = 0.2. We measure the angle (inside the parentheses) for three different values of k,, 104 (16.53 f 0.73), 16 (18.65 f0.70) and lo6 ( 1 7 . 9 f0.64). The difference in angle is very small, and there seems to be no systematic dependency. For three values of yo = 50, 100, 500, the angles are 16.47f0.75, 17.152~0.62,17.99f0.64. The angle seems to decrease systematically, as 7. is being decreased. However, the magnitude of the changes is still small (- 5%). Now we study the effect of p. In figure 3, we show 8, obtained for several different values of p. In the range of p we studied, there seems to be a linear relation between the angle and p . This relation can be true for small values of p, but it cannot be true for the entire ranges of p. The maximum 8, is limited to 90a, while the value of p can be arbitrarily large. We will discuss this later. Note that there are two friction coefficients in the system, one between particles and another between particles and walls. We will argue that, for a sufficiently large pile, the friction coefficient which determines 8, is that between the particles. Consider a
Angles of repose and marginal stabilily
319
sandpile on a table. The stress distribution near the top part of the pile would not be altered by the stress distribution at the bottom of the pile. Therefore, only the friction coefficient between particles can change 0, in this region. On the other hand, the stress distribution near the bottom of the pile will be greatly influenced by the particlewall friction coefficient. So, we expect the angle to be different near the bottom of the pile, if the friction coefficients are different from each other. 20.w
I
'
I
'
I
'
I
'
m
I
Figure 3. me angle of repose OR against p with W = H = 4.
6.W
I
5.w 22 4.50 M
I
I
-
5.50
2 .5
-
-
4.00
1.50
.a 3w I
?.s4 2w 1.50
-
-
-
-
-
-
-
. I
-
I
I
Figure A The tilting angle S, against p with W = H = 4.
The piles discussed are generated by causing avalanches. In experiments, the structure just after an avalanche (e.g., figure l(c)) is not critical, but stable. In other words, one must apply an additional finite force to make the structure unstable. One way to apply the force is by tilting the box which contains the pile. The tilting angle 0, is defined as the rotation angle at which the pile becomes unstable. We want to emphasize that 0, is shown to be non-zero for real sandpile experiments. We measure the tilting angle for our model as follows. Starting from a pile like the one deployed in figure l(c), we rotate the whole box clockwise at a constant rate
380
J Lee and H J Hemnann
of degliteration. Then, we record the angle at which the pile starts to move, which is defined as the tilting angle 0,. The tilting angle for several values of p is shown in figure 4. Here, the width of the box W is four, and the aspect ratio is one. Indeed, one needs afiile tilting angle for the piles generated using our model, and it gives us confidence that the model studied here reproduces the behaviour of realistic static friction. The b i t e OT implies that the pile is stable (not Critical), therefore OMS should be larger than 0,. 5. Pile with constant flu
In the previous section, we argued that 0, is smaller than 0, based on the fact that the pile is stable even if it is tilted by a finite angle smaller than 0,. We now propose a method of obtaining the angle of marginal stability as well as the angle of repose. Consider an empty box without a right wall and put one layer of particles at the bottom. We monitor the maximum velocity of the particles. If the maximum velocity is smaller than certain value ucut,then we insert a new particle at the upper left corner of the pile. Once the particle is added, we then wait until the maximum velocity of the particles is again smaller than uCut,then add a new particle. This procedure is repeated for a long time in order to obtain good statistics. In figure 5, we show the angle of the pile just before a new particle is inserted. Here p = 0.2, W = H = 4.0 and ucuI= 0.1.We also simulate the system with uCy,= 0.01, 0.001 and find no essential difference. The angle is zero at the beginning, and increases until it seems to fluctuate only for iterations larger than 4 x 10s. The curve shown in the figure is quite noisy, which suggests that many configurations (or packings) are possible in the steady state. The maximum angle of the pile that can be built up before avalanches is larger than the 0, obtained before. This could be additional evidence that our model reproduces the difference between e, and 0,. We can estimate the difference to be of the order of the distance between the two dotted lines in figure 5. Here the dotted lines represent the mean-square fluctuations of the angle. 25w
,
0 00
.
,
0.50
,
,
IW
.
,
,
1 50
,
204
.
,
?.50
I
i I"l\llf
iterations Figure 5. The angle of pile measured when we add
dotted lines indicate the width of the fluctuation.
a new particle to the pile. The
two
Angles of repose and marginal stabilily
381
6. Theoretical approach
In the previous section we measured the various angles OR, 0, and for the model sand. How can we understand these angles? In order to calculate these angles one should know the stress field inside the pile. W m a n et a1 [24] suggested an approximate way of calculating the field in a packing of equal-sized spheres which is illustrated in figure 6. In order to calculate the stres at a point 0, one draws two lines of slope & (line OA) and -& (line OB) starting from point 0. Then the length of the lines (1, and l,) within the pile (and above the point) is approximately proportional to the force exerted by the pile. For a more detailed explanation as well as for the justification of this procedure, see [26].From this stress Eeld we calculate OMS as follows. Consider a point at the bottom of the pile. The normal (to the bottom surface) force at that point is ( l A + 1,) s i n ( r / 3 ) , while the tangential force is (1, - I,) cos( r / 3 ) . We then apply the Coulomb criterion. If the ratio of the tangent to normal force is larger than p then the contact is unstable. In this way, for given p, we obtain the range of angles at which the pile is stable. The largest angle at which the pile is stable is the angle of marginal stability, which is
e, = tan-lpp).
Figure 6. The sf-
(3)
at a point inside the pile is approximately the vector sum of line A
and B.
Since 0, t 0, is approximately the angle of marginal stability, we plot in figure 7(a) both the measured value of 8, ST and the value of 0, calculated using the procedure described earlier. The difference between the two angles is either due to the fact that e,, # BR t 0, or the error of the approximation. In fact the approximation (and r/3 angle) is derived from an ordered packing of the particles with the same radius. It is possible that the stress field in a disordered packing is very different from that of an ordered one. In that case one needs a new approximation scheme to calculate the stress field. We can also calculate 0, for given angle of repose 0, and p. It is given by
+
382
J Lee and H J H e m a n n
where
+ +
+
R = tan(r/3 ST) tan(@,) cos(rr/3 e,) tan( n / 3 - e,) - tan( e,) cos( s / 3 - e,)
.
The 0, obtained by (4) as well as the measured tilting angle are plotted in figure 7(b). One can also see that the difference between the two is small. Unlike the difference in figure 7(a), these two angles should coincide if the stress distribution is calculated correctly. 3500
30.w
25.m
s
2o.m
.?
Ism 10.00 5.00
OW .5.W 0.W
0 05
0.10
0 IS
(I ?O
1 . . .
6.03
El o measured
1.M
-
4.w
-
1.W
-
?W
-
calculated
...................
"
0
g 2 .-
I I
1.w
" " "
' " ' ' . I
005
0.10
"
, . I ' 0.15
' , . . / " " "
0.20
0.23
Figure 7. ( U ) The measured OR t S, and the calculated 0- are shown lor several values 01 p. There is a difference between the two. (b) The measured and calculated 0, for different values of p. The difference is smaller than that of (U).
The main point of presenting the theoretical approach is to show a 'first' approximation for the problem, not to provide a quantitative comparison between the measured and calculated angle. In order to obtain more accurate numbers one has to find a better way of calculating the stres field inside the pile. However, it is encouraging to see that even the values obtained by the first approximation are comparable with the measured ones.
Angles of repose and marginal stability
383
Acknowledgment We thank G Ristow for many informative discussions.
References [l] Savage S B 1984 Adu AppL Mech 24 289; 1992 Disordtr and Gnmular Me& ed D Bideau (Amsledam: North-Holland) Campbell C S 1990 A m Rw. Fluid Mech. 22 57 Jaeger H M and Nagel S R 1992 Science 255 1523 K v q u e P and Rajchenbach J 1989 Phys Rev. Leu. 62 44 Laroche C,Douady S and Fawe S 1989 1. Physique 50 699 Clement E,Duran J and Rajchenbach J 1992 Preprint RAlkai G 1976 Powder RchnoL IS 187 Savage S B 1988 . ! Fluid Mech 194 457 Zik 0 and Slavans J 1991 Europhys. L m 16 255 [lo] Gallas J A C, Herrmann H J and Sokoiowki S 1992 Phys Rev. Leu. in press [ll] lsguchi Y-H 1992 Preprint [12] C u l m J 0 and Pulfer R F 1967 Powder T e h d 1 213 [13] Pitlman E B and Schaeffer D G 1987 Commun h e AppL Mah 40 421 1141 Baxter G W. Behringer R P, Fagaert T and Johnson G A 1989 Phys Rm L e a 62 2825 [lS] Caram H and Hong D C 1991 Phys. Rar Len. 67 828 [16] Ristow G 1992 J. Physigue I 2 649 [17] Williams J C 1976 Powder Tcchnol 15 245 pS] Haff P K and Werner B T 1986 Powder TechnoL 48 239 [19] Rosa10 A, Strandburg K J, Prim F and Swendsen R H 1987 Phys. Rn! Len 49 59 1201 DRillard P 1990 J. Physique 51 369 [Zl] Bashir Y M and Goddard J D 1991 J RheoL 35 849 (221 Cundall P A and Strack 0 D L 1979 Geotechnique 29 47 1231 Briscoe B J, Pope L and Adams M I 1984 Powder TcchnoL 37 169 [24] Liffman K,Chan D Y C and Hughes B D 1992 Pnprnt I251 Campbell C S and Brennen C E 1985 1 Fluid Mech 151 167 [26] 'Inompson P A and Grest G S 1991 P b s . Rev. Lett 67 1751 [27] Hong D C and McLennan J A 1992 Preprint [ZS] Tildesley D J and Allen M P 1987 Computs Simuhfiom of Liquidr (Oxford: Oxford Universily P W [29] Grest G S, Dtnweg B and Kremer K 1989 Compul. Phy. Commun 55 269 [30] Diinweg B private mmmunicalion
[Z] [3] [4] [5] 161 171 [8] [9]