Ancient DNA Analyses Reveal High Mitochondrial DNA Sequence Diversity and Parallel Morphological Evolution of Late Pleistocene Cave Bears Michael Hofreiter,* Cristian Capelli,† Matthias Krings,* Lisette Waits,‡ Nicholas Conard,§ Susanne Mu¨nzel,§ Gernot Rabeder,\ Doris Nagel,\ Maja Paunovic,¶ Gordana Jambre˘sic´,¶ Sonja Meyer,* Gunter Weiss,* and Svante Pa¨a¨bo* *Max-Planck-Institute for Evolutionary Anthropology, Leipzig, Germany; †Institute of Legal Medicine, Catholic University of S. Cuore, Rome; ‡Fish and Wildlife Resources, University of Idaho; §Institut fu¨r Ur- und Fru¨hgeschichte, Eberhard-KarlsUniversita¨t Tu¨bingen, Tu¨bingen, Germany; \Institute of Palaeontology, University of Vienna, Vienna, Austria; and ¶Institute of Quaternary Paleontology and Geology of the Croatian Academy of Sciences and Arts, Zagreb, Croatia Cave bears (Ursus spelaeus) existed in Europe and western Asia until the end of the last glaciation some 10,000 years ago. To investigate the genetic diversity, population history, and relationship among different cave bear populations, we have determined mitochondrial DNA sequences from 12 cave bears that range in age from about 26,500 to at least 49,000 years and originate from nine caves. The samples include one individual from the type specimen population, as well as two small-sized high-Alpine bears. The results show that about 49,000 years ago, the mtDNA diversity among cave bears was about 1.8-fold lower than the current species-wide diversity of brown bears (Ursus arctos). However, the current brown bear mtDNA gene pool consists of three clades, and cave bear mtDNA diversity is similar to the diversity observed within each of these clades. The results also show that geographically separated populations of the high-Alpine cave bear form were polyphyletic with respect to their mtDNA. This suggests that small size may have been an ancestral trait in cave bears and that large size evolved at least twice independently.
Introduction It is generally accepted that brown bears (Ursus arctos) and cave bears (Ursus spelaeus) are sister species (Kurten 1957, 1976; Ha¨nni et al. 1994; Loreille et al. 2001). However, in contrast to brown bears, cave bears had a patchy distribution across Europe (Kurten 1976; Musil 1980, pp 5–10; Rabeder, Nagel, and Pacher 2000, pp. 60–62). They also exhibited a variety of morphologically different forms (Kurten 1976; Rabeder, Nagel, and Pacher 2000, pp. 65–67). Of particular interest are smaller cave bears that have been found at elevations above 1,300–1,500 m in the Alps. These have been classified both as common cave bears (Reisinger and Hohenegger 1998) and as a separate subspecies or even as a separate species, purportedly representing an early branch of the cave bear lineage (Rabeder 1983; Rabeder and Nagel 2000). Thus, it is of interest whether different populations of small cave bears shared a common mtDNA ancestor with respect to the large-sized forms. Recently, ancient DNA analyses of the remains of 10 cave bears have been published (Loreille et al. 2001), including a 282-bp piece of the control region for six specimens. Although this study convincingly showed that brown bears and cave bears are reciprocally monophyletic, it did not address questions about the genetic diversity or population history of cave bears. Here, we report the determination and analysis of 285 bp of the mitochondrial control region from 12 cave bears originating from nine different caves. Key words: ancient DNA, cave bear, genetic diversity, MRCA, parallel evolution, phylogeography. Address for correspondence and reprints: Michael Hofreiter, MaxPlanck-Institute for Evolutionary Anthropology, Inselstr. 22, D-04103 Leipzig, Germany. E-mail:
[email protected]. Mol. Biol. Evol. 19(8):1244–1250. 2002 q 2002 by the Society for Molecular Biology and Evolution. ISSN: 0737-4038
1244
Materials and Methods DNA Extraction, PCR, and Sequencing DNA was successfully amplified from 12 samples originating from nine different caves (H002 Hohle Fels, Germany; H032 Zoolith Cave, Germany; H044 Grotte Merveilleuse, France; G123 and G124 Geißenklo¨sterle Cave, Germany; PZ189 Potocka Zijalka, Slovenia; CON235 Conturines Cave, Italy; R291 and R293 Ramesch Cave, Austria; Vin-G6 and Vin-G1585 Vindija Cave, Croatia; and N117 Nixloch Cave, Austria). Except Vin-G6, which was 14C dated by a tandem accelerator ˚ ngstro¨m Laboratory, mass spectroscopy (TAMS) at the A 14 Uppsala, all samples were C dated by TAMS at Beta Analytic Inc. (Miami, Fla). For 24 additional samples, no or only sporadic amplifications of cave bear mtDNA sequences could be achieved. Extractions were carried out as follows: approximately 50 mg of bone-tooth powder were incubated in 1 ml of 0.5 M EDTA, pH 8.0, 5% N-laurylsarcosine, 2% cetyl-trimethyl-ammoniumbromide (CTAB), 0.3 mg/ml proteinase-K and 5 mM Nphenacylthiazolium bromide (PTB) (Poinar et al. 1998) for 96 h at room temperature. DNA was extracted by binding to silica as described by Ho¨ss and Pa¨a¨bo (1993) and Poinar et al. (1998). The final volume of the extract was 100 ml, of which 5 ml was used for a single PCR reaction. PCRs contained 1.25 U AmpliTaq Gold (Perkin-Elmer, USA), 13 AmpliTaq Gold buffer, a final concentration of 250 mM for each dNTP, 250 pM for each primer, 2.5 mM MgCl2, and 0.25 mg/ml bovine serum albumin in a final volume of 40 ml. Primary amplifications were performed on an MJ Thermo Cycler with a 3-min activation step at 948C, followed by 60 cycles at 938C for 30 s, 418C for 60 s, and 728C for 30 s. PCR products were isolated from 2.8% agarose gels and melted in 100 ml double-distilled water. Five microliters of the melted product was used for reamplifications for 30
Cave Bear Population Genetics
1245
cycles under the PCR conditions described earlier, except that the activation step was prolonged to 7 min and the annealing temperature was 458C. Reamplification products were cloned using the Topo TA Cloning Kit (Invitrogen, The Netherlands). In cases where no primer dimers were observed in the primary amplification, the product was cloned directly. The primers used were: CB 2558 (3R) 59-GGA GCG AGA GGT ACA CGT-39 CB 2620 (3F) 59-GCC CCA TGC ATA TAA GCA TG-39 CB 2670a (1F) 59-CTA TTT AAA CTA TTC CCT GGT ACA TAC-39 CB 2671d (2R) 59-TAA ACT TTC GAA ATG TAG GTC CTC ATG-39 CB 2718a (2F) 59-CAT CTC ATG TAC TGT ACC ATC ATA GT-39 CB 2719 (1R) 59-ATG GGG GCA CGC CAT TAA TGC-39
The clones were sequenced on Alf Express automated sequencers directly from colony PCRs (Kilger et al. 1997) using the Thermo Sequenase Kit (Amersham Pharmacia Biotech, Germany) or on an ABI 3700 capillary sequencer after plasmid preparation. For each segment sequenced, a minimum of six clones, three from each of two independent amplifications, were sequenced using M13 universal primers. If all clones from one amplification consistently differed from all clones from another amplification at one or more positions, a third amplification was performed from the extract to determine which sequence was reproducible. Mock extractions without sample and PCR blanks were performed to monitor contamination. Sequence Analysis Three overlapping amplicons were used to reconstruct approximately 285 bp of the mtDNA hypervariable region I. Consensus sequences were constructed for each sample and aligned by eye to a brown bear sequence (GenBank accession number X75866). All 12 novel cave bear sequences determined in this study have been deposited in GenBank, accession numbers AJ300166–AJ300177. For the analyses, 53 brown bear mtDNA lineages (i.e., unique mtDNA sequences) were obtained from GenBank and our own data. Six additional sequences, representing four additional cave bear mtDNA lineages, were obtained from the literature (Loreille et al. 2001). A pyrimidine stretch of variable length was removed from all sequences, resulting in an alignment of 260 bp for both brown and cave bears. Unrooted quartet puzzling trees were reconstructed for the 13 cave bear mtDNA lineages using the PUZZLE program. The rate heterogeneity parameter was estimated from the data set, assuming gamma distributed rates
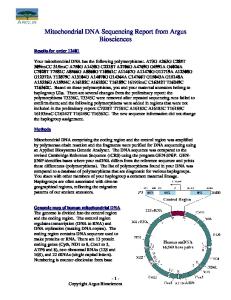
FIG. 1.—Locations from which cave bear mtDNA sequences are available. Caves with high-Alpine, small-sized cave bears are underlined. Locations for mtDNA sequences from Loreille et al. (2001) are italicized.
with eight variable rate categories. Tree reconstructions were carried out using the TN model (Tamura and Nei 1993) for substitution. The maximum likelihood tree found for the cave bears was compared with all possible trees where the sequences from the small-sized cave bears form a monophyletic group by a maximum likelihood ratio test (Kishino and Hasegawa 1989) as implemented in the PUZZLE program (Strimmer and von Haeseler 1996). A neighbor-joining tree was reconstructed with Kimura-2-parameter–corrected distances for all brown and cave bear lineages with two black bear (Ursus americanus, accession numbers AF012320 and U34265) sequences as an outgroup using the program MEGA2 (Kumar et al. 2000). Mean pairwise sequence differences (MPSDs), both within and between populations, were calculated using the program avh-2 (A. von Haeseler, personal communication). To account for a possible sampling bias, both in the cave bear (from some locations sequences could be obtained from two samples, from others only from one sample) and in the brown bear (e.g., 65 samples from Alaska gave identical sequences, whereas only few sequences are available from Asian brown bears) data, we used mtDNA lineages for estimating the MPSDs. For calculating the time to the most recent common ancestor (MRCA), a Bayesian approach (Tavare et al. 1997) was used. We tested the constant size model using Tajima’s D, Fu and Li’s D* and Fu and Li’s F* as implemented in the software package DNASP (Rozas and Rozas 1999). Results DNA Sequence Retrieval DNA was extracted from the bones or teeth of 36 cave bears from nine caves in Austria, Croatia, France, Germany, Italy, and Slovenia. (fig. 1). For 12 of these extracts, three overlapping amplifications of 113, about 118, and 135 bp (without primers) were successful at least twice after 2 to 14 attempts. Two independent am-
1246
Hofreiter et al.
plification products from each fragment were cloned and the inserts of 3 to 15 clones sequenced. If an amplification starts from a few molecules or a single molecule, misincorporations caused by damage of the template molecule will be carried by the majority, or all, of the molecules in the amplification product. This phenomenon has been seen previously in amplifications from ancient DNA (Handt et al. 1996; Krings et al. 1997; Krings et al. 1999), which is known to carry nucleotide modifications that are miscoding (Ho¨ss et al. 1996). At 53 sequence positions, all clones from one amplification carried a base different from those of all clones from the second amplification. In these cases the amplifications were repeated. The bases seen in all clones from two of the three amplifications were interpreted as authentic, whereas bases that could not be reproduced in multiple amplifications were interpreted as having been caused by nucleotide misincorporations in the first or an early cycle of the PCR (Hofreiter et al. 2001a). A total of 538 clones from 87 amplifications was used to reconstruct a 282- to 286-bp sequence of the mitochondrial control region from the 12 cave bear specimens (see supplementary information on MBE website: www.molbiolevol.org). The length variation is caused by the variable length of a pyrimidine stretch of about 28 bp, which is present in all members of the family Ursidae, except in the brown and polar bears, where it has been partly deleted. DNA sequences for six additional specimens from Belgium, France, and Spain (see fig. 1), for which approximately 275 bp overlap with the 12 cave bear DNA sequences determined here, were obtained from the literature (Loreille et al. 2001). Dating A subsample of each of the 12 samples from which the complete DNA sequence was determined was dated using TAMS. The ages range from approximately 26,500 to about 49,000 years (see supplementary information). It should be noted that carbon dates earlier than about 40,000 years are unreliable because trace amounts of contaminating modern carbon may yield later dates. Such dates should therefore be seen as minimum estimates. The ages of the samples from Loreille et al. (2001) are in the range of 25,000–45,000 years, according to stratigraphy. Phylogenetic Analyses Among the 18 mtDNA sequences analyzed, four pairs of sequences are identical. These four pairs come from the caves Geißenklo¨sterle (Germany), Ramesch Cave (Austria), Sclayn (Belgium), and Cova Linares (Spain). In addition, the DNA sequences from Nixloch and Potocka Zijalka are identical after removal of length variation. The 13 cave bear mtDNA lineages (i.e., distinct mtDNA sequences) were aligned to 53 different brown and polar bear mtDNA lineages from Europe, Asia, and North America, as well as to two American black bear mtDNA lineages. A neighbor-joining tree (fig. 2) relating these mtDNA lineages is consistent with
FIG. 2.—Neighbor-joining tree estimating the relation of brown and cave bear mtDNA lineages. The tree was rooted using two American black bear mtDNA lineages. Sites with high-Alpine, small-sized cave bears are underlined. Locations for mtDNA sequences from Loreille et al. (2001) are italicized. See main text for details.
previous findings in that polar bears fall within the variation of brown bears (Talbot and Shields 1996; Shields et al. 2000) and that cave bears are monophyletic with respect to brown and polar bears (Loreille et al. 2001). Moreover, the brown bear mtDNA lineages fall into three major clades (fig. 2). One of these contains mtDNA lineages found in western Europe (denoted west). Another clade contains mtDNA lineages from polar and brown bears from the Admirality, Baranof, and Chicagof Islands off the coast of Alaska (denoted polar/ ABC), whereas the last clade contains mtDNA lineage haplotypes from brown bears in Europe, Asia, and North America (denoted east). These three mtDNA clades may reflect the outcome of population isolation in Late Pleistocene refugia (Kohn et al. 1995, Hewitt 2000) because the polar/ABC clade has been found in Pleistocene bear bones from the mainland of Alaska (Leonard, Wayne, and Cooper 2000). Phylogenetic Relationship of Small-Sized Cave Bears The cave bear clade consists of 10 mtDNA lineages from normal-sized cave bears and three mtDNA lineages from small-sized cave bears, each from three geographically separated regions (fig. 1). To determine whether the various small-sized populations could be monophyletic with respect to their mtDNA, we compared all possible trees in which the mtDNA lineages from the smallsized cave bears form a monophyletic group with the maximum likelihood tree, whose topology is not signif-
Cave Bear Population Genetics
1247
Table 1 Time to the Most Recent Common Ancestor (in years) for Cave Bears, Brown Bears, and the Three Brown Bear mtDNA Clades Species/ Population
Median
Mean
Cave bears . . . . . Brown bears. . . . East . . . . . . . . . West. . . . . . . . . Polar/ABC . . . . .
660,000 890,000 640,000 350,000 420,000
708,000 974,000 702,000 394,000 463,000
95% Equal-tailed Probability Interval 320,000–1,300,000 410,000–1,920,000 290,000–1,390,000 150,000–790,000 190,000–900,000
cave bears show only about half of the species-wide mtDNA diversity of extant brown bears. If the three mtDNA clades found in brown and polar bears are analyzed separately, they show MPSDs of 7.9 6 4.1 (east), 6.1 6 3.1 (polar/ABC), and 5.5 6 2.5 (west). When the distribution of 10,000 replications of 13 randomly drawn eastern brown bear mtDNA lineages is compared with the MPSD of the cave bear mtDNA lineages (fig. 3b), 35% of the east brown bear distribution falls below the variation of the cave bears. Thus, despite their more restricted geographical range, the mtDNA diversity of cave bears was similar to that of brown bears from the east mtDNA clade. Moreover, the genetic diversity of cave bears seems to have been higher than that found in contemporary polar bears and ABC brown bears or west brown bears, which both occupy almost the same area that cave bears did, although the difference is not statistically significant. FIG. 3.—MtDNA sequence diversity of cave and brown bears. (a) The distribution of MPSDs for 10,000 random samples of 13 brown bear mtDNA lineages is shown. The arrow indicates the MPSD for the 13 cave bear lineages (7.6). (b) Distribution of MPSDs for 10,000 randomly drawn samples of 13 brown bear mtDNA lineages from the 32 described from the eastern clade. The solid arrow shows the MPSD for the 13 cave bear lineages (7.6), the dotted solid arrow shows the MPSD for 13 lineages of the western brown bear mtDNA clade (5.5), and the open arrow shows the MPSD for the eight mtDNA lineages of the polar/ABC clade (6.1).
icantly different from that in figure 2. All 60 such trees were significantly less likely as assessed by a maximumlikelihood test (P , 0.05) (Kishino and Hasegawa 1989). Thus, small-sized cave bears are not monophyletic with respect to their mtDNA. Intraspecific mtDNA Diversity To account for the uneven geographical sampling of brown and cave bears, we used mtDNA lineages (i.e., different mtDNA sequences) to calculate the MPSD. The MPSD within all brown and polar bears is 13.2 6 6.1, whereas it is 7.6 6 4.0 for cave bears. To further account for the fact that we have only 13 cave bear mtDNA lineages but 53 brown and polar bear mtDNA lineages, 10,000 sets of 13 mtDNA lineages were randomly drawn from the 53 brown and polar bear mtDNA lineages, and for each set the MPSD was calculated. Only 0.4% of the distribution falls below the value of 7.6 for the cave bear (fig. 3a). Thus, Late Pleistocene
Time to the MRCA To estimate the time to the MRCA for cave bears, all brown bears, as well as the three brown bear mtDNA clades, we used a Bayesian approach (Tavare et al. 1997). Prior distributions were adjusted to cover all plausible parameter values, whereas posterior distributions were estimated by 106 simulations (table 1). Specifically, the prior generation time was set to 10–17 years (Allendorf and Servheen 1986), the divergence time between cave and brown bears to 1.2–1.7 Myr (Kurten 1957; Kurten 1976; Loreille et al. 2001), the pairwise distance between cave bears and brown bears to 20–35 differences, and the population size to 7,000– 425,000. The median time to the MRCA is largest for all brown bears (890,000 years), followed by the cave bears (660,000 years). For the three brown bear mtDNA clades, the times are 420,000, 350,000, and 640,000 years for polar/ABC, west, and east, respectively. Thus, cave bears had a genetic history as long as that of eastern brown bears, despite their much smaller geographical range. Tests for Population Expansions Tajima’s D (Tajima 1989), Fu and Li’s D* (Fu and Li 1993), and Fu and Li’s F* (Fu and Li 1993) were used to test for population expansions assuming selective neutrality. For neither of the two species and for none of the brown bear mtDNA clades was the assump-
1248
Hofreiter et al.
tion of constant size rejected by any of the three tests. Thus, with regard to mtDNA, there is no sign of an increase in population size. Phylogeographic Pattern Although brown bear mtDNA sequences fall into three large clades, bears with mtDNA sequences from different clades are sometimes found in the same area, e.g., in Romania (Kohn et al. 1995) or on the ABC Islands (unpublished data), indicating at least some migration of females. Moreover, although some geographical structure in the frequency of mtDNA lineages is found within these clades (Waits et al. 1998), mtDNA lineages are sometimes found over the entire geographical range of a clade. For example, one sequence from the east mtDNA clade was found in Russia and Estonia, as well as in Alaska. In the case of the cave bears, identical sequences were only found for pairs of samples derived from the same caves, and in fact in the five cases where two specimens from the same cave were analyzed, identical mtDNA sequences were found in four cases. This suggests that the gene flow between caves was restricted. On the other hand, the number of differences between mtDNA sequences correlates neither with geographical distance between the caves from which the samples were excavated nor with the age of the samples. For example, mtDNA sequences from two caves located only 3 km apart (Geißenklo¨sterle and Hohle Fels) differ by 10 substitutions, whereas the sequences from Sclayn (Belgium) and Cova Linares (Spain) differ by only two substitutions. Similarly, the mtDNA sequences from Geißenklo¨sterle and Hohle Fels differ by 10 substitutions but only by 3,000 years in age, whereas one of the Vindija sequences differs from the Nixloch sequence by two substitutions, despite an age difference of 6,000 years. Thus, over longer time periods, mtDNA lineages did not remain geographically restricted. Discussion Reliability of Sequencing Results A number of problems may cause incorrect mtDNA sequences to be determined from ancient animal remains (Hofreiter et al. 2001b). One problem is contamination of the specimen by exogenous DNA, mostly of human origin. Because primers specific to bear mitochondrial DNA were used here, it is unlikely that contamination with human DNA has confounded the results. Another potential problem is the presence of insertions of mitochondrial DNA in the nuclear genome. Such insertions may be mistakenly amplified when primers for mtDNA sequences are used (e.g., Zischler 1995a, 1995b; Greenwood and Pa¨a¨bo 1999). However, a nuclear insertion would need to fulfill several unusual requirements to contribute to the DNA sequences determined here. Firstly, nuclear insertions are expected to evolve slowly, yet the sequences determined here are highly variable. Secondly, in spite of this high polymorphism, all the specimens analyzed would come from homozygous individuals because unique sequences were
determined for each individual. Thirdly, because three different primer pairs were used, they would all need to preferentially amplify the potential insertion rather than the mtDNA sequences (Krings et al. 1997), in spite of the latter being expected to occur in much higher copy numbers than a putative insertion. Finally, DNA damage in the template DNA can potentially cause incorrect DNA sequences to be determined from ancient remains, especially if some form of damage occurred with a high frequency at particular nucleotide positions. However, given the precautions taken, such errors are not expected to influence the results to any appreciable extent (Hofreiter et al. 2001a). Considering the foregoing, we conclude that the mtDNA sequences determined reflect the endogenous mitochondrial DNA of cave bears that lived during the Upper Pleistocene. Diachronical Studies of mtDNA Diversity With mtDNA sequences available from 18 cave bear samples, it is now possible to address questions about cave bear genetic diversity and genetic history. However, in contrast to the situation where a modern population is analyzed, ancient DNA sequences stem from different time points in the past. Thus, mutations as well as changes in allele frequencies caused by genetic drift and selection may have affected the population over the time period from which the DNA sequences are sampled. The effect of mutations can be expected to be relatively minor in this, as well as most other sets of ancient DNA sequences. The age difference of 25,000 years between the oldest and the youngest mtDNA lineages accounts for about 4% of the time to the MRCA for all cave bears (660,000 years). Because the expected time to coalescence for a sample size of n in terms of N generations is E(TN) 5 2(1 2 1/n), a tree based on n 5 13 lineages is expected to coalesce to a tree with n 5 9 lineages within 25,000 years. The difference in the expected length of a tree based on 13 lineages and one based on 9 lineages is about 12%. Because this is based on the maximum age difference of all possible lineage comparisons, less than 12% of the observed differences are expected to be caused by mutations. In contrast, shifts in allele frequencies can be rapid, especially in subdivided populations, e.g., when a population goes extinct and its habitat is recolonized from another population (see Avise 2000, pp. 232–235, for an overview). Therefore, it is impossible to say whether at the time of our youngest samples, all the genetic variation observed in the entire data set was still present among cave bears. However, because mutations are not expected to influence results appreciably, it can be assumed that at the time of our oldest sample, all the variation observed was present among cave bears. Thus, the estimates of cave bear genetic diversity presented may be thought of as referring to a time point about 49,000 years ago.
Cave Bear Population Genetics
Intraspecific mtDNA Diversity It is interesting to compare the distribution of genetic diversity in brown and cave bears because, although closely related and morphologically rather similar, the two species differ markedly in distribution patterns. Whereas brown bears until recently were rather homogeneously distributed in wooded areas in the entire northern part of Eurasia and North America, the distribution of the cave bear was always patchy (Musil 1980, pp. 5–10) and restricted to Europe and western Asia. In four out of the five cases where two cave bear samples from the same cave were analyzed, their mtDNA sequences were identical and in the remaining case (Vindija) quite similar to one another. This seems to suggest that gene flow between different populations of cave bears may have been limited. Limited femalemediated gene flow has also been suggested for brown bears (Waits et al. 1998), although it takes place over longer time periods (Leonard, Wayne, and Cooper 2000). On the other hand, mtDNA sequences originating from Geißenklo¨sterle (north of the Alps), Nixloch and Potocka (in the Alps), and Vindija (south of the Alps), are all closely related and separated from the next closest sequence (Grotte Merveilleuse) by six substitutions. After removal of length variation, the sequences from Nixloch and Potocka are identical, and the sequences from Sclayn (Belgium) and Linares (Spain) differ by only two substitutions, despite the large geographical distance between the two sites. By contrast, the mtDNA sequence from Hohle Fels differs from the Geißenklo¨sterle sequence by 10 substitutions although the two sites are located only 3 km from each other. Thus, although the sharing of two DNA sequences within, but not between, localities indicates that gene flow between cave bear populations was low over shorter time periods, migration even over long distances must have taken place. If cave bears were subdivided into many populations with limited female genetic exchange, different mtDNA sequences could have become fixed in different populations. Because rare sequences are more likely to be lost in panmictic than in subdivided populations, this could have allowed the overall genetic diversity in cave bears to be higher than that in brown bears, which may have been more panmictic. An alternative explanation for the larger genetic diversity relative to geographic area in cave bears could be a recent geographical expansion of brown bears carrying the eastern mtDNA clade. Because no evidence for a population expansion could be detected in any of the three brown bear mtDNA clades or in all brown bear mtDNA, this possibility does not seem likely. Thus, we suggest that cave bears maintained a high level of genetic diversity relative to their geographical range because they were separated in many small populations with limited gene flow between them. Phylogenetic Relationship of Brown and Cave Bears The cave bears sequenced to date (Loreille et al. 2001 and this study) come from a large part of the range
1249
of this species (fig. 1). In addition, they include a specimen from the Conturines population, which is characterized by primitive morphological features and is regarded as an early branch within cave bears (Rabeder and Nagel 2000). Thus, the mtDNA sequences available can be expected to represent well the intraspecific variation among cave bears. In tree analyses, all cave bears fall together and outside brown bears (fig. 2). As noted by others (Loreille et al. 2001), this is further supported by the observation that none of the cave bear mtDNA sequences carries the partial deletion of the pyrimidine stretch found in all brown and polar bears. Thus, the theory of Mazza and Rustioni (1994) that cave bears fall within the variation of brown bears can be rejected. Morphological Evolution Some cave bear populations were morphologically very different from others. The most conspicuous of these are the small-sized forms that existed at high elevations in the Alps and that have been interpreted as an adaptation to life at high altitudes (Ehrenberg 1929; Ehrenberg 1942; Rabeder 1999; Rabeder, Nagel, and Pacher 2000, pp. 65–67). However, it is worth noting that the small-sized cave bears are not monphyletic with respect to their mtDNA. It is also worth noting that the ancestor of the cave bear, U. deningeri, was small in size and that extremely large-sized cave bears appeared only after 150,000 BP (Kurten 1976, Rabeder 1999). Thus, small size could be an ancestral feature rather than an adaptation in cave bears. This suggestion is supported by the observation that the mtDNA sequences from the Sclayn and Nixloch cave bears, which are both among the largest cave bear populations known (Kurten, 1976, Rabeder 1999), are separated by the second deepest divergence in the mtDNA tree (fig. 2). It is further supported by the observation that the mtDNA sequence from the small-sized population from Ramesch falls at the base of the branch leading to the Sclayn population. Thus, we suggest that the small size of the Alpine cave bears was an ancestral trait and that large-sized bears evolved at least twice independently. Further work is necessary to clarify whether some cave bear population indeed decreased in size as an adaptation to life at high altitudes. Acknowledgments We thank Linda Vigilant and two anonymous reviewers for comments on an earlier version of this manuscript, Melanie Kuch, Ivan Nasidze, Hendrik Poinar, David Serre, Mark Stoneking, and Hans-Peter Uerpman for helpful discussions, and Sylvio Tu¨pke for help with the figure design. This work was funded by the DFG and the MPG. LITERATURE CITED
ALLENDORF, F. W., and C. SERVHEEN. 1986. Genetics and conservation of grizzly bears. Trends Ecol. Evol. 1:88–89. AVISE, J. C. 2000. Phylogeography. The history and formation of species. Harvard University Press, Cambridge, Mass.
1250
Hofreiter et al.
EHRENBERG, K. 1929. Die Ergebnisse der Ausgrabungen in der Schreiberwandho¨hle am Dachstein. Palaeont. Z. Berlin 11: 261–268. ———. 1942. Berichte u¨ber Ausgrabungen in der Salzofenho¨hle im Toten Gebirge. II. Untersuchungen u¨ber umfassendere Skelettfunde als Beitrag zur Frage der Form- und Gro¨ßenverschiedenheiten zwischen Braunba¨r und Ho¨hlenba¨r. Palaeobiologica 7:531–666. FU, X. Y., and W. H. LI. 1993. Statistical tests of neutrality of mutations. Genetics 133:693–709. GREENWOOD, A. D., and S. PA¨A¨BO. 1999. Nuclear insertion sequences of mitochondrial DNA predominate in hair but not in blood of elephants. Mol. Ecol. 8:133–137. HANDT, O., M. KRINGS, R. H. WARD, and S. PA¨A¨BO. 1996. The retrieval of ancient human DNA sequences. Am. J. Hum. Genet. 59:368–376. HA¨NNI, C., V. LAUDET, D. STEHELIN, and P. TABERLET. 1994. Tracking the origins of the cave bear (Ursus spelaeus) by mitochondrial DNA sequencing. Proc. Natl. Acad. Sci. USA 91:12336–12340. HEWITT, G. 2000. The genetic legacy of the Quaternary ice ages. Nature 405:907–913. HO¨SS, M., P. JARUGA, T. H. ZASTAWNY, M. DIZDAROGLU, and S. PA¨A¨BO. 1996. DNA damage and DNA sequence retrieval from ancient tissues. Nucleic Acids Res. 24:1304–1307. HO¨SS, M., and S. PA¨A¨BO. 1993. DNA extraction from Pleistocene bones by a silica-based purification method. Nucleic Acids Res. 21:3913–3914. HOFREITER, M., V. JAENICKE, D. SERRE, A. VON HAESELER, and S. PA¨A¨BO. 2001a. DNA sequences from multiple amplifications reveal artifacts induced by cytosine deamination in ancient DNA. Nucleic Acids Res. 29:4793–4799. HOFREITER, M., D. SERRE, H. N. POINAR, M. KUCH, and S. PA¨A¨BO. 2001b. Ancient DNA. Nat. Rev. Genet. 2:353–359. KILGER, C., M. KRINGS, H. POINAR, and S. PA¨A¨BO. 1997. ‘‘Colony Sequencing’’: direct sequencing of plasmid DNA from bacterial colonies. BioTechniques 22:412–418. KISHINO, H., and M. HASEGAWA. 1989. Evaluation of the maximum likelihood estimate of the evolutionary tree topologies from DNA sequence data, and the branching order in hominoidea. J. Mol. Evol. 29:170–179. KOHN, M., F. KNAUER, A. STOFFELLA, W. SCHRO¨DER, and S. PA¨A¨BO. 1995. Conservation genetics of the European brown bear—a study using excremental PCR of nuclear and mitochondrial sequences. Mol. Ecol. 4:95–103. KRINGS, M., H. GEISERT, R. W. SCHMITZ, H. KRAINITZKI, and S. PA¨A¨BO. 1999. DNA sequence of the mitochondrial hypervariable region II from the Neandertal type specimen. Proc. Natl. Acad. Sci. USA 96:5581–5585. KRINGS, M., A. STONE, R. W. SCHMITZ, H. KRAINITZKI, M. STONEKING, and S. PA¨A¨BO. 1997. Neanderthal DNA sequences and the origin of modern humans. Cell 90:19–30. KUMAR, S., K. TAMURA, I. B. JAKOBSON, and M. NEI. 2001. MEGA2: Molecular Evolutionary Genetic Analysis software. Bioinformatics 17:1244–1245. KURTEN, B. 1957. The bears and hyenas of the interglacials. Quaternaria 4:69–81. ———. 1976. The cave bear story. Columbia University Press, New York. LEONARD, J. A., R. K. WAYNE, and A. COOPER. 2000. Population genetics of Ice Age brown bears. Proc. Natl. Acad. Sci. USA 97:1651–1654.
LOREILLE, O., L. ORLANDO, M. PATOU-MATHIS, M. PHILIPPE, P. TABERLET, and C. HA¨NNI. 2001. Ancient DNA analysis reveals divergence of the cave bear, Ursus spelaeus, and brown bear, Ursus arctos, lineages. Curr. Biol. 11:200–203. MAZZA, P., and M. RUSTIONI. 1994. On the phylogeny of Eurasian bears. Paleontogr. Abt. A 230:1–38. MUSIL, R. 1980. Ursus spelaeus—Der Ho¨hlenba¨r. Museum fu¨r Ur- und Fru¨hgeschichte, Thu¨ringens, Weimar, Germany. POINAR, H. N., M. HOFREITER, W. G. SPAULDING, P. S. MARTIN, B. A. STANKIEWICZ, H. BLAND, R. P. EVERSHED, G. POSSNERT, and S. PA¨A¨BO. 1998. Molecular coproscopy: dung and diet of the extinct ground sloth Nothotheriops shastensis. Science 281:402–406. RABEDER, G. 1983. Neues vom Ho¨hlenba¨ren: Zur Morphogenetik der Backenza¨hne. Die Ho¨hle 34:67–85. ———. 1999. Die Evolution des Ho¨hlenba¨rgebisses. Mitt. Komm. Quarta¨rforsch. 11:1–102. RABEDER, G., and D. NAGEL. 2000. Alpine cave bears; phylogeny and a new taxonomy of. Sixth International Cave Bear Symposium, Corona, Spain. RABEDER, G., D. NAGEL, and M. PACHER. 2000. Der Ho¨hlenba¨r. Jan Thorbecke Verlag, Stuttgart, Germany. REISINGER, C., and J. HOHENEGGER. 1998. Sexual dimorphism in limb bones of Late Pleistocene cave bear (Ursus spelaeus, Carnivora, Mammalia) from three caves in Eastern Alps (Austria and Italy). Boll. Soc. Paleontol. Ital. 37:99– 116. ROZAS, J., and R. ROZAS. 1999. DnaSP version 3: an integrated program for molecular population genetics and molecular evolution analysis. Bioinformatics 15:174–175. SHIELDS, G. F., D. ADAMS, G. GARNER, M. LABELLE, J. PIETSCH, M. RAMSAY, C. SCHWARTZ, K. TITUS, and S. WILLIAMSON. 2000. Phylogeography of mitochondrial DNA variation in brown bears and polar bears. Mol. Phylogenet. Evol. 15:319–326. STRIMMER, K., and A. VON HAESELER. 1996. Quartet puzzling: a quartet maximum-likelihood method for reconstructing tree topologies. Mol. Biol. Evol. 13:964–969. TAJIMA, F. 1989. Statistical method for testing the neutral mutation hypothesis by DNA polymorphism. Genetics 123: 585–595. TALBOT, S. L., and G. F. SHIELDS. 1996. Phylogeography of brown bears (Ursus arctos) of Alaska and paraphyly within the Ursidae. Mol. Phylogenet. Evol. 5:477–494. TAMURA, K., and M. NEI. 1993. Estimation of the number of nucleotide substitutions in the control region of mitochondrial DNA in humans and chimpanzees. Mol. Biol. Evol. 10:512–526. TAVARE, S., D. J. BALDING, R. C. GRIFFITHS, and P. DONNELLY. 1997. Inferring coalescence times from DNA sequence data. Genetics 145:505–518. WAITS, L. P., S. L. TALBOT, R. H. WARD, and G. F. SHIELDS. 1998. Mitochondrial DNA phylogeography of the North American brown bear and implications for conservation. Conserv. Biol. 12:408–417. ZISCHLER, H., H. GEISERT, A. VON HAESELER, and S. PA¨A¨BO. 1995a. A nuclear ’fossil’ of the mitochondrial D-loop and the origin of modern humans. Nature 378:489–492. ZISCHLER, H., M. HO¨SS, O. HANDT, A. VON HAESELER, A. C. VAN DER KUYL, and J. GOUDSMIT. 1995b. Detecting dinosaur DNA. Science 268:1192–1193.
WOLFGANG STEPHAN, reviewing editor Accepted February 28, 2002