An Interactive System for Procedural City Generation
George Kelly M.Sc. in Computing Institute of Technology Blanchardstown 2008 Supervisor: Hugh McCabe
Declaration I hereby certify that this material, which I now submit for assessment on the programme of study leading to the award of Masters in Computer Science in the Institute of Technology Blanchardstown, is entirely my own work except where otherwise stated, and has not been submitted for assessment for an academic purpose at this or any other academic institution other than in partial fulfilment of the requirements of that stated above.
Signed: _______________________________
ii
Dated: ___/___/_____
Abstract The rapidly growing computer game industry requires a highly skilled workforce and this combined with the complexity of modern games, means that production costs are extremely high. One of the most time-consuming aspects is the creation of game geometry, the virtual world which the players inhabit. We have developed techniques to automatically generate such geometry, thus removing the need for developers to construct it manually. In this thesis a city generation system is presented that employs procedural techniques to rapidly create the urban geometry typical of a modern city. The approach taken is unique in that users are provided with an interactive interface to control the generation process. The system enables the generation of the underlying road networks which form the structure of cities and urban neighbourhoods. These road networks are automatically mapped to any terrain model, and adapt themselves to the specific geometry of the underlying terrain. The regions enclosed by roads are automatically extracted from the resulting road graph and building lots are determined using a subdivision process. The buildings are placed within the boundary of selected lots and basic geometric shapes are generated with advanced materials containing shaders to simulate additional geometry. Tactile control is provided by allowing the user to directly manipulate high level elements such as road intersection nodes and to control the many other aspects of city generation via intuitive property inspectors. As users alter the model the results are updated in real time, thus facilitating an interactive design process. The system can be used to pre-generate geometry in advance or to enable dynamic game environments where world geometry can be generated on demand.
iii
Contents 1 Introduction........................................................................................1 1.1 Background.......................................................................................................1 1.2 Procedural Generation.......................................................................................3 1.3 City Generation.................................................................................................4 1.4 Aims and Objectives.........................................................................................5 1.5 Achievements....................................................................................................6 1.6 Thesis Outline...................................................................................................6
2 Procedural Techniques Research.......................................................8 2.1 Key Properties...................................................................................................8 2.2 Fractals............................................................................................................10 2.3 L-Systems........................................................................................................11 2.4 Perlin Noise.....................................................................................................13 2.5 Tiling...............................................................................................................17
3 City Generation Research................................................................19 3.1 The Structure of a City ...................................................................................19 3.1.1 Primary Transit Network.......................................................................................20 3.1.2 Neighbourhoods / Districts....................................................................................21
3.2 The Evaluation of City Generation Systems....................................................23 3.2.1 Critical Framework................................................................................................23
3.3 Grid Layout & Geometric Primitives..............................................................24 3.3.1 Buildings: Geometric Primitives............................................................................24 3.3.2 Real-time Optimisations........................................................................................25 3.3.3 Discussion..............................................................................................................26
3.4 L-systems........................................................................................................27 3.4.1 Road Network: L-systems......................................................................................27 3.4.2 Buildings: L-systems.............................................................................................29 3.4.3 Discussion..............................................................................................................32
3.5 Agent Based Simulation..................................................................................33
iv
3.5.1 Road Network: Agent Based Simulation...............................................................33 3.5.2 Buildings: Agent Based Simulation.......................................................................35 3.5.3 Discussion..............................................................................................................36
3.6 Template Based Generation............................................................................37 3.6.1 Road Network: Template Based Generation.........................................................37 3.6.2 Discussion..............................................................................................................39
3.7 Split Grammars...............................................................................................40 3.7.1 Buildings: Split Grammars....................................................................................40 3.7.2 Discussion..............................................................................................................42
3.8 Conclusions.....................................................................................................43
4 Interactive City Generation Design.................................................44 4.1 Overview.........................................................................................................44 4.2 Primary Road Network....................................................................................46 4.2.1 Adaptive Roads......................................................................................................47 4.2.2 Sampling................................................................................................................48 4.2.3 Sample Selection Strategies...................................................................................49
4.3 Secondary Road Generation............................................................................50 4.3.1 City Cells...............................................................................................................51 4.3.2 Secondary Road Growth........................................................................................52 4.3.3 Snap Algorithm......................................................................................................55 4.3.4 Summary of Secondary Road Generation .............................................................61
4.4 Building Generation........................................................................................61 4.4.1 Blocks....................................................................................................................62 4.4.2 Lot Subdivision......................................................................................................63 4.4.3 Building Construction ...........................................................................................70
4.5 Summary.........................................................................................................74
5 Citygen Implementation .................................................................75 5.1 An Introduction to the Citygen UI...................................................................75 5.2 View Edit........................................................................................................78 5.3 Node Edit........................................................................................................79 5.3.1 Add Node - Chain Tool..........................................................................................80 5.3.2 Validity Checking..................................................................................................80
v
5.4 Road Edit.........................................................................................................82 5.4.1 Adaptive Road Control Properties.........................................................................83
5.5 Cell Edit..........................................................................................................84 5.5.1 Cell Generation Properties.....................................................................................84
5.6 Building Tiles..................................................................................................87 5.7 Integrated Game Engine: OGRE.....................................................................88 5.8 Graph Structures: BGL (Boost Graph Library)...............................................89 5.9 GUI Platform: wxWidgets...............................................................................90 5.10 Accessible Export: COLLADA.....................................................................91 5.11 Summary.......................................................................................................91
6 City Generation Results...................................................................92 6.1 Primary Road Network....................................................................................92 6.2 Adaptive Primary Roads.................................................................................95 6.3 Secondary Road Growth.................................................................................97 6.4 Building Generation........................................................................................99 6.5 Performance..................................................................................................102 6.6 Development Integration...............................................................................103 6.7 Analysis.........................................................................................................104 6.8 Final Output..................................................................................................106
7 Conclusions....................................................................................108 7.1 Summary.......................................................................................................108 7.2 Achievements................................................................................................109 7.3 Project Assessment........................................................................................111 7.4 Future Work..................................................................................................112 7.5 Conclusions...................................................................................................114
vi
Related Publications KELLY G.
AND
MCCABE H. 2007. Citygen: An Interactive System for Procedural City
Generation. In GDTW '07: Fifth International Conference on Game Design, Liverpool, ACM. Pages 8–16.
KELLY G. AND MCCABE H. 2007. Interactive City Generation Methods. Poster presentation at SIGGRAPH '07, San Diego, ACM.
KELLY G. AND MCCABE H. 2006. Interactive Generation of Cities for Real-time Applications. Poster presentation at SIGGRAPH '06, Boston, ACM.
vii
Chapter 1
Introduction
Chapter 1 Introduction The focus of our research is on the generation of city models via the application of procedural techniques. By using a sequence of computer instructions we aspire to automatically generate all of the geometry, materials and textures that constitute a 3D city model. The motivation of our research is to achieve the efficient construction of realistic, detailed and large scale urban environments and help solve the content creation problems facing the graphics industry. In addition we aim to enable new features like dynamic game environments, compact distribution models and accelerated rendering for large city scenes.
1.1 Background Advances in the field of computer graphics are consistent and we are now in an era where real-time photo-realistic rendering is common place and graphics processors exceed the complexity of CPUs in terms of transistor count by a ratio of up to 4:1 [Nvidia 2007][AMD 2007]. The evolution of computer graphics has dramatically increased the computing power available to developers and it has enabled the display of more realistic, detailed and large scale 3D worlds than ever before. However, displaying these worlds on screen is only part of the challenge. To provide this level of graphic detail in a final product, the detailed content— including the geometry, materials and textures that make up the 3D worlds—must be created by a fleet of artists. Content is traditionally defined as static assets and requires manual construction. The authoring of such detailed and large scale content is both time consuming and expensive. Even with the latest advancements in graphics hardware, the industry finds itself in a position where the new level of visual fidelity can only be achieved with massive financial resources to fund a new level of content creation.
1
Chapter 1
Introduction
The prohibitive cost of content creation results in the graphics industry, including games, films, advertising and television, struggling to meet the consumers' expectations, as set by the largest and most expensive titles. For those studios who can afford to, increasing the number of artists working on a project is a simple method that can be used to create more content. However, the effectiveness of this method is limited by the artistic pipeline not scaling, additional artist numbers do not necessarily generate a proportional yield of content. These inefficiencies add to the already high development costs of computer graphics. The result is an increased barrier of entry for new development firms, thus stifling innovation in the industry. One potential solution to the content creation problem is the application of procedural techniques [IDV Inc. 2006][Wright 2005]. Traditional approaches to content creation rely on the use of static assets to define the world. These static assets are largely inflexible, not easily modified and their reuse is limited. Procedural techniques define assets using a set of computer instructions. The geometry, textures or behaviours of the asset are then generated automatically using these instructions. Furthermore by parametrizing the generation functions a wide range of output can be created. This property enables procedural assets to be far more flexible than static assets, offering much greater re-usability and range of output. Additional benefits can be provided by the application of procedural techniques, with some particularly novel applications in gaming. By encoding the behaviour of the entities in a game world, it is possible to create several different instances of each entity, enabling the creation a unique environment with each play of the game. Using these dynamic game environments new game-play aspects can be introduced, the longevity of a title can be improved and entirely new gaming concepts can be applied [Wright 2005]. Procedural techniques can also provide practical benefits to the distribution of games. The concise nature of procedural assets stand in direct contrast to traditional static assets where several CDs, DVDs, and even Blu-ray discs are required to distribute a single application. Procedural techniques employ algorithms to generate content on-the-fly, which allows applications to make significant space savings. This is most evident in the Demo Scene where graphically detailed applications are distributed in a number of Kilobytes not Gigabytes [Scene Awards 2004] [Farbrausch 2007]. In practice a hybrid approach is used, where some static assets are necessary but procedural techniques are applied for selected assets to enable enhanced detail and more efficient distribution. 2
Chapter 1
Introduction
1.2 Procedural Generation Procedural generation can be defined as the application of computer instructions to automatically generate geometry and textures. The construction of complex geometric objects is a new phenomenon in computer graphics, even though procedural techniques have been used for over 20 years to one degree or another. Recently these techniques have been extended to successfully model complex natural objects such as trees, waterfalls and clouds [IDV Inc. 2006][Ebert et al. 2003]. Early procedural algorithms were primarily concerned with the construction of textures. This can be seen in Perlin Noise, which was devised to add a natural appearance to textures by creating a coherent form of noise by layering noise textures to add a more natural appearance [Perlin 1985]. This technique has also been applied to generate solid textures of natural materials such as marble [Perlin 1999]. Other techniques emulate natural cellular materials by using Voronoi Diagrams to create textures of skin, bark and cobblestone [Ebert et al. 2003]. The construction of complex geometry in games has only recently been carried out using procedural techniques. One area to which these techniques have been applied successfully is to the generation of trees and plants. In 1990 A. Lindenmayer and P. Prusinkiewicz released a book titled Algorithmic Beauty of Plants that introduced a system of graphically modelling plants using a rewriting system [Prusinkiewicz and Lindenmayer 1990]. This book illustrated how complex plants could be generated from a concise definition and documented a formal grammar to describe the structure of these plants. Although no immediate effects were noticeable in game development it did provide inspiration for further research. A commercial real-time tree generation system titled SpeedTree RT by IDV was first licensed in 2002 and provides a solution for generating trees in games and other computer graphics applications. SpeedTree RT has been used by numerous game studios including Rockstar, Microsoft, Epic and Sony [IDV Inc. 2006]. The system has also received several middle-ware awards and garnered noticeable attention for its application of procedural generation [Gamasutra 2002]. Entire worlds can be constructed from procedural techniques, where assets including realistic natural features such as terrain, lakes, trees and shrubs are procedurally generated [Pandromeda 2006]. The widespread application of procedural techniques has been largely confined to technical demonstrations and show-cases.
3
Chapter 1
Introduction
Figure 1: SpeedTree RT [IDV Inc. 2006] In the computer graphics industry, and in particular the games industry, procedural generation is seen as a complementary technology that can be used to supplement traditional artistauthored content. The application of procedural assets has been limited to the construction of natural phenomena such as trees, shrubs and terrain, but has equal relevancy for the construction of man-made phenomena. With games such as Spore continuing to expand the boundaries of procedural generation, these techniques and their range of applications will continue to grow beyond simple flora [Wright 2005].
1.3 City Generation Cityscapes are difficult to model. They are both visually and functionally complex and are a result of an elaborate evolutionary process that takes place over hundreds of years under the influence of countless factors. Some of the major influential factors affecting cities include population, transport, environment, elevation, vegetation, geology and cultural influences. It is a formidable challenge to create a realistic model of such a large and complex system. To design a procedural generation system that can construct realistic cityscapes, it is important to identify and carefully select a reduced set of factors to model. A number of urban design and architecture authors have discussed many aspects of cityscapes including the patterns present and the constituent components. Kevin Lynch writes about the image of the city and human perception. He itemises constituent elements of cities such as paths, 4
Chapter 1
Introduction
edges, landmarks, nodes and regions [Lynch 1960]. Alexander et al. documents a number of patterns found within cities such as neighbourhoods, public areas and special buildings [Alexander et. al. 1977]. Using this research suitable candidates are identified and only the most predominant patterns and features of cities are selected for modelling. Specifically our research focuses on the patterns of road networks, the divisions of neighbourhoods and building construction. The primary, or main roads act as traffic flow arteries, whose function it is to transport people and goods around the city from one district to another. In addition, the primary roads often convey essential characteristics of the city and form tangible boundaries that divide the city into regions or neighbourhoods. Within each of these neighbourhoods we find the secondary roads that service the local area by providing access to and from the primary road network. Buildings are only situated or placed within access of the primary or secondary road network.
1.4 Aims and Objectives Our general aim is to develop a city generation system that produces the required geometry, materials and textures to model a cityscape. In particular the system should be capable of: ●
producing a city model that is realistic, detailed, large scale and fits into the surrounding environment.
●
generating road networks that reproduce or emulate a number of distinct styles found in real city road networks.
●
constructing primitive buildings that are suitable for use in real-time rendering but detailed enough to maintain the realism of the city.
If successful, the system should do the above in such a way that: ●
interactive and tactile control of city generation is possible.
●
it is easy to use and accessible to novice users.
●
output can be easily used by those working in the graphics industry.
In addition to this, some practical objectives are to: ●
implement a portable multi-platform workspace for city generation.
●
implement the system such that it can be easily developed and extended. 5
Chapter 1
Introduction
1.5 Achievements In this thesis we document our research in the area of procedural city generation. The concepts and ideas proposed to solve the city generation problem are outlined, the generation system is described and the results are evaluated. Notable achievements of the work can be summarised as follows: ●
Study of procedural techniques: their background, principles and the key properties which distinguish successful algorithms. Analysis of related city generation research, including an outline of the algorithms, and an evaluation of the output generated.
●
Design of an adaptive road system that automatically plots the path each road takes by sampling terrain and fitting the road to the environment according to a pre-specified strategy.
●
Design of a real-time road growth algorithm and an efficient system to calculate intersection and proximity status for each road segment added.
●
Implementation of an interactive city generation system. A cross-platform graphical application provides an integrated workspace to view, edit and interactively control the complete city generation process.
●
Testing and evaluation of the city generation system where the operation, performance and output of the system is evaluated.
1.6 Thesis Outline In this introduction some background information has been provided, procedural techniques have been introduced, the motivation for research has been outlined and the goals and major achievements have been listed. On this basis an understanding of the research has been established and the rest of this thesis will cover in more detail the related literature, theory, design, implementation and results. In the next chapter, Chapter 2, we provide an overview of the subject of procedural techniques and present a number of key techniques and algorithms that have been applied successfully in the field of computer graphics. In Chapter 3 previous research into the procedural generation of cities is reviewed and an analysis of the existing solutions is provided. Chapter 4 outlines the design for our interactive city generation system called 6
Chapter 1
Introduction
Citygen, and explains the operation of the main components. Chapter 5 documents the implementation of Citygen including the tools, libraries and algorithms used. In Chapter 6 the results of the city generation system are presented and areas for possible future research are considered. Finally some conclusions are provided.
7
Chapter 2
Procedural Techniques Research
Chapter 2 Procedural Techniques Research In this chapter an overview is provided into the field of procedural techniques and their application in the computer graphics world. A description of general procedural techniques is included and several key properties of effective algorithms are identified. In order to gain an insight into the application of procedural techniques an outline into the operation and results of several of the most influential techniques is provided. This study includes techniques such as Fractals, Perlin Noise, L-Systems and Cellular Basis algorithms.
2.1 Key Properties A procedural technique describes an entity, geometry, texture or effect, in terms of a sequence of generation instructions rather than as a static block of data. These instructions can then be executed to create instances of the asset and parameters can be used to vary characteristics. Procedural techniques can thus be employed to produce a wide range of assets, from generating simple noise for use in texturing and natural formations [Perlin 1985], to more complex recursive algorithms such as fractals or L-systems that can recreate organic structures such as snow flakes and trees [Prusinkiewicz and Lindenmayer 1990]. Key properties of successful procedural techniques include [Ebert et al. 2003]: •
Abstraction: Data is not specified in the conventional sense as geometry, textures, etc. but instead the data and behaviour of the entity is abstracted into an algorithm or a set of procedures. Minimal knowledge is required by the operator and model data can be manipulated easily without requiring details of the implementation.
8
Chapter 2 •
Procedural Techniques Research
Parametric Control: Parameters directly correspond to a specific behaviour in the procedural generation. The developer can define as many useful controls as required for the artists to operate effectively. Example of parameters include the height of the mountains in a terrain algorithm or the number of segments in a procedural sphere.
•
Flexibility: It is possible to capture the essence of an entity without explicitly bounding it within real-world limits. Parameters can then be varied to produce different results as desired and even results outside the normal range of the original model can be generated.
Procedural techniques have been applied successfully in the generation of numerous complex phenomena in computer graphics and have proved beneficial for a number of reasons. Textures, geometry or effects abstracted into procedural algorithms are not fixed at a set resolution or number of polygons. Procedural techniques are therefore inherently multiresolution in nature and the complexity of their output can be varied. This capability is of particular interest to computer graphics practitioners. For example level of detail (LOD) is important in any 3D rendering system and essential to real-time rendering applications [Akenine-Möller and Haines 2002]. The concept behind LOD is to use more simple versions of an entity if it contributes less to the final rendered image. So for an object that occupies only 4 pixels in the final image, 10,000 polygons are not required and a basic representation using 10 polygons would be sufficient. The multi-resolution nature of procedural techniques allows models to be automatically generated at several levels of detail [Ebert et al. 2003]. Concise descriptions for generated objects are possible and can often be expressed in terms of a few simple parameters. These small descriptions can be used to create large amounts of detailed textures and geometry. This effect is known as data amplification [Ebert et al. 2003] and provides developers with the means to create an entire world that is easily distributable over low-bandwidth network connections. The conciseness of procedural techniques are exploited by Demo Scene creators who create and distribute scenes that are complex and rich in detail in the form of tiny executable files as small as 2KB [Scene Awards 2004]. The flexibility and control provided by procedural techniques give the designer a platform for artistic freedom and experimentation. New visual effects and original objects can be created by experimenting with parameter values that exceed normal boundaries [SideEffects 2005]. Typically procedural algorithms are implemented in advance on software, however with recent advances in graphics hardware it is possible to execute techniques in real-time on the 9
Chapter 2
Procedural Techniques Research
GPU. For example, complex procedural techniques like volumetric textures that were previously impossible to run in real-time can now be implemented in this manner [Hart 2002] [Spitzer et al. 2003]. A number of fundamental procedural techniques and algorithms are now described that have been successfully employed within the domain of computer graphics.
2.2 Fractals Natural shapes are not easily described by conventional geometric methods. Clouds are not spheres and mountains are not cones. Natural shapes tend to be irregular and fragmented and exhibit a complexity incomparable to regular geometry [Mandelbrot 1982]. However these shapes can be described using a branch of mathematics called fractal mathematics. Benoît Mandelbrot, regarded as the 'father of fractals', coined the term fractal in 1975 from the Latin fractus meaning broken. The basic concept of fractals is that they contain a large degree of self similarity. This means that they usually contain little copies of themselves buried deep within the original, like the stars embedded in the Koch Snowflake [Ebert et al. 2003], as shown in Figure 2. Also, fractals possess infinite detail, so for any given fractal, the closer we look at it, the more detail it can reveal [Linden and Schachinger 2002].
Figure 2: The first four iterations of the Koch snowflake The Koch snowflake in Figure 2 shows four recursions. Self-similarity is achieved by generating the same shapes or patterns at smaller and smaller scales as the recursion progresses, a property referred to as scale invariance. There is no theoretical limit to the amount of recursion that can be done and hence infinite levels of detail can exist within the shape. Visualizing fractals manually is difficult, and therefore computer based implementations of fractal algorithms have been present from the start. Mandelbrot used computers to visualise complex fractals including the Mandelbrot Set shown in Figure 3 [Mandelbrot 1982]. In addition, a wide range of natural structures from simple plants like 10
Chapter 2
Procedural Techniques Research
ferns as shown in Figure 4, to detailed terrain, contain fractal properties and can be generated using simple recursive algorithms [Barnsley 1988]. Fractal algorithms are particularly suited to procedural generation because of the effective abstraction they provide from the structural complexity of the natural objects they represent. Also, fractal algorithms yield a high level of data amplification. Complex models can be generated from a few simple equations. Finally fractal algorithms can utilize recursion to provide varying levels of detail.
Figure 3: Mandelbrot Set
Figure 4: IFS Fractal Ferns [Barnsley 1988]
Fractals are limited however to self similar structures and the objects we are seeking to model may not necessarily contain this self-similarity. They are superseded in many contexts by other more flexible algorithms like formal grammars such as L-systems.
2.3 L-Systems L-systems are a formal grammar devised by biologist A. Lindenmayer as a mathematical theory for biological development. L-systems were originally developed to study bacteria replication and the growth patterns of simple organisms [Lindenmayer 1968]. Since then the system has been extended to define more complex objects such as plants and branching structures. In the book, Algorithmic Beauty of Plants, the developmental process of plants is captured using the formalism of L-systems and visualised with computer graphics [Prusinkiewicz and Lindenmayer 1990]. The central concept of L-systems is that of rewriting, a technique for defining complex objects by successively replacing parts of a simple initial object using rewriting rules. An example of a simple L-system is shown in Figure 5. An initial state or axiom, ω, is a string of symbols and constants that define the initial state of the system. A series of rewriting rules or 11
Chapter 2
Procedural Techniques Research
productions, P, are then defined. Each of these consist of two strings: the predecessor and the successor, that specify the way variables can be replaced. These rules are applied successively, allowing large complex objects to be quickly generated from a simple axiom. V : {a, b}
n=0 : a
ω:a
n=1 : ab
P1 : a → ab
n=2 : aba
P2 : b → a
n=3 : abaab
Figure 5: Algae Growth: three iterations L-systems can be used to visualise structures by embedding graphical symbols in the vocabulary of the axiom or productions. Turtle commands are used to describe and visualize a range of L-systems including plants and branching structures. The idea behind turtle graphics is that the 'turtle' can be given instructions relative to its current position and as it moves it leaves a pen line mark behind it. The bracket extension was proposed by Lindenmayer to support the branching structures that are common in nature [Lindenmayer 1968]. Figure 6 displays an example of such a structure defined as an L-system using the bracket extension.
n=5, δ=22.5◦ ω=X P1 : X→F-[[X]+X]+F[+FX]-X P2 : F→FF Figure 6: L-system branch generated in turtle graphics[Prusinkiewicz and Lindenmayer 1990]
12
Chapter 2
Procedural Techniques Research
Figure 7: Procedurally generated tree used in a modern 3D game [IDV Inc. 2006]. Research into L-systems has continued, and significant advances have been made with commercial packages now available that can apply similar techniques to generate rich landscapes with detailed foliage including shrubs, plants and trees. Figure 7 shows a demonstration of the SpeedTree plug-in from IDV Inc. which enables graphics developers to easily populate scenes with a realistic and diverse range of plants and trees [IDV Inc. 2006]. L-systems work well as a procedural technique for a number of reasons. They allow complex models and organic structures to be defined, modelled and visualised using a concise set of productions. A varying level of complexity can be supported by parameters such as the recursion level of the L-system [Lluch et al. 2003]. The algorithms can be defined in a compact and intuitive manner and can effectively abstract the recursive structure of many natural phenomena. L-system generation can be adjusted easily via external parameters and is extensible by design, in a similar way to other formal grammars.
2.4 Perlin Noise Perlin Noise is an algorithm that can be used to create more natural looking textures. The technique was originally developed by Ken Perlin and was first applied in the feature film Tron released in 1982 [Perlin 1985]. The technique has a range of applications in computer graphics including the creation of effects like fire and clouds and the generation of fractal geometry like terrain. 13
Chapter 2
Procedural Techniques Research
The concept behind Perlin Noise is to combine a number of noise layers together to produce a single texture of coherent noise with fractal like detail. A Coherent noise function can be defined as one in which the values change smoothly from one point to the other. Two major components are used to accomplish this: a noise generation function and an interpolation function. Noise generation is achieved by employing a simple random function to construct an initial noise data set. It is important that the data output is controlled and reproducible. For this reason a seeded random generator is used which can produce consistent results for a given input seed and maintain a random output pattern. 1 0.9 0.8 0.7 0.6 0.5 0.4 0.3 0.2 0.1 0
Figure 8: Interpolation Linear and Cubic Interpolation is a process of curve fitting in which a function is constructed that can match a given data set. Using this function, new data points can be calculated from a initial set of values, in this case the data generated by the noise function. No specific interpolation algorithm is required for Perlin Noise and each algorithm can vary in computational complexity, smoothness of function curve, accuracy and number of data points required. Linear interpolation is a basic method, fast and of low quality. Cubic interpolation in contrast is more complex, significantly slower, outputs a high quality curve and requires four points to obtain a single value. The interpolation process allows any random noise data to be expressed as a continuous function. From these functions a number of noise texture layers can be created using any specified frequencies and amplitudes.
14
Chapter 2
Procedural Techniques Research
+ amplitude: a frequency: f/8
+ amplitude: a/2 frequency: f/4
+ amplitude: a/4 frequency: f/2
= amplitude: a/8 frequency: f
octaves: 4 persistence: 1/2
Figure 9: Combination of several layers of noise. Turbulence is finally applied by combining several noise texture layers of differing scales together. This creates a form of coherent noise. Each layer is referred to as an Octave and the ratio between amplitude and frequency of the layers can be expressed as a constant known as persistence. The resulting output is a natural looking procedural texture that can be defined in terms of a few simple parameters.
Figure 10: Photo realistic scenery and rendered using Terragen with procedural geometry generation and procedural texturing. ©2003 M. GIULI. In nature, there are several scales of detail present. For example, in terrain, large features like mountains are most predominant, but also smaller features like hills and crests, and even fine detail such as scree are also present. These layers of detail make procedural techniques like Perlin Noise especially suited to generating natural phenomena. Terragen uses the Perlin algorithm to generate photo realistic terrain, clouds and seas [Planetside 2004]. Figure 10 showcases the detail and scale of output that is possible using procedural techniques. The persistence parameter can be used to control aspects of terrain generation. A low ratio of persistence can produce smooth terrain with very fine detail, and high persistence may result in more jagged terrain with less fine detail. For real-time rendering applications, the Perlin Noise algorithm can generate any specific region of the terrain on demand and vary the level of detail present without needing to store the massive data-set of the terrain geometry. 15
Chapter 2
Procedural Techniques Research
Solid textures, also known as three dimensional or volumetric textures, can be generated using Perlin Noise. Solid textures differ from conventional two dimensional textures in that they allow objects to be virtually carved from the texture as they would be carved out of a solid block of material [Perlin 1999]. An example is shown in Figure 11 of a vase that is carved out of a volumetric marble texture created using the Perlin noise algorithm. The texture replicates the veins of darker material running through the marble and achieves a higher level of realism than is possible using basic 2D texturing techniques. Solid textures are computationally expensive to render with high memory and storage requirements. Compression such as S3TC can partly alleviate this problem but still results in high requirements. Perlin Noise can be used to solve this problem as it requires minimal storage due to its procedural nature, and can even be used to render volumetric textures in real-time using the pixelshader hardware on the GPU, effectively
Figure 11: Marble vase textured with a solid texture [Perlin 1999].
removing any memory constraints [Hart 2002]. Perlin Noise provides a comprehensive set of benefits. Effective parametrization gives the developer control of the output using high level parameters. Geometry and textures created using the algorithm have minimal storage requirements and can be generated from a concise definition consisting of a few simple parameters. Textures of any size and detail can be produced and the innate behaviour of the algorithm can exploited to support varying levels of detail. The output generated is tile-able and can join seamlessly, thus enabling techniques like repeating and layering for multi-texturing. Additionally, the technique can be used as a method of enabling real-time volumetric textures on modern graphics hardware. Perlin Noise is one of the most useful and frequently used procedural techniques and is beneficial in a wide range of computer graphics applications.
16
Chapter 2
Procedural Techniques Research
2.5 Tiling Tiling is one of the most basic procedural techniques and has a long tradition in game development. Many of the classic platform titles such as Mario employed tiling to repeat sections of 2D graphics creating a virtual world. Games such as the Shoot Em Up Construction Kit, released in 1987 by Sensible Software, allowed the user to construct and edit game maps by providing a simple interface to select and position tiles from a tile library [Sensible 1987]. Figure 12, shown below, demonstrates an example tileset and a corresponding screenshot for the Super Mario Bros game by Nintendo.
Figure 12: Super Mario Bros. 2 (Lost Levels), © Nintendo Japan Ltd. More recently multi-texturing techniques have evolved and use repeatable tiles layered together to create highly detailed and varied textures. New materials can be created by combining a set of detailed textures, colour maps and blending maps. Using this technique terrain can be procedurally textured by applying several layers of detailed tile-able textures. Examples of texture layers could include rock, grass, sand and snow. Also texture layers can be combined with varying degrees of influence on the final texture. Textures are applied to the terrain according to a variety of specified parameters, they can be selected according to height, slope, or specified explicitly using an image map [Planetside 2004]. This solution allows vast areas to be textured in detail, something that is not possible using a single high resolution texture.
17
Chapter 2
Procedural Techniques Research
Figure 13: From left to right: a) Regular and transition patterns and the probability map. b) Virtual texture. c) Virtual texture mapped on terrain. [Lefebvre and Neyret 2003] Extended algorithms have also been developed that use stochastic information such as probability distribution maps to procedurally texture landscape [Lefebvre and Neyret 2003]. An image map for the terrain area is supplied that stores the probability of using various tiles. Constraints can be specified to state which tiles can be joined under what conditions and whether they may be joined directly or require transitional tiles. Using a random function thousands of different permutations of worlds are possible from a single probability map. Procedural tiling systems provide several advantages for graphics applications. Vast and detailed landscape or terrain for virtual worlds can be created from stochastic information and small sets of texture tiles. These maps and game worlds can then be easily distributed for online gaming which is particularly useful for massively multi-player on-line role-playing games (MMORG) and other on-line applications where game resources are shared. Storage and memory requirements are minimised so it is possible to optimally store and render worlds of vast dimensions in real-time on commodity hardware. Tiling is a good example of how a simple procedural technique can be applied and extended successfully in computer graphics.
18
Chapter 3
City Generation Research
Chapter 3 City Generation Research In the previous chapter we introduced procedural techniques and discussed the benefits they can bring to computer graphics. In this chapter we shall look at the structure of a modern city, and discuss the work of urban design and architecture authors who identify some key patterns and constituent components. Before reviewing the existing city generation research, a critical framework is established. Then an overview of each city generation system is presented, and an insight is provided into the operation of each systems' algorithms. A discussion accompanies each overview, using the critical framework to evaluate the strengths and weaknesses of each approach.
3.1 The Structure of a City Cities are both visually and functionally complex. To obtain a better understanding of these complex systems and their structures, we look at the research which identifies the patterns and the constituent elements. Urban design and architecture authors have discussed a large number of wide-ranging topics relating to cityscapes. From the research studied we have selected work that relates closely to city structure and presents the most direct correlation to city generation. Two publications in particular fulfil these criteria: Kevin Lynch writes about the image of the city and human perception, he itemises the constituent elements of cities as paths, edges, districts, nodes, and landmarks [Lynch 1960]. Alexander et al. document the patterns found within cities such as neighbourhoods, public areas and special buildings [Alexander et. al. 1977]. The following sections discusses this research in two sections: Primary Transit Network and Neighbourhoods / Districts.
19
Chapter 3
City Generation Research
3.1.1 Primary Transit Network The primary transit network consists of the main roads or highways of a city, the major rail lines and waterways. This network is an important element in determining the sub-structure of a city and is instrumental in our interpretation of From a visual perspective the primary transit network is perceived by both occupants and outside observers as the most predominant and recognisable pattern present in city structure. This theory can be reinforced by the research of Kevin Lynch. In The Image of the City he documents a number of reasons for the importance of the primary transit network and its significance on our perception of the city. Firstly the concept of Paths is introduced: “Paths are the channels along which the observer customarily, occasionally, or potentially moves” [Lynch 1960]. In cities most transport is accomplished via road and the primary road network forms the main arteries and transport channels of the city. These Paths specify the location and route from which the city is observed and thus form a lasting impression on our image of the city. Lynch does not understate the importance of Paths on our perception of cities, he states that they are the “predominant elements” in our image of the city [1960]. Secondly the more abstract concept of Nodes is described. Nodes are termed as “points, the strategic spots in a city into which the observer can enter, and which are the intensive foci to and from which he is travelling” [1960]. Although they are not specific to the transit network the relationship between Nodes and the network is explained: “They may be primarily junctions, places of a break in transportation, a crossing or convergence of paths”[1960]. So in relation to the primary transit network we can easily draw a parallel between the junctions as Nodes and roads or tracks as Paths. Both have a significant impact on our perception and thus play an important role in determining the recognisable character of a cityscape. Functionally, the primary transit network is most significant to us as users of the city. The locations and structure of this network must be understood to navigate and move around the city. For this reason when arriving at a new city one of the first things many of us will do is purchase a map. Inside a city map the primary road network is emphasised to appear most evident and the rail network map will often occupy a separate page. Later we will frequently reference these networks on the map to find our bearings. Our comprehension of the transit network is essential to our understanding of a city and it is a key factor in our recognition of city characteristics.
20
Chapter 3
City Generation Research
Milan – Concentric Rings
Paris – Radial Spokes
Figure 14: Predominant Pattern in Existing Cities (Map) Shown above in Figure 14 are two predominant patterns from two modern cities, Milan and Paris. The images illustrate how visible the patterns of the primary road network are and how they form an intrinsic part of city character. 3.1.2 Neighbourhoods / Districts Neighbourhoods, or districts, are areas of the city which have an identifiable character and a tangible boundary. Each city is composed of component districts, for example: the city centre, the financial district, residential areas, industrial areas, suburbs and so on. Urban research helps define these areas and explain the relationships with the city occupants. Lynch defines districts as “medium-to-large sections of the city, which the observer mentally enters 'inside of' and which are recognizable as having some common, identifying character”[Lynch 1960]. Alexander et al. discuss the importance of neighbourhoods and their relationship to the occupants of the city. In the pattern titled Identifiable Neighbourhood he describes these regions and the relationship with the occupants: “People need an identifiable spatial unit to belong to. They want to to be able to identify the part of the city where they live as distinct from all others”[Alexander et. al. 1977]. The boundaries of each neighbourhood are important to maintaining the integrity and character of the unit. Alexander et al. liken neighbourhoods to cells, and state the importance of boundaries. “The strength of the boundary is essential to a neighbourhood. If the boundary is too weak the neighbourhood will not be able to maintain its own identifiable character”
21
Chapter 3
City Generation Research
[1977]. The specific components of the cityscape that constitute the boundaries for these regions are described in the patterns Subculture and Neighbourhood Boundary [1977].
Figure 16: Neighbourhood / District Boundaries [Alexander et. al. 1977]
Figure 15: Cells [Alexander et. al. 1977]
These cityscape components include both natural boundaries – such as rivers and lakes and also man-made boundaries – such as major roads and rail roads [1977]. Lynch terms the boundaries between districts as Edges, which he describes as linear breaks not considered as paths [1960]. These Edges may consist of elements such as shores, rivers, railroad-cuts and major roads. Although rail tracks and roads are also paths, they may be considered as Edges when they act as a barrier to the access of a district. For example consider a major road running through a residential area, in this case the road can restrict the movement of pedestrians in the local area and now acts more as an Edge than as a Path. Alexander et. al. reference the “Appleyard-Lintell” study and define a metric stating that a road with more than 200 cars per hour deteriorates the quality of the neighbourhood and forms a barrier to fee pedestrian movement [1977]. Identifying components that constitute districts and their associated boundaries provide us with an insight into the structure of cities. It is clear from the urban research that the citywide primary transit network alongside natural features are key to determining the boundaries of more local structures such as districts or neighbourhoods. Based on this research we can conclude that the primary transit network is an important aspect of the cityscape and its affect on the sub-structure is wide ranging. Therefore, an obvious recommendation can be made, to create a successful city generation system an accessible method of control for this influential element should be provided.
22
Chapter 3
City Generation Research
3.2 The Evaluation of City Generation Systems City generation is achieved in a series of stages, with each applying one or more algorithms to generate a constituent component of a city. There is no predefined scope for any stage and each system has a unique approach making direct comparisons difficult. The generation process can however be divided into two main stages: Road Generation and Building Generation. For these stages an overview is presented for each city generation system and an insight is provided into the operation of the procedural techniques applied. 3.2.1 Critical Framework In order to evaluate the output created by the generation systems and the effectiveness of the the applied procedural techniques we identify a common set of criteria: 1. Realism – Does the output of the city generation system look like a real city? How much detail is present and how true is the generated model to a real city model? 2. Scale – Is the urban landscape generated up to the scale of a city? How many roads, neighbourhoods and buildings are generated? 3. Variation – Can the city generation system recreate the variation of road networks and buildings found in real cities or is the output homogeneous? 4. Input – What is the minimal input data required to generate basic output and what input data is required for the best output? 5. Efficiency – How long does it take to create the examples shown and on what hardware are they generated? How computational efficient is the algorithm? 6. Control – Can the user control the city generation process? To what degree can the user influence the generation results? Are the control methods applied intuitive or restricted? 7. Real-time – Are city geometry and textures generated in real-time? Are any rendering optimisations applied and can the city be rendered or explored in real-time? The results of each approach are evaluated, using the criteria outlined above, to determine the effectiveness of the city generation systems and their associated procedural techniques.
23
Chapter 3
City Generation Research
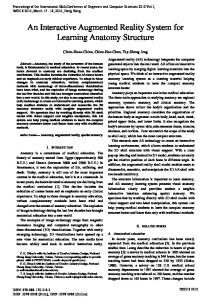
3.3 Grid Layout & Geometric Primitives Stefan Greuter et al. describe a system to procedurally generate a city in real-time [Greuter et al. 2003][Greuter et al. 2004]. The techniques applied to generate the city are discussed in a number of papers and demonstrated in a virtual city application titled Undiscovered City. The application creates a road network using a simple grid layout upon which it can place buildings generated using a combination of simple geometric primitives. The research is specifically targeted at real-time applications and the Undiscovered City application is a proof of concept for this idea. The system runs in real-time and renders at interactive frame rates. 3.3.1 Buildings: Geometric Primitives The building generation system uses the location of buildings in the form of grid coordinates as a seed for building generation. The appearance of each building is determined by this seed including properties such as height, width and number of floors. Generating buildings using a similar set of numbers such as neighbouring grid coordinates can result in similar looking buildings, so to overcome this a hashing function (shown in Figure 17) is implemented in order to provide more random distribution.
Figure 17: Grid Layout Coordinates & Hashing [Greuter et al. 2003] Building geometry is generated by combining geometric primitives to form building sections. Each building section is constructed using a different floor plan. The top most section of the buildings are created by extruding a three dimensional volume from the most basic of floor plans, composed from only a few primitive shapes. In subsequent sections below, another primitive shape is added to the previous floor plan and a three dimensional volume is extruded in the same fashion. Figure 18 illustrates how the creation of consecutive sections are combined to form the complete geometric model of a building. Figure 20 shows the generated buildings with their textured faces which are not procedurally generated but are selected from a set of 10 building window textures.
24
Chapter 3
City Generation Research
Figure 18: Floor Plan Generation [Greuter et al. 2003] 3.3.2 Real-time Optimisations The Undiscovered City is designed with real-time applications in mind and implements optimisations such as a geometry caching and view frustum culling. The culling technique, referred to as View Frustum Filling (shown in Figure 19), renders only the buildings visible within the view frustum. By loading and rendering a reduced set of buildings the amount of memory required to store the scene and the graphical processing power required to render the scene are minimised, enabling the real-time rendering of a large data set like a city. The grid road network allows easy detection of building visibility within the view frustum and hence provides a computationally efficient method to cull superfluous buildings from view.
Figure 19: View Frustum Filling [Greuter et al. 2003] In addition to culling building geometry, a building cache is also implemented. Buildings are generated in advance and defined as OpenGL display lists that can be stored in the building cache. The cache employs a least recently used algorithm: recently accessed buildings are 25
Chapter 3
City Generation Research
kept in the cache while older less recently accessed items are replaced. As a result of using the building cache, memory use is optimized and buildings can be recalled from cache for display an order of magnitude faster than they can be generated from scratch.
Figure 20: Screen shot at street level in the Undiscovered City demo 3.3.3 Discussion Realism: The single grid pattern does not reflect real cities where a number of patterns are present, as a result the road network appears artificial and homogeneous. All of the buildings appear angular and modern and are somewhat realistic but unconvincing. Simple windowed faces are used and the buildings are not geometrically detailed. Scale: The grid layout system can create road networks on a very large scale and is limited only by the size of the integer based coordinates. At 232 cells wide, the size is not a practical restriction for city generation. Variation: The grid system is required for real-time optimization in the system. However, the resulting road network has little variation with the only control parameter being the grid spacing. Only a single building type is constructed and although the geometry for each building is different the cityscape still appears homogeneous. Input: No input maps or geo-statistical data are required. Efficiency: Road network and building generation take place in real-time, and figures are provided for the generation and rendering of the Undiscovered City.
26
Chapter 3
City Generation Research
Control: Grid spacing can be adjusted using short-cut keys in the application and the changes can be viewed in real-time. The building generation process is not interactive and all buildings are generated using a random seed created from the grid hashing technique. Real-time: The system is designed for real-time applications and can render views of large scale cities in real-time on commodity hardware from 2003 at interactive frame rates. [Performance for numbers of buildings being displayed on screen: 200 buildings @60fps, 500 buildings @20fps, 1000 buildings @5fps].
3.4 L-systems Parish and Müller present one of the most complete city generation solutions, the CityEngine, in a paper titled Procedural Modeling of Cities [Parish and Müller 2001]. The CityEngine consists of a suite of components including road generation, building construction and building face creation that unite to form a pipeline for city generation. L-systems [Lindenmayer 1968] are selected as the key technique for procedural generation in the CityEngine. Lindenmayer-systems have traditionally been used to model natural phenomena but are also suitable for the generation of cities due to their concise nature, computational efficiency and data amplification properties. 3.4.1 Road Network: L-systems L-systems, as previously discussed, have been used to model the development of plants and branching structures. These contain some similarities in structure to road networks. The CityEngine uses an extended form of L-systems titled Self-sensitive L-systems to construct road networks in a manner which takes existing growth into account. Input is taken in the form of 2D image maps. Geographical information on elevation, vegetation and water boundaries is required, and additional socio statistical image maps can also be included specifying information such as population density, land usage, street patterns and maximum building heights. A road network generation application, shown in Figure 22, is used to manage the generation of roads, and allows the operating user to specify extra parameters such as the smoothing angle of road network edges, road width, etc. Although only a geographical input map is required, the examples included in the paper, such as Virtual Manhattan in Figure 26, utilize a number of different input maps.
27
Chapter 3
City Generation Research
Road generation is accomplished through the use of two rule sets: the Global Goals and the Local Constraints. Road segments are initially plotted according to the Global Goals which are similar to the goals that a city designer may have. These tentative plans are then refined by the Local Constraints which reflect the practical constraints of the real world and the state of the existing road network. Global Goals •
There are two different types of roads: highways or major roads connect population density centres which can be identified from a grey-scale population density map supplied at input, small roads connect to the nearest highway.
•
Streets follow some super imposed geometric pattern.
•
Streets follow the path of least elevation.
Local Constraints •
Road segments are pruned to fit inside a legal area: line segments extending into water are pruned.
•
Roads are rotated to fit inside a legal area: a road to the coast bends around the coastline like a coastal road.
•
Highways are allowed to cross an illegal area of a certain distance: a highway approaching a limited span of water will cross over it like a bridge.
•
Roads segments are checked to see if they intersect with existing roads or if they come within a certain distance of an existing road junction: Figure 21 shows how proposed road segments are modified to satisfy the self-sensitive rules.
Figure 21: Self-sensitive road L-system [Parish and Müller 2001]
28
Chapter 3
City Generation Research
Figure 22: CityEngine GUI displaying Virtual Manhattan after 100 steps [Müller 2006]. 3.4.2 Buildings: L-systems The CityEngine constructs buildings on the road network in a series of distinct stages: define building allotments, create building geometry and generate textured faces. To define building allotments the CityEngine utilizes data from the previous road network generation stage. Figure 23 outlines the stages of allotment generation. Allotments or lots are calculated by first extracting blocks from the road network using the roads of the network as the dividing borders. Each basic extracted block is then divided into a series of potential lots via randomized subdivision. Lots that are too small or have no immediate street access are culled and removed from the system. The final lots generated by the CityEngine are shown in the right-most image of Figure 23 and appear both varied and practical.
Figure 23: Lot Division Stages [Parish and Müller 2001] Building geometry is generated through the use of a parametric L-system. Several different building styles are implemented including skyscrapers, commercial and residential, with each type using a different set of L-system productions. The building type is determined from a zone map which can be passed in as an image map input. 29
Chapter 3
City Generation Research
Figure 24: L-System building refinement from bounding box to the Empire State Building [Müller 2006]. The initial state, or axiom, of the building L-system is a bounding box generated from the lot footprint and a building height image map, if available. L-system operations consist of transformations (scale and move), extrusions, branching and termination, and the use of geometric templates for roofs, antennae, etc. L-systems allow for the addition of more productions and provide an extensible solution. A basic level of detail implementation is possible since each iteration of the building L-system is a refinement of a basic building bounding box as shown above in Figure 24.
Figure 25: Building face construction [Parish and Müller 2001] Building faces are created procedurally by generating textures using an over-laid series of grid-like structures. Several layers of grid-like structures are used with functions that define how the layers are combined. The functions dictate which cells from what layer are selected to create the final face and can use conditional and statistical information to select cells. Cells typically contain doors or windows but can contain any building face feature. The construction of a face is shown in Figure 25. The red layer influences the selection of cells from the green layer. The resulting face is a conditional combination of multiple layers.
30
Chapter 3
City Generation Research
Figure 26: CityEngine - Virtual Manhattan – Maya render [Parish and Müller 2001] The CityEngine produces data that can be imported into Maya, a commercial 3D package, for final rendering. The sample shown in Figure 26 illustrates such a rendering from Maya, in this case a showcase of Virtual Manhattan.
Figure 27: CityEngine - Virtual Manhattan – DV/reality [Parish and Müller 2001] A real-time implementation is available utilizing DV/reality software from Dimension. DV/reality is a large scale visualisation tool designed to run on super computers and distributed rendering applications. There are no real-time rendering features such as level of detail or geometry culling discussed and from the screen-shot of DV/reality in action in Figure 27 it is clearly evident that a reduced complexity model is being displayed. (Notice how the buildings appear more similar to the left most image of Figure 24 in contrast to the right).
31
Chapter 3
City Generation Research
3.4.3 Discussion Realism: The CityEngine can create a complex and detailed road network but utilizes real statistical data making the generative capability of the system difficult to assess. The blocks from the road network are divided into realistic and practical lots upon which buildings can be constructed. L-system building generation provides an effective method of generating a realistic cityscape although the resulting buildings are basic. Several different types of buildings including skyscrapers, commercial and residential buildings can be created and green areas are also displayed. Overall a good visual balance is achieved with practical positioning. Scale: Scale does not appear to be an limiting factor for the system and is possibly restricted only by the size of the input data maps. Variation: A range of road networks can be created and examples of different cities are shown including Paris – Circular, New York – Grid and San Francisco – Terrain wrapping. A range of building function types are catered for, but only a limited range of styles are demonstrated. In Virtual Manhattan a convincing clone of New York is shown but it may be more difficult to generate other cities where different architectural styles are required. Input: The minimum input required is a geography map, however all of the samples shown utilize numerous input maps and include statistical data from real world cities. This dependence on real-world data requires the acquisition of geo-statistical data to use the system, which is not desirable. Also, from an evaluation point of view it is difficult to determine which patterns are created by the L-systems and which are created as a result of the input data. All of the samples shown utilize numerous image maps to create realistic output like that illustrated in Figure 26. Efficiency: Road network generation is relatively efficient. The large road network of the Manhattan sample shown in Figure 26 is created in under 10 seconds. The next stage of generation, the building stage, takes longer to complete. Virtual Manhattan requires approximately 10 minutes to sub-divide the road network into lots, construct buildings and create textured faces. It is important to note that although the generation time is documented, the time required for Maya to render Virtual Manhattan is not disclosed, and would likely take substantially longer than both of the previous stages combined.
32
Chapter 3
City Generation Research
Control: It is unclear how much user interaction is allowed and no interactive features are documented. It appears that the system is controlled by writing specific rules for each region and thus it would require advanced knowledge and expertise to use the system. Control is also limited with the use of image maps and is not suitable for editing by a novice user. Real-time: A real-time demonstration is available using the DV/Reality software shown in Figure 27 that displays a simplified version of Virtual Manhattan. DV/Reality[DVR] is a visualisation tool designed to provide real-time rendering through the use of high powered graphics workstations and distributed rendering. No documentation on any real-time features of the CityEngine is provided.
3.5 Agent Based Simulation Lechner et al. [Lechner et al. 2003] apply an agent based technique to generate cities in their solution titled CityBuilder. The system is built on the NetLogoTM platform which is a multiagent programmable modelling environment based on the Logo programming language and is designed to provide users with a platform to explore emergent phenomena. The city generation is implemented by simulating cities using a set of agents that can model specific city entities such as developers, planning authorities and road builders. The CityBuilder system models not only the road network and buildings, but also simulates the growth and development of the city over time. 3.5.1 Road Network: Agent Based Simulation Roads are created from road segments that are assembled according to a grid pattern. Deviation from the pattern is allowed and can be specified via a parameter. A deviation value of zero will result in a strictly uniform grid-like road network, a deviation value near one will result in an organic like network. The interconnectivity of the network can also be altered via constants that dictate the road density and the distance between road intersections. Input in the form of a terrain height map is required along with a specified water level to determine the legal area in which roads and buildings can be placed. Extra parameters such as road density, grid spacing, and deviation from grid can be adjusted using sliders in the interface shown in Figure 28 to alter the behaviour of the agents. Additionally users can specify certain parameter values for specific areas by painting on the map using a brush similar to that in a simple paint application. 33
Chapter 3
City Generation Research
Figure 28: NetLogoTM City Builder Interface [Lechner et al. 2003] The road segments are created by two types of agents – extenders and connectors: •
Extenders roam around terrain near to existing developments to search for land that is not serviced by the road network. Once that area of land has been discovered, it is assessed according to road density, proximity to existing junctions, and deviation from the start point. Roads follow parcel boundaries and try not to make large changes in elevation.
•
Connectors roam over the existing road network sampling the distance taken to travel to a point within a given radius using a breadth first search of the road network. If this distance is too long the connector will propose a road segment between the two points, the proposed segment is subject to the same checks as extenders.
34
Chapter 3
City Generation Research
a)
b)
c)
Figure 29: Example output of differing city structures: a) Gridded, b) Organic & c) Mixed Gridded and Organic [Lechner et al. 2003] Road networks can be viewed evolving in real-time, and the examples shown were created in 15 to 30 minutes. Figure 29 c) shows one of the main strengths of the agent based system by effectively blending between raster and suburban road styles. 3.5.2 Buildings: Agent Based Simulation The generation of land usage for buildings is completed via the interaction of a number of agents but is primarily due to the work of Developer agents. Developer agents perform the role of urban developers and have similar goals: buy land, request planning permission, build and sell. A rectangular grid of patches represent the world and each patch may be occupied by a building or road. Patches are grouped into parcels under the ownership of the building agent. The building agent determines the zoning information of each parcel and tracks attributes of the buildings.
Figure 30: Development Sequence. Yellow is residential, red is commercial, blue is industrial. Roads are grey. [Lechner et al. 2003] Three distinct developer types are defined: residential, commercial and industrial. All developers seek to increase the value of their land and each developer type evaluates the value of land differently and uses a different set of rules to complete its goals. For example:
35
Chapter 3
City Generation Research
residential developers seek land near the less busy areas of the road network in contrast to commercial developers who look for the busiest sections of the road network. Property is reviewed and a site is chosen. A proposal is then prepared that satisfies the clients needs and meets the city's restrictions. The proposal must then be reviewed by the city. A developers' proposal is only successful if it passes the city regulations and makes a net positive impact on the community by providing a service or increasing the value of the land. After this process is complete the developer agent starts again looking for more property. Figure 30 illustrates the evolution of a small city with snapshot images from left to right. The CityBuilder system creates a road network and defines land use that is then used to determine building types but does not generate actual building geometry and textures. The visualization of the city buildings is not a feature of the system but takes place externally in the proprietary SimCity game engine. 3.5.3 Discussion Realism: The road network appears realistic and has the ability to effectively transition between road patterns, particularly between central urban areas and less dense suburban areas. No buildings are generated, but the land usage map appears realistic resembling real statistical data similar to that showcased in the chil.us project [UrbanLab 2006]. Scale: The output created from the system (as shown in Figure 30) is limited in scale and is of a comparable scale to that of a village or small town rather than a city. Variation: A realistic range of road network patterns is displayed although they appear decidedly random. Different zones are supported with commercial zones using rigid block like road structures and residential areas using sprawling roads. Three different land usage and building types are defined: commercial, residential and industrial. Input: A terrain height map and a water level input are required to determine the legal areas in which buildings can be placed. Other input can be specified by the user through the interactive application. Efficiency: CityBuilder models not only the structure of a city but also its evolution and as a result of the added complexity the algorithm is computationally intensive and time consuming. A city of only limited scale similar to a village can be generated over a period of
36
Chapter 3
City Generation Research
approximately 15 minutes (no hardware specification stated), not including the generation of any building geometry or textures. Control: An innovative feature is available in the form of a paint tool that can be used to paint parameter values on the map. Numerical parameters such as road concentration, deviation and scale can be specified via an interactive application using the various sliders and widgets of the GUI. Real-time: There are no real-time considerations or even a 3D model of the city. The system could be easily expanded but with an algorithm of high computational complexity it is not suited for real-time procedural generation and at the moment is more suitable for simulation applications.
3.6 Template Based Generation Sun, Baciu et al propose an alternative approach to creating cities in their 2002 paper Template-Based Generation of Road Networks for City Modeling. They use a collection of simple templates and a population adaptive template [Sun et al. 2002]. The basic concept of the system is that a road network template is applied to a geographic map as a plan and then the roads are deformed subject to local constraints. 3.6.1 Road Network: Template Based Generation Several inputs are required in the form of 2D image maps. A colour image map which contains geographical information on land/water/vegetation is required. A grey-scale height map image to specify elevation is required. A population density map is required for the population-based template and is used to determine the varying road network density.
Population based
Radial Mode
Raster Mode
Mixed Mode
Figure 31: Road Patterns [Sun et al. 2002] The population-based template is implemented using a Voronoi diagram [Sun et al. 2002]. A road system is created that is representative of the population distribution. Road networks are 37
Chapter 3
City Generation Research
suitably dense in highly populated areas and sparse in less populated areas. This is made possible by extracting density points from the population density input map and using the points as input sites for the Voronoi diagram. The edges or cell boundaries from the resulting diagram are used to create the interconnected road network. The other templates use procedural patterns to create the road network. The Raster Mode, Radial Mode and Mixed Mode templates serve as simplistic growing patterns, with roads starting from a defined centre point and growing in an iterative process toward the edges of a bounded area. The Mixed Mode is simply a compound of one or more of the other basic templates. Templates define only the desired road pattern, and just as road planners must respond to practical constraints, so must the pattern. Roads deviate from the supplied pattern changing direction rapidly to avoid obstacles such as water and curve gradually to avoid large changes in elevation. Roads are created in short steps. Figure 32 shows a diagram of the process in action. At each step the system emits several fixed length radials and selects the radial with the least variation in elevation that is in a legal zone. In the case of a tie between two radials the path of least deviation from the original path is chosen. The angles at which the radials are drawn is restricted by a freedom factor, F, which limits the maximum angle of deviation for each radial. The final shape of the road is a result of terrain deviation and the selected pattern is followed only as strictly as the freedom factor dictates it to be followed.
Figure 32: Adaptive Roads [Sun et al. 2002]
38
Chapter 3
City Generation Research
Figure 33: Results clockwise: Population-Based Template, Radial Mode, Raster Mode and Mixed Mode. [Sun et al. 2002] 3.6.2 Discussion Realism: The applied template technique includes patterns found in real cities and the mixed mode pattern helps recreate the combination of patterns also present in city road networks. However, the results do not achieve the complexity and scale of real city road networks. Scale: The examples shown in Figure 33 demonstrate limited complexity and are insufficient in scale to be classed as city scale road networks. Variation: A choice of four templates is demonstrated and each can be deformed by the random terrain providing limited though varied output. Input: Few inputs are required but include several image maps such as a terrain height maps, a standard geographic map and a population density map for the population based template. Efficiency: No information is provided on the performance of the generation process. Control: A reliance on statistical data and no indication of any user interaction to control the road network generation would imply that this solution is rigid and inflexible. Real-time: No 3D implementation is shown and no performance figures are provided.
39
Chapter 3
City Generation Research
3.7 Split Grammars The Instant Architecture solution presented by Wonka et al. focuses only on the generation of realistic buildings through the use of a new type of formal grammar called split grammars. These grammars are based on the concept of shape [Wonka et al. 2003]. 3.7.1 Buildings: Split Grammars Split grammars are based upon the previous research and principles of shape grammars pioneered by Stiny [Stiny 1980]. A shape grammar is a formal grammar not unlike L-systems but it is based on the fundamental primitive of shapes rather than letters or symbols. Rules or productions map a shape, or a number of shapes to be be replaced by another shape, or number of shapes. An initial set of shapes is supplied to start with, and the rules are applied in an iterative manner. The basic building blocks of the system, and the objects that the grammar manipulates, are simple attributed, parametrized, labelled shapes called basic shapes. A large number of rules or productions are required to transform the shapes. For the examples shown in the paper a database of around 200 rules and 40 attributes was assembled. Figure 34 shows an initial state and simple set of sample rules. START
F
F
F
F
KS F
W
W
WIN
KS
WIN
Figure 34: An example of split grammar [Wonka et al. 2003]. An initial starting state is provided and then transformed by means of an iterative process using rules from the database. The rules split buildings into faces, faces into structural 40
Chapter 3
City Generation Research
sections and structural sections into components such as windows and so on. This is shown in Figure 34 with the end result shown of the completed derivation in Figure 35.
Figure 35: Completed derivation of the grammar in Figure 34 [Wonka et al. 2003]. Attributes assigned to shapes are propagated from the initial state down through the system. The attributes store information about the building like its symmetry, age, use and visual properties. These are later used to render the building but are also used to help match transformation rules and find relevant replacements. In addition, a control grammar is applied that can change the attributes of basic shapes in order to apply spacial design concepts, such as setting the first floor of a building to be a shop or applying a vertical detail to a column of shapes. The resulting building models produced by the instant architecture system contain detailed local features such as window sills but also distinctive building features such as vertical details on the edges of buildings.
Figure 36: Screen shot of Instant Architecture [Wonka et al. 2003].
41
Chapter 3
City Generation Research
3.7.2 Discussion Realism: The split grammar technique produces very realistic buildings even going as far as to effectively recreate different styles of architecture. Scale: The examples shown in Instant Architecture are limited in scale, but serve to demonstrate the strengths of the system by creating a small group of buildings in a town square or centre. A high level of variation is shown in the examples but the number of buildings is limited and is not of city scale. Variation: Building style varies greatly helping to produce very realistic output, however it is not clear how many different buildings types can be produced. Input: The system requires substantial initial input with samples like those shown in Figure 34 requiring a database containing approx. 200 rules and 40 attributes. The authors report that this took around two weeks to assemble. From this database a variety of buildings of different styles can be created and the data can be distributed with the system, without requiring the user to assemble their own dataset. Efficiency: The algorithm, although complex, is quite efficient. It can create buildings of up to 10,000 polygons in around 3 seconds on an Intel Pentium 4 at 2Ghz. Control: No interactive editor or GUI is described, but the split grammar rules can be edited in the database manually. This process is described as non trivial and requires a level of expertise and experience using the split grammars. It could well be a barrier to extending the system. There may also be constraints on the size of the system and the number of rules that it can manage with a reservation expressed that some derived designs may not even make sense if more rules are added. Real-time: The detailed buildings that the system produces can be explored in real-time however the number of buildings on display at any one time is limited. It is clearly a limit of the system with such a high polygon count. Level of detail support would be essential to use the system for real-time applications. In conclusion, the Instant Architecture solution produces realistic and detailed buildings but may require a level of expertise to operate that restricts it to an academic audience.
42
Chapter 3
City Generation Research
3.8 Conclusions In this Chapter we have reviewed previous research into the procedural generation of cities. It is important for us to recognise the areas that can be improved and to identify additional goals. In evaluating the existing research we used a common set of criteria: Realism, Scale, Variation, Inputs, Efficiency, Control and Real-time provisions. The systems adopt unique approaches to the city generation problem and have individual strengths and weaknesses. The highlights include: L-systems road generation, Subdivision lot creation and the interactive user interface of the agent based approach. After completing this analysis, it can be concluded that in general the previous research efforts can achieve a high level of variation, realism and scale but with the exception of the agent based approach do not provide an effective method of control. The goals for our city generation system to improve upon this existing work are: • Accessibility – input data such as geo-statistical data or complex architectural rules should not be required to use the system. • Interactivity – the system should be capable of fully autonomous generation but also facilitate interactive control. • Real-Time generation – for effective control over generation and to expand the the range of applications, the system should generate a city model in near real-time speed. The goal of our research is to create a city generation system suitable for real-time applications that is capable of creating realistic, varied and large scale cites in an efficient manner. Additionally it should be accessible to non-expert users and provide an effective method of interactive control.
43
Chapter 4
Interactive City Generation Design
Chapter 4 Interactive City Generation Design In the previous chapter we outlined and evaluated the previous research into city generation systems. In this chapter we present the design of our city generation system. We describe the algorithms and techniques involved in generating primary roads, secondary roads, blocks, lots and buildings.
4.1 Overview A key design goal of the system was that it would allow the user close control over the generation process by means of direct manipulation of the algorithm parameters via an accessible and intuitive visual interface. Furthermore it was regarded as crucial that the results of these manipulations would be computed and rendered in real time so that the user gets immediate feedback on their actions . This is what we mean when we state that Citygen is an interactive procedural city generation system. The motivation for this is so the user can engage with the system by moving nodes or changing parameters, see the effect immediately, tweak again, and so on. This iterative design process can be continued as long as necessary until the desired results are obtained. Similar to previous research, the generation of a city model is achieved via the execution of a number of steps [Parish and Müller 2001]. Each step may employ a different algorithm to: facilitate user interaction, generate a feature or obtain a relevant data structure. To explain the city generation process these steps are grouped into three main stages. Each stage corresponds to one of the constituent city structure components, previously identified by urban design authors [Lynch 1960][Alexander et. al. 1977] and discussed in Chapter 3.
44
Chapter 4
Interactive City Generation Design
Before describing the individual steps and algorithms applied in the city generation system, we list the main stages and provide a general outline of our design. 1. Primary Road Network: serves as the traffic flow arteries of the city, whose function it is to provide transport around the city and from one region to another. 2. Secondary/Neighbourhood Roads: are the roads inside the regions enclosed by primary road network. Neighbourhood roads work by providing access for the area to and from the primary road network. Each region may display a distinct style. 3. Building Construction: Buildings are situated and constructed on lots which are identified from the enclosed areas within the secondary or local road network. The essential character of a city and the boundaries of the neighbourhoods are dictated by the pattern of the primary road network (grid-like, radial etc..) and therefore this acts as the starting point of the generation process. The user can create, and manipulate, a graphical representation of a primary road network. Vertices of the primary road graph are called nodes and act as control points. They can be added, moved, deleted and so on. The roads which connect these nodes are procedurally generated by the system, mapped to the underlying terrain model, and rendered in real time. Once a region is enclosed the secondary road generation process is initiated automatically. The system contains a variety of road network patterns and the user can select which road network pattern to apply based on the results desired (for example, grid-like or meandering suburban roads) and assign different patterns to different parts of the city. Several pattern presets are defined for convenience and each can be easily modified to alter the efficiency, connectivity, scale and flow of the resulting road network. Once again, the results are computed and rendered in real time, allowing direct interactive manipulation of the process. The final stage of generation is the construction of buildings. In order to accomplish this it is necessary to compute building footprints onto which the buildings should be placed. This is done by calculating all of the enclosed areas between the secondary roads and then subdividing them into lots. The buildings are then placed within the lots and the shaders and materials are applied to the generated geometry. During the generation process the user can make changes to any stage and see the results of the changes propagate through in real-time.
45
Chapter 4
Interactive City Generation Design
Taking each of these generation stages in turn, we explain the operation of the system, paying particular attention to the problems that arise, and describing the solutions and algorithms employed to solve these problems.
4.2 Primary Road Network Road networks are represented as undirected planar graphs and are implemented as adjacency lists. An adjacency list contains an entry for each node and each of these entries comprises of a list of nodes that this node is directly connected to (see Figure 37). This data structure provides an efficient way to store, edit and perform operations on graph representations of road networks. 0
2
1
0
3
1
3
2
3
3
0
1
2
4
2
3
5
5
4
3
4
4
5
Figure 37 Adjacency List Data Structure These structures form the basis for all of our road network graphs, including both primary and secondary roads. We use two different graphs to store data solely for the primary road network, shown in Figure 38 and each neighbourhood region also uses an additional graph to store data for its' own secondary road network. The two primary road network graphs are simply termed, the high level graph, and the low level graph. The nodes of the high level graph correspond directly to primary road intersections and an edge between two nodes indicates that these nodes are connected together with a primary road. So, in other words it stores the topological structure of the primary road network. The low level graph defines the actual path each road takes across the terrain. It will also have nodes corresponding to primary nodes but also many more nodes between these indicating points on the terrain through which the road passes. By keeping the 46
Chapter 4
Interactive City Generation Design
high level topological road graph separate from the low level graph, we minimise the data set for processing and provide a means for the efficient extraction of connectivity information.
Figure 38 Primary road network graphs, Yellow: High level graph, Red: Low-level graph, Orange: Plot samples and interpolation spline. Nodes of the high level graph function as control nodes and can be interactively manipulated within the application in order to to adjust the topography of the primary road network. The nodes and edges of the low level graph are then computed by the system using the sampling, plotting and interpolation processes to construct the actual road routes through the terrain. We call these adaptive roads. After each manipulation the low level road graph contains the data required to render the roads. The manipulations of control nodes in the topological graph take place in a graphical interface with a real-time display of the final adaptive roads. 4.2.1 Adaptive Roads The concept behind adaptive roads is to fit road segments into the surrounding environment and ensure that the roads reflect the world in which they occupy. This is accomplished by plotting the road automatically using a sampling technique and various plotting strategies to adapt the roads to the terrain. In practice, to use adaptive roads, the user simply positions the source node and destination node of the road. These nodes correspond to the control nodes of the high level graph. The system then plots the path in real-time, providing immediate feedback and tactile control for the user to fine tune each segment. In addition constraints are employed to maintain the integrity of the road graph. Each proposed segment is automatically snapped to existing infrastructure whenever possible. Aside from aiding the user to rapidly 47
Chapter 4
Interactive City Generation Design
create a road graph, these constraints ensure that the user cannot create an invalid road segment or leave the road graph in an unusable state. By fitting each road to the environment a sense of cohesion is achieved in the resulting road network, along with increased realism and character. 4.2.2 Sampling Roads are plotted by starting from a source point and sampling a set of points at regular intervals to define a set of possible paths to the destination. The road graph is stored as an undirected graph and the plotting operation is designed to be commutative (i.e. plot(a→b) == plot(b→a) ). Therefore the algorithm was designed to operate bidirectionally by sampling simultaneously from both the source node and the destination node, and then finally terminating by meeting in the middle. Parameters are used to control the size of the samples, the number of samples taken and the maximum deviation allowed from the target direction. dSAMPLE : sample size nSAMPLE : number of samples θDEV :
angle of deviation
Each control point travels a distance dSAMPLE and deviates from the direction of the destination point less than an angle θDEV. A set of possible control points is obtained from a fan of nSAMPLE evenly spaced samples which are evenly distributed over an arc of degree 2θDEV . src
θ
DEV
d
d
PROGRESS
d
DST
dst
DST
Figure 39 Road interval sampling The road plotting process is complete when a sample is within a constant dSNAP of the destination point, this is guaranteed by ensuring θDEV < 45o and dSNAP > dSTEP*cos(θDEV). By
48
Chapter 4
Interactive City Generation Design
limiting the deviance angle of the road samples the resulting roads are free to meander when necessary but not without purpose as they are bounded to travel towards their goal. When the sampling is complete and the path has been plotted, the selected samples are inserted into a spline where fine grained segments can be interpolated and extracted for insertion into the low level road graph for final rendering. A Cubic Hermite spline is used with the Catmull-Rom approach applied to tangent generation [Paeth et al. 1995]. This spline technique was selected because it is easy to compute and produces an exact fit to the sample values. Approximated splines can result in the road terrain intersections. 4.2.3 Sample Selection Strategies Different selection strategies are employed to choose the samples acquired in the sampling process. Samples are primarily selected from the elevation difference between the sample and the previous plot point. In some strategies additional measurements are taken into account. A number of these different sample selection strategies are demonstrated in Figure 40 and described below.
Figure 40 Adaptive roads in Citygen. Blue - Minimum Elevation, Red - Least Elevation Difference, Green - Even Elevation Difference. 4.2.3.1 Minimum Elevation Strategy This is the most basic strategy in which the sample with the lowest elevation is selected resulting in a road path similar to the route a river or a stream would take. 49
Chapter 4
Interactive City Generation Design
4.2.3.2 Minimum Elevation Difference A more competent strategy than the first, this strategy avoids elevation drops or rises, and seeks to maintain an even elevation for the complete road segment. However a problem can occur when constructing roads between a source and destination node with a large elevation difference. In this case the Minimum Elevation Difference strategy will avoid the required ascent and descent until the last step when it has to join in the middle. On certain terrains this can result in a road with two smooth road sections and a steep section joining the two. 4.2.3.3 Even Elevation Difference To improve on the Minimum Elevation Difference strategy a technique with some more foresight was required. This is the impetus for the Even Elevation Difference strategy which aims to plot an even and smooth path for the road by looking ahead and re-evaluating the elevation goal as it progresses. This strategy operates by calculating the elevation difference between the current position and goal position. Based on the progress being made towards the goal, the algorithm seeks to ascend or descend an even portion of total elevation for each plot point. This strategy operates by selecting the sample with the minimum difference between distance covered and elevation ratio, and the goal distance and elevation ratio. MinAbs(elevationSTEP / dPROGRESS - elevationDEST / dDST) Each sample aims to cover an even portion of the total road elevation. The resulting roads are smooth curves that meander when necessary weaving through hilly terrain and searching for even paths to ascend or descend large elevation differences.
4.3 Secondary Road Generation Secondary roads service the local area within districts by providing access to and from the primary road network. In our system, districts are the regions of the terrain enclosed by primary roads. We call these city cells and they form the basic units upon which the secondary road generation process operates. The generation of the secondary road network within cells is accomplished using a growth based algorithm similar to the L-systems technique applied extensively to the generation of natural phenomena. There are important aspects to this process that will be described:
50
Chapter 4
Interactive City Generation Design
City Cell Extraction: How do we extract the cells from the primary road network graph? Secondary Road Growth: How do we generate a range of road patterns in the secondary road network within these cells? Snap Algorithm: How do we efficiently obtain information on the intersection status and proximity to the existing roads in the network? 4.3.1 City Cells City cells are formed from the enclosed regions of the primary road network. These regions can be determined by extracting the closed loops from the high level primary road graph. To extract the cells we execute a Minimum Cycle Basis (MCB) algorithm [Eberly 2005] on the primary road network graph and store the cell data in self contained units. Our design enables the efficient parallel execution of road generation within cells by ensuring that all cells are self contained and that the shared data is minimal. The Minimum Cycle Basis is defined as the unique set of minimum cycles in a graph that all other cycles can be constructed from. There are numerous algorithms available to compute the MCB but few take the position of vertices into account, instead operating solely on the structure of the graph. 3
14 10
17
13
1
11
y
9 16
4
18
x
7 2
8 6
12 15 19
5
Figure 41: MCB algorithm illustration The MCB algorithm used in Citygen is that described by David Eberly in [Eberly 2005]. Our implementation of the algorithm works by first sorting the nodes by the x location and then extracting cell cycles in a left to right order. Cycles are extracted by using the clockwise orientation of edges to prioritise exploration paths. As cycles are found they are marked and 51
Chapter 4
Interactive City Generation Design
removed from the graph so as not to influence further searches. Filaments are ordered sequences of vertices where the end vertices are either end points or branch points and those in the middle have exactly two adjacent vertices. In Figure 41 the cycle {1,3,10,9,4} is first extracted and the edges are marked cycle edges, then edge {1,3} is removed and filaments connected to vertices 1 and 3 are removed and not stored as they are not part of any further cycles. This brief outline is included to provide an insight into the operation of the algorithm, for a detailed explanation of the algorithms operation see [Eberly 2005]. After the cycles and filaments have been extracted, their containing cycles are determined and the data is grouped and then stored in a cell data structure. Each cell is self-contained and consists of a private road graph with the boundary cycle, filament roads and a small set of parameters to control road generation. As a result of this self contained design, it is possible for secondary road generation to be executed efficiently in parallel. Parallel generation of cells is currently implemented for multi-core systems running Citygen, but has a clear path to be extended further to use GPGPU programming. 4.3.2 Secondary Road Growth Once a city cell is created, the generation of secondary roads is initiated within it using a growth based algorithm. The choice of using a growth based algorithm was based on success of the prior L-system work of Prusinkiewicz on plants [Prusinkiewicz and Lindenmayer 1990] and Parish and Müller on city generation [Parish and Müller 2001]. Although our application does not use L-systems it shares the concept of parallel growth. Our generation algorithm is distinct in that it is computationally efficient and contains a number of optimisations to enable it to run in real-time. The generation is flexible, producing a wide range of output and functions by adding road segments in a parallel fashion similar to organic growth. Road construction begins from the bordering primary boundary roads and grows inwards in a parallel fashion. The starting point for the initial road segment is obtained using a deviated midpoint from a selection of the longest cell boundary sides. Once the initial segment's position and direction are calculated they are placed on a queue for processing. The road generation process is sensitive to existing infrastructure and new segments can connect to, and extend, existing roads. Information about the status of a proposed segment in relation to the road graph is obtained via an extensive snapping algorithm. This algorithm (described in 52
Chapter 4
Interactive City Generation Design
detail in section 4.3.2.1) provides information on intersections and on the proximity to neighbouring segments and nodes. Using this information, the road growth algorithm can make an informed decision to modify each proposed segment and join it to the existing network, or discard it if it does not meet the criteria set by the cell control parameters. Shown below in Figure 42 is a pseudo-code description of the algorithm. // calculate initial road segments for each boundaryRoad in longest(boundaryRoads) midPoint = calculate deviated road midpoint sourceNode = insertNode(boundaryRoad, midPoint) roadDirection = calculate deviated boundaryRoad perpendicular if placeSegment(sourceNode, roadDirection, ref newNode) nodeQueue.push(newNode, roadDirection) // process road growth while(nodeQueue is not empty) sourceNode = nodeQueue.front().node; roadDirection = nodeQueue.front().direction; nodeQueue.pop(); for ParamDegree iterations newDirection = rotate roadDirection by i*(360o / ParamDegree) deviate newDirection if placeSegment(sourceNode, newDirection, ref newNode) nodeQueue.push(newNode, newDirection) // function to place road segment, returns true on success placeSegment(sourceNode, roadDirection, ref newNode) roadLength = calculate deviated ParamSegmentLength targetPos = sourceNode.pos + (roadDirection * roadLength) switch(snapInformation(ParamSnapSize, sourceNode, targetPos)) case: no snap event targetNode = createNode(targetPos, roadLength) createRoad(sourceNode, targetNode) return true case: road snap event if random value is less than ParamConectivity snapNode = insertNode(snapRoad, snapPoint) newNode = createRoad(sourceNode, snapNode) return true case: node snap event if random value is less than ParamConectivity newNode = createRoad(sourceNode, snapNode) return true return false
Figure 42: Road Growth Pseudo-Code(Control Parameters shown underlined and orange)
53
Chapter 4
Interactive City Generation Design
Figure 43: Road Growth 10, 100, 300 & 1000 steps. Each cell specifies a control parameter set which is used by the growth algorithm to control the generation process. Example parameter sets are shown in section 5.5.1. Control parameters used for road generation include segment size, degree, snap size and connectivity: ●
Segment size controls the size of each proposed segment and hence granularity of the neighbourhood road network. Small segment sizes result in tightly packed streets whereas larger ones will give a more sparse road network.
●
Degree controls the number of times a road branches at any given node.
●
Snap size alters the distance threshold used to connect to existing infrastructure and hence influences the efficiency of the road network.
●
Connectivity changes the probability that segments will connect together thus affecting road network flow.
A deviance parameter partners each control parameter and enables relevant noise to be introduced by altering the parameters at each step of road generation. A seeded random generator is used to ensure that all generation is 100% reproducible.
54
Chapter 4
Interactive City Generation Design
Using this relatively simple growth algorithm along with a concise parameter set, we can generate a range of different road patterns which can be specified on a cell by cell basis. These patterns range from regular raster patterns typical in modern city centres, to irregular industrial patterns and even random meandering patterns of organic development.
Figure 44: Early road growth patterns: Raster, Industrial and Organic 4.3.3 Snap Algorithm The snap algorithm provides information on the proximity and intersection status of a proposed segment relative to the existing local road network graph. Proposed segments are then refined by the road growth algorithm using this data. The snap algorithm is called frequently by the growth algorithm and has a strong influence on road generation performance in the system. The snap algorithm receives the parameters: a – the root node, b – the target position and also a specified Snap Size.
specifying the width and radius of the snap area. A Snap
b
Sn a p S
grey) for the proposed segment ab, with the Snap Size
ize
Figure 47 illustrates the resulting snap area (shaded in
Event is created for any segment that causes an intersection or is within the defined snap area. Several events may occur on the proposed segment ab, but each of these events are prioritised by their distance to the root a, with the closest events being the most important.
55
a
Figure 45: Snap area shaded in grey.
Chapter 4
Interactive City Generation Design
In order to calculate snap information for the desired snap area illustrated in Figure 47 a number of proximity and intersection tests are required. These series of tests are computationally intensive, but a number of optimisations have been devised that improve the performance significantly. We will now describe these optimisations and outline the operation of the required tests. 4.3.3.1 Extended Bounding Box Exclusion The first step to optimising the speed of the snap algorithm is to minimise the number of segments that require testing. This is achieved by using a technique of minimal computational expense, in the form of a two dimensional axis-aligned bounding box test. The snap algorithm must not only report on the intersection status of each proposed segment, but also on the proximity to existing segments. For this reason an extended bounding box is used (see Figure 46). The extended bounding box is calculated by simply extending the standard bounding box for only the proposed segment by the distance specified in the Snap Size parameter. Using this method we can guarantee that segments which may not cause an
Snap Size
intersection, but may infringe on the snap area, are not excluded prematurely.
b
a
Figure 46: Extended Bounding Box Test: The extents and position for each segment bounding box can be obtained by calculating a segment half vector for the extents value, and then using this also to determine the midpoint for the position value. The execution of the extended bounding box test excludes up to 90% of road segments from further testing in a typical road network thus providing a considerable performance improvement with little expense.
56
Chapter 4
Interactive City Generation Design
4.3.3.2 Testing Procedure As previously discussed a number of different proximity and intersection tests are required to evaluate the snap area (shown in Figure 45). The snap algorithm testing procedure is composed of three ordered tests: 1. Proposed segment to existing node proximity test. 2. Proposed segment to existing segment intersection test. 3. Proposed node to existing segment proximity test. d
c b
b e
c
b
c
d
d e a
Test 1: Node Proximity
a
Test 2: Segment Intersection
a
Test 3: Segment Proximity
Figure 47: Snap Algorithm Tests: the active elements in each test are coloured in red. These three tests define the procedure, that segments not excluded by the extended bounding box test are subject to. Due to the frequency of which the Snap Algorithm is executed, further optimisation is still important to maintain a high level of performance. A basic optimisation is implemented by ordering the tests according to the priority of the snap events they can provide. As previously discussed in section 4.3.3, the priority of a snap event is dictated by its position relative to the root a of a proposed segment ab, with the events closer to the root assigned the highest priority. Since only a single snap event is returned, new snap event of lower priority can be ignored. Tests 1 & 2, the node proximity and segment intersection tests are executed first as they can provide snap events along the full length of segment ab. In comparison the third test, segment proximity, can only provide snap events at the target position b, which is assigned the lowest priority. So, if a snap event occurs in either of first two tests, then the entire series of third tests are not executed as a snap event closer to the root, a, cannot be provided.
57
Chapter 4
Interactive City Generation Design
4.3.3.3 Test 1: Node Proximity The node proximity test checks the distance between the existing nodes in the road graph and the proposed segment ab. To calculate the distance we use an algorithm which calculates the distance from a point to a line [Rourke 1998]. A pseudo-code description is listed below: // distance from point p to line ab distanceToLine(a, b, p) ab = b – a ap = p - a r = (ap).dotProduct(ab) / ab.squaredLength() s = (ap.perpendicular()).dotProduct(ab) / ab.squaredLength() return abs(s) * ab.length()
Figure 48: Distance from point to line pseudo-code In addition to calculating the distance between nodes and the proposed segment, this algorithm can also provide information on the location of each node. The values of r and s indicate the position of each node relative to the proposed segment ab. ●
r, indicates the position of a node relative along the length of ab. For example: if a node is located at a, the r value will be 0 and if it is located at b, the r value will be 1. Any node where 0 ≤ r ≤ 1 is located within the grey band illustrated in Figure 49.
●
s, indicates the position of a node relative to the perpendicular of ab. For example: if a node is located on the left of ab, the s value will be less than 0 and if it is located on the right of ab, the s value will be greater than 0. s 0
b
r≤1
r≤l
o we
s 0
s t_r
r≥0
b
r≤1
r≤l
L
ow e
s t_ r
L
r≥0
c a
c a
Figure 49: Node distance function scalars r & s
58
Chapter 4
Interactive City Generation Design
The values of r and s are used by the node proximity test to enable a number of optimisations: The s-value is proportional to the distance that a point is located from the line segment. Once the Snap Size is expressed in terms of s, the full distance does not need to be calculated and the computation for node proximity tests can be reduced. The r-value indicates the location of a node along the line ab
r = 1 + (Snap Size / ab.length)
and is important in treating how possible snap events are processed. Normal node proximity events require that the
r=1
b
condition 0 ≤ r ≤ 1 hold true. This ensures that the snap event occurs within the line segment ab and the node is located within the lines passing through a and b perpendicular to ab. If the r-value exceeds 1 an additional test may be triggered. If
r=0
a
1 > r ≤ 1 + (Snap Size / ab.length), then the node is located in the purple area, shown in Figure 50. In this case an additional point to point distance test is triggered which checks whether a
Figure 50: Test 1: Node Proximity: r-values
snap event occurs in a circular area around b. Executing this additional distance test only when a snap event is probable reduces the overall computation required. Finally, because snap events are prioritised closest to the root, and the r-value indicates the location of a node on segment ab, this value can also be used as a priority indicator. By using the r-value as a priority indicator we remove the need for any additional computation to determine snap event priority. If a snap event occurs, the r-value of the offending event is stored. Since only higher priority events are significant, this new r-value sets the benchmark for all future tests. A test is only executed if r is less than the lowest previous r and greater than zero. For example: if a snap event occurs on the segment body ab, the r-value obtained will lie between 0 and 1, so any snap events beyond 1 will now be irrelevant, and so the additional distance test will not be executed. If no snap events occur in the node proximity test the values of r and s for each node are still stored. These values can be used by future tests to implement optimisations.
59
Chapter 4
Interactive City Generation Design
4.3.3.4 Test 2: Segment Proximity The segment intersection test checks for intersections between existing segments in the road graph and the proposed segment ab. Efficient execution is achieved by executing the full segment intersection test only when an intersection has been determined probable. The probability of an intersection is calculated by using the data obtained in Test 1. As explained in the previous section, the node distance data defines the position of nodes relative to the proposed segment. Therefore, if the nodes of the segment being tested contain s-values of a different sign, then they must lie on different sides of the proposed segment and an intersection on the line ab occurs. Also, if both node r-values place the nodes' location within the proposed segment ab or on opposing extensions of ab, then an intersection is probable within the bounds of the line segment ab. The application of this optimisation results in a 98% reduction of all segments intersection tests in a typical city neighbourhood cell. Once an intersection has been determined as probable the following segment intersection test is executed. A pseudo-code description of the algorithm is listed below [Rourke 1998]. // check for intersection between line segment ab & cd lineIntersection(a, b, c, d, r, s) ab = b – a cd = d - c denom = (ab.x * cd.y) - (ab.y * cd.x); if(denom == 0) return false; // lines are ca = a - c r = ((ca.y * cd.x) - (ca.x * cd.y)) / denom; // s = ((ca.y * ab.x) - (ca.x * ab.y)) / denom; // if(r == 0 && s == 0) return false; // lines are return true;
parallel r = pos on cd s = pos on ab coincident
Figure 51: Distance from point to line pseudo-code In a similar style to the operation of test 1, the distance between a snap event and the root node is not calculated explicitly and a scalar r-value is again used as the priority indicator. The same benefits apply in this stage. No additional computation is required to determine snap event priority and the r-value provides another means of discarding unnecessary tests that cannot yield an event of significant priority and lower r-value.
60
Chapter 4
Interactive City Generation Design
4.3.3.5 Test 3: Segment Proximity The segment proximity test checks the distance between the existing segments in the road graph and the target position defined by b. To calculate the distance from a segment to a point the same algorithm as described in Test 1 and shown in Figure 39 is used [Rourke 1998]. This is the last test executed by the Snap Algorithm procedure and is only called if no snap event occurred in the previous tests. This test is scheduled last because of the fact that it can only detect snap events located at the end of the proposed ab which is assigned the lowest priority. No special optimisations are implemented in this test and the check simply calculates the distance between node b and every other line segment. 4.3.4 Summary of Secondary Road Generation We have discussed City Cells, Road Growth and the Snap Algorithm. City Cells are extracted from the primary road network and each cell maintains a local road network graph thus reducing the relevant data set for secondary road generation within the cell. Road Growth is achieved by using a simple growth algorithm with a minimal control parameter set. Even though the secondary road network is divided among the City Cells the network data set is still of a significant size. The Snap Algorithm employed by the growth algorithm is called frequently by the growth algorithm and its efficient operation is critical for road generation performance. The snap algorithm applies an extended bounding box test to filter the road segments for testing. Then, three tests are implemented with a number of optimisations to enable the snap algorithm to provide proximity and intersection information efficiently. Once the secondary road network is complete the next stage of generation is the identification of lots and the construction of building footprints and geometry.
4.4 Building Generation The building construction stage of Citygen is accomplished in three stages. Firstly the enclosed regions are extracted from the secondary road graph by applying the Minimum Cycle Basis algorithm as described previously in Section 4.2. Secondly the lots are identified by splitting the regions into minimal tracts or parcels of land suitable for development. Thirdly and finally the building footprints are inset from the lot boundaries and the building geometry is constructed and textured.
61
Chapter 4
Interactive City Generation Design
4.4.1 Blocks Blocks represent the enclosed regions of the secondary road network. The role of the block is to add any additional geometry such as footpaths, signposts, traffic lights or post boxes onto the region. Currently only the footpaths are added. These footpaths are constructed by first insetting the cell boundary by the value specified in the footpath width parameter. The original cell boundary and the inset boundary are then combined to create an internal boundary strip. This strip is then extruded upwards by the specified footpath height parameter. The boundary cycle is finally toured and the length of each edge is measured. An accumulated length value is stored in each vertex and transformed to form the UV texture coordinates. These texture coordinates ensure that the footpath textures are tiled correctly. 4.4.1.1 Straight Skeleton Inset The boundary consists of small segments interpolated from the primary road network and a diverse mix of patterns generated in the secondary road network. For this reason a basic inset operation can frequently fail. This failure results in undesirable artefacts in the inset boundary. Hence, an algorithm was used that can take the potential problems into account. The technique used is that of the Straight Skeleton, a concept first proposed by Aichholzer et al. in the paper titled “A Novel Type of Skeleton for Polygons” [Aichholzer 1995].
Figure 52: Straight Skeleton [Aichholzer 1995] A straight skeleton is defined as the union of pieces of the angular bisectors traced out by the polygon vertices during the shrinking process [Aichholzer 1995]. During the shrinking process two types of events can occur: ●
An Edge Event, occurs when an edge shrinks to zero and the neighbouring edges become adjacent. An example of this event is circled in green in Figure 52.
62
Chapter 4 ●
Interactive City Generation Design
A Split Event, occurs when an edge is split by a reflex vertex, thus dividing the whole polygon into two. An example of this event is circled in red in Figure 52.
Following the description of the concepts by Aichholzer et al., an implementation of the algorithm was later provided by Felkel and Obdrzalek when they published the “Straight Skeleton Implementation” in 1998 [Felkel and Obdrzalek 1998]. This is the implementation that our algorithm is based upon. The algorithm obtains the Straight Skeleton of any polygon in O(nm + n log(n)) time, where n is the total number of vertices, and m is the number of reflex vertices. This algorithm works by storing the polygon in a data structure called a Set of circular Lists of Active Vertices, or SLAV for short. This data structure is used to store the polygon vertices and the Straight Skeleton structure. Events are then processed in the order they are encountered. There are two major differences in our implementation of the inset algorithm and the algorithm described by Felkel et al. Firstly the inset algorithm does not generate a complete Straight Skeleton. Instead, the algorithm generates a partial skeleton by tracking the inset progress and detecting just enough events to inset the polygon by the required amount. Secondly the algorithm operates in O(n log(n)) time. This is achieved, not by improving the complete algorithm, but by customising the algorithm to our application and ignoring Split Events. During testing it was found that the Split Event rarely occurs and so can be removed without causing significant problems. This approach has the added benefits of simplicity and performance but has a dangerous side effect of creating potentially invalid regions. However, efficient error checking is employed in the later stages to help correct any errors that may occur during the inset process. The result is an inset algorithm that is balanced by creating few errors yet remaining computationally efficient. 4.4.2 Lot Subdivision The lot subdivision process operates on the region boundary defined in each city block. A subdivision algorithm is applied which is based on that described by Parish et al. [2001]. Also, a number of extra features and optimisations have been implemented to extend this technique. These features include: ●
a more even and accurate method of dividing lots
●
an optimisation to orientate lots perpendicular to their access roads
●
the ability to process both concave and convex regions 63
Chapter 4 ●
Interactive City Generation Design
the addition of individual lot width and lot depth parameters
The lot subdivision process operates by measuring the regions and dividing them recursively until all of the regions are of a size approaching the values specified in the cell control parameters. Two cell control parameters, lot depth and lot width, along with deviation values are used to control the subdivision process. The lot subdivision algorithm recursively splits each region into two or more sub-regions using a split line to define each split operation. These split lines are calculated by obtaining a perpendicular from a point near the middle of the longest side of each region. Deviation is used to introduce noise into the subdivision process. This application of noise results in a more natural lot distribution. The deviation amount can be specified in the cell control parameters and a range of variation between regular and randomised lot sizes is possible. Also, throughout the subdivision process road access information is maintained in the region data structures. This information is used to determine if regions have direct access to the road network. Those regions without direct access to the road network are not considered suitable for building development, and are discarded, or used for green space.
1
2
3
4
5
6
Figure 53: Illustration of the Lot Subdivision Algorithm Shown above in Figure 53 is an example of the lot subdivision algorithm dividing a regular convex polygon typical of an inner city block. The red points indicate the split points used to define the split line shown as dashed lines. The light grey regions shown in the last stage
64
Chapter 4
Interactive City Generation Design
represent the lots that do not have direct road access and are excluded. For more detail on the the lot subdivision algorithm, a pseudo-code description is shown below in Figure 54. subdivideLots(blockRegion) regionQueue.push(blockRegion) while(regionQueue is not empty) region = regionQueue.front() // calc the longest road edge and split size longestEdge = region.getLongestRoad() if(longestSide.length < lotWidth) // calc the longest non-road edge and split size longestEdge = region.getLongestNonRoad() if(longestSide.length < lotDepth) // if lot is small enough, add completed region outputRegions.add(region) regionQueue.pop() continue else splitSize = lotDepth else splitSize = lotWidth // calculate the split points sp1 = calcSplitPoint(longestEdge, splitSize, lotDeviance) sp2 = sp1 + longestEdge.perpendicular() // split and process the new regions newRegions = SplitRegion(region, sp1, sp2) regionQueue.pop(); foreach(Region r in newRegions) if(r.hasRoadAccess()) regionQueue.push(r) // add to processing queue else delete r // discard region return outputRegions
Figure 54: Lot Subdivision Algorithm pseudo-code 4.4.2.1 Even and Accurate Lot Subdivision Using a binary split operation limits the accuracy to the nearest power of two. By taking the target size into account we can offset the division point for more even and accurate divisions for odd sized lots. The function called to calculate the deviated mid point for the longest edge is of key importance to the generation of evenly and accurately sized lots. Although a lot deviance parameter can be specified in the cell control parameters, the ability of the original
65
Chapter 4
Interactive City Generation Design
lot subdivision algorithm to deliver evenly sized lots is restricted. When testing the initial version of the lot subdivision we quickly found that by using a deviated midpoint the accuracy of the lot subdivision was limited to the nearest power of two.
midpoint
fraction midpoint
Figure 55: Split Point Calculation In the example shown above the region is 60 units wide and 20 units deep. The desired lot width and lot depth is 20 units and the deviance is 0. The desired result is obvious, three lots should be obtained. However, if the midpoint is used as the first split point in the region, four lots, not three lots will be returned. To solve this problem we take the measurement of the longest side and determine the number of splits that may be required. Using this number we can then select the middle-most fraction for an accurate split. Although it is not evident in the example above, it is very important that the middle-most split fraction is used, otherwise thin slices are cut from large regions and lot distribution is compromised. This feature is necessary for cells which specify low lot deviance values and enables accurate and evenly sized lots to be obtained. For cells with high deviance values the application of noise is not negatively affected by the implementation of this feature. Shown below is a short snippet of pseudo-code that demonstrates how this feature can be implemented. calcSplitPoint(longestEdge, splitSize, lotDeviance) factor = Round(longestEdge.length / splitSize) fraction = 1/factor midPosition = Round(factor/2) * fraction // calculate longest edge vector src → dst longestEdgeVec = longestEdge.dstPos() - longestEdge.srcPos() return longestEdge.srcPos() + longestEdgeVec * (midPosition + (lotDeviance * (srandom() - 0.5) * fraction))
Figure 56: Lot Subdivision Algorithm pseudo-code
66
Chapter 4
Interactive City Generation Design
4.4.2.2 Perpendicular Lot Orientation Another modification was required to improve the orientation of lots obtained from irregular or complex regions. The original lot division algorithm worked fine for rectangular regions, however, when the algorithm was tested on suburban road networks the resulting lots were angular and irregular. To combat this and provide more realistic lots for suburban networks a modification was made to the lot division process in which division was prioritised along sides with road access. This modification can be seen in Figure 54 where the function getLongestRoad is invoked before the function getLongestNonRoad. As a result of this
simple modification almost all lots are now oriented perpendicular to their access roads. This more closely reflects the conditions found in the real world and improves the quality and realism of lots in suburban regions without affecting other regions negatively. 4.4.2.3 Concave and Convex Lot Subdivision The last and most important improvement to the lot subdivision algorithm is the removal of the restriction for regions to be convex. By requiring that all regions be convex the lot subdivision process is limited to operating on regular blocks, like those found in Manhattan. However, most regions are not convex. Suburban, industrial or any district with filament roads can not be processed using the basic subdivision algorithm. The solution was to develop a more complex split algorithm capable of splitting both concave and convex regions into two or more subregions. 0
1 9
4
Regions or lots are represented as graphs of directed
5
edges. These directed edge graphs are implemented in a
8
circular linked list. Using this data structure each of the 2 11
10
0
1
vertex neighbours are easily accessible and additional
3
data such as road access information and process 6
7 6
The intersections between the boundary edges and the
7
split line are calculated in two stages: The first stage
13 12 17
14 11
2
5 3
16
variables can be attached to each edge.
15
10
determines the position of each vertex relative to the
8
perpendicular of the split line using the same technique as
4
described in section 4.2.3.3. In the second stage, edges 9
with a vertex on each side of the line, are deemed to have 67
Chapter 4
Interactive City Generation Design an intersection present. The position of the intersections and their relative locations along the split line are then calculated and inserted into the regions circular list and also into a list for intersection vertices. The list of intersection vertices are then sorted by the their relative position on the split line. Each alternate
1
2
4
3
5
6
edge between the ordered intersection vertices is considered part of the region as per Jordans Curve Theorem (these edges are marked in green in the illustration shown on the left). For each of these pairs a bridge function is invoked to modify the structure of the region into several constituent regions. The bridge function creates two additional vertices and two new edges for each intersection pair. It is important
4
2 1
3
6 5
that the bridge function modifies the graph so that each of the original intersection edges is assigned to a different sub region. Finally the sub regions are extracted by cycling through the connected edges for each intersection edge. Since a sub-region may contain more than one intersection edge, edges are marked as visited to avoid any duplication. Figure 57: Region Split Algorithm
The original version of algorithm was developed using vectors and indices instead of the circular list. However, there were performance implications, even though the size of each vector was determined in advance and the memory was allocated in advance, the resulting copy time for each region was still noticeable. After further research a useful description of an algorithm was found in Graphic Gems V [Paeth et al. 1995]. This new revision of the algorithm, as shown in Figure 58, is based on the clipping algorithm described in chapter II.3 of Graphic Gems V. While the algorithm is not identical, important concepts including the bridge function and the circular list were instrumental in improving the performance of lot subdivision. On the next page a pseudo-code listing of the split region code is provided for those who may require more detail on the algorithms' operation. 68
Chapter 4
Interactive City Generation Design
splitRegion(region, a, b) ab = b - a Lsq = ab.squaredLength() foreach(edge in region) edge.s = (-ac.z * ab.x + ac.x * ab.z) / Lsq foreach(edge in region) if((edge.s > 0 && edge.next().s