Chemical Engineering Science 56 (2001) 2721}2732
Airlift-driven external-loop tubular photobioreactors for outdoor production of microalgae: assessment of design and performance F. G. AcieH n FernaH ndez*, J. M. FernaH ndez Sevilla, J. A. SaH nchez PeH rez, E. Molina Grima, Y. Chisti Department of Chemical Engineering, University of Almern& a, E-04071 Almern& a, Spain Received 5 November 1999; received in revised form 27 September 2000; accepted 7 November 2000
Abstract A methodology is presented for designing photobioreactors with tubular loop solar receivers in which the #uid is circulated by an airlift device. The design method e!ectively combines the relevant aspects of external irradiance-dependent cell growth, oxygen accumulation in the solar loop, oxygen removal in the airlift device, and hydrodynamics of the airlift system that determine the #ow velocity through the solar receiver. The design approach developed was used to model and build a 0.2 m� outdoor photobioreactor. A compact degasser in the airlift section eliminated dead zones and dark zones, while achieving complete separation of gas and liquid. The measured gas}liquid hydrodynamics, mass transfer, and culture productivity were consistent with the model predictions. The reactor was tested with continuous culture of the microalga Phaeodactylum tricornutum at various liquid velocities through the tubular solar receiver. A biomass productivity of 1.20 g l\� d\� (or 20 g m\� d\�) was obtained at a dilution rate of 0.050 h\�. Solar receiver linear liquid velocities of 0.50 and 0.35 m s\� gave similar biomass productivities, but the culture collapsed at lower velocities. An adverse e!ect of high dissolved oxygen concentration on productivity was observed. Oxygen accumulation could be reduced by increasing the liquid velocity and this enhanced the biomass yield. � 2001 Elsevier Science Ltd. All rights reserved.
1. Introduction Microalgae have been cultured by mankind for centuries, mainly as food; however, systematic mass culture methods for potential use in producing high-value algal chemicals were developed more recently (Burlew, 1953). Most of the developmental e!ort has focused on technologies for open outdoor mass culture. Large-scale production facilities based on open culture methods are in operation in the United States, Australia, and elsewhere. Such systems are economic, but they do not assure a contamination-free monoalgal operation. Fully closed tubular photobioreactors are potentially attractive for largescale culture that is free of contaminants (Gudin & Chaumont, 1983; Torzillo, Pushparaj, Bocci, Balloni, Materassi, & Florenzano, 1986). Closed devices are undoubtedly more expensive to build and maintain, but they may be the only option for producing certain
potential therapeutics. A variety of closed photobioreactors have been tested or proposed for generating microalgal biomass (Molina Grima, 1999; Tredici, 1999). However, only a few engineering analyses of such reactors have been published (Aiba, 1982; Pirt et al., 1983; Erickson & Lee, 1986; Weissman, Goebel, & Benemann, 1988; AcieH n FernaH ndez, GarcmH a Camacho, SaH nchez PeH rez, FernaH ndez Sevilla, & Molina Grima 1998; Rorrer & Mullikin, 1999). Here we provide a method for designing airlift-driven tubular photobioreactors with continuous run solar loop tubing. E!ects of tube length, #ow velocity, the airlift column height, and the geometric con"guration of the solar receiver on various performance parameters are examined. A photobioreactor designed using the developed approach is proved for culture of the microalga Phaeodactylum tricornutum.
2. The design strategy * Corresponding author. Tel.: #34-9-50-215484; fax: #34-9-50215484.
An airlift-driven photobioreactors with a continuous run tubular solar receiver essentially consists of two
0009-2509/01/$ - see front matter � 2001 Elsevier Science Ltd. All rights reserved. PII: S 0 0 0 9 - 2 5 0 9 ( 0 0 ) 0 0 5 2 1 - 2
2722
F. G. AcieH n Ferna& ndez et al. / Chemical Engineering Science 56 (2001) 2721}2732
& Molina Grima, 1997) using the equation I � I " [1!exp(! K C )], (3) � K C �� ? @ �� ? @ where K is the extinction coe$cient of the biomass, I is ? � the irradiance on the culture surface, and is the length �� of the light path from the surface to any point in the bioreactor. For outdoor placed tubular systems, is �� related with the tube diameter and the angle of declination (�) of the Sun from the vertical (AcieH n FernaH ndez et al., 1997); thus
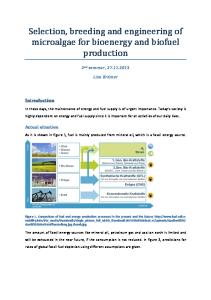
" . �� cos � Fig. 1. The outdoor culture system with details of the solar loop (a) and the degasser zone (b).
parts, the airlift system and the looped solar receiver (Fig. 1). The airlift device serves to circulate the culture through the solar receiver. A gas}liquid separator in the upper zone of the airlift column prevents gas bubbles from recirculating into the solar loop. As photosynthesis occurs in the solar tubing, oxygen accumulates and it is stripped out in the airlift zone when the #uid returns from the solar loop. The relevant design aspects are discussed next, separately for the two zones. 2.1. The tubular solar receiver The variable that must be optimized in design and scale-up of a photobioreactor for continuous production of microalgae is the biomass productivity. The biomass productivity is a function of the growth rate and the biomass concentration; under given conditions, the volumetric productivity P is @T P "� C , @T @
(1)
where � is the speci"c growth rate and C is the concen@ tration of the biomass. For a "xed biomass concentration, the growth rate depends on the average irradiance I inside the reactor. The speci"c growth rate may be � correlated with the average irradiance (Molina Grima et al., 1994a) as follows: � IL �" � � . IL #IL I �
(2)
In Eq. (2), � is the maximum speci"c growth rate, I is
� I a constant dependent on algal species and culture conditions, and n is an empirically established exponent. The average irradiance inside a culture may be estimated (Alfano, Romero, & Cassano, 1986; AcieH n FernaH ndez, GarcmH a Camacho, SaH nchez PeH rez, FernaH ndez Sevilla,
(4)
Thus, from a knowledge of the characteristics parameters of the algal strain (i.e., � , K , I , and n) and using Eqs.
� ? I (1)}(4), the biomass productivity may be established for any combination of external irradiance and the diameter of solar receiver tubes. Once the volumetric productivity has been determined, the areal productivity P is easily @? calculated as follows: �
� � "P , (5) P "P @T 4n @? @T 4n
2 2 where the separation between the adjacent parallel rungs of the continuous run looped tubing is expressed as a function of the tube diameter (i.e., separation"n ), 2� with n being the number of diameters of separation. 2 For maximizing the biomass productivity, the irradiance on the surface of the solar tubes must be maximized. This external surface irradiance depends mainly on the solar irradiance, which is a function of the location and the weather conditions (Incropera & Thomas, 1978). For a given location and weather, the geometric arrangement of the solar receiver tubes also determines the irradiance on the surface of the tubes and so does the albedo e!ect (irradiance enhancement because of re#ectance) of the surrounding. The geometric distribution of the tube over a given land surface controls the extent of mutual shading. To maximize land use, a two level loop design (Fig. 1a) with one layer of tubes placed below a "rst layer is preferred, as used by Torzillo, Carlozzi, Pushparaj, Montaini, and Materassi (1993). In this con"guration, the lower loop is displaced horizontally with respect to the upper one, so that all tubes are visible when viewed from directly overhead. Liquid #ow velocity in the solar tubular loop must be su$ciently high to ensure a turbulent #ow so that cells do not stagnate in the darker interior of the tube for long. However, excessive turbulence can damage cells and this poses an upper limit on the culture velocity. In general, the energy input in the tube and the airlift zone should be such that the dimensions of the microeddies do not approach cellular dimensions. The length scale of the microeddies may be estimated by applying
F. G. AcieH n Ferna& ndez et al. / Chemical Engineering Science 56 (2001) 2721}2732
Kolmogoro!'s theory of local isotropic turbulence (Kawase & Moo-Young, 1990); thus
� �
�"
� ��� * �\���, �
(6)
where � is the microeddy length, � is the energy dissipation per unit mass, � is the viscosity of the #uid, and � is * the #uid's density. The speci"c energy dissipation rate within the tube depends on the pressure drop, or 2C ;� �" D * ,
(7)
where C is the Fanning friction factor and ; is the D * super"cial velocity of the liquid in the tube. The friction factor may be estimated using the Blasius equation: C "0.0791 Re\� ��, (8) D where Re is the Reynolds number calculated as follows: �;
Re" * . (9) � * Thus, for any selected value of the liquid velocity that can be generated by the airlift device, a value of � can be calculated. The design must ensure that � remains greater than the dimensions of the algal cells, whereas the Reynolds number should exceed about 3000 so that the #ow is turbulent. As noted earlier, the maximum continuous run length of the solar tube is limited by a combination of the acceptable upper limit on the dissolved oxygen concentration, the liquid velocity through the tube, and the rate of photosynthesis (Mazzuca Sobczuk, GarcmH a Camacho, Camocho Rubio, AcieH n FernaH ndez, & Molina Grima, 2000). The tube length ¸ may be shown to be: ; ([O ] ![O ] ) � � � ��� , ¸" * (10) R � where ; is the maximum permissible culture velocity * established by the cell damage considerations. In Eq. (10), the oxygen concentration at the entrance of the solar tube is generally the same as the saturation value when the #uid is in equilibrium with the atmosphere, and [O ] is the maximum acceptable dissolved oxygen � ��� concentration that does not inhibit photosynthesis. R � is the volumetric rate of oxygen generation by photosynthesis in the tube. 2.2. The airlift system In addition to satisfying the principal demands of e!ectively circulating the #uid and achieving the requisite removal of oxygen, the airlift device must have a small volume compared to that of the solar loop so that the
2723
#uid spends less time in this relatively darker region of the bioreactor. These demands are met by having the riser and downcomer tubes of the airlift device as vertical extensions of the ends of the solar loop. The volume in the gas}liquid separator is minimized if the spacing between the parallel walls of the separator (Fig. 1b) is the same as the diameter of the riser or the downcomer. This arrangement also improves light penetration in the degassing zone. Permanent settling of solids is prevented by slanting the #oor of the separator at '603 relative to the horizontal. To achieve e!ective separation of gas and liquid, the distance between the entrance and the exit of the degasser should be such that the smallest bubbles have a su$cient time to disengage before the #uid enters the downcomer (Chisti & Moo-Young, 1993). Thus, the time taken by the #uid to traverse the length of the degasser must be greater than or equal to time required by the bubbles to rise out of the #uid. Because all #uid entering the degasser through the riser tube moves through the cross section of the degasser, we have ; A "; A , * P *" "
(11)
where A is the cross-sectional area of the riser tube, A is P " the cross-sectional area of the degassing zone, and ; is *" the super"cial liquid velocity in the degasser. When the parallel degasser walls are spaced a distance apart, the area A equals h , where h is the height of #uid in the " "� " degasser zone. To satisfy the disengagement criterion (Chisti & Moo-Young, 1993), the length ¸ of the degas" ser is governed by the relationship: ¸ h " * ", ; ; *" @
(12)
where ; is the bubble rise velocity. Because h "A / , @ " " substitution of Eq. (11) in Eq. (12) provides the equation ; A � ; *. ¸ " * P" "
; 4 ; @ @
(13)
A bubble rise velocity of 0.1 m s\� was used in Eq. (13) to obtain the minimum length ¸ . " The liquid #ow in the solar receiver is driven by the airlift pump. For a water-like #uid such as the microalgal broth, the induced #ow velocity depends mainly on the geometric con"guration of the circulation loop and the di!erence in gas holdup in the riser and the downcomer zones of the airlift column. This relationship has been established (Chisti, 1989) to be:
�
2g(� !� )h P B P ; " , * K /(1!� )�#K (A /A )�1/(1!� )� 2 P P B B
(14)
where K and K are the frictional loss coe$cients for 2 the top and the bottom connecting sections, respectively,
F. G. AcieH n Ferna& ndez et al. / Chemical Engineering Science 56 (2001) 2721}2732
2724
of the airlift loop. Eq. (14) is based on principles of energy conservation and it has been repeatedly validated for a broad range of scales and con"gurations of airlift devices (Chisti, 1989). In Eq. (14) h is the height of the P riser section, A and A are the cross-sectional areas of P B the riser and the downcomer, � is the gas holdup in the P riser, and � is the holdup in the downcomer. Generally, B K is much smaller than K , hence K can be neglected 2 2 (Chisti, 1989). This is particularly true of the loop con"guration used for photobioreactors. Because the bottom section of the loop is simply a continuous pipe (the solar receiver), the frictional loss coe$cient K can be approximated as ¸ K "4C �� , D
(15)
where C is the fanning friction factor established with D Blasius equation (Eq. (8)), and ¸ is the equivalent length �� of the loop. The latter is the straight tube length ¸ plus additional length that provides the same pressure drop as all the bends and valves in the loop combined. Because no gas bubbles recirculate, � "0; hence Eq. (14) with the B K term neglected and K replaced with Eq. (15) be2 comes g� h P P . ; " * (16) 2C (¸ / ) D �� Thus, ; can be estimated if the riser gas holdup (� ) is * P known. The gas holdup in the riser � , is function of the air #ow P rate supplied to the riser and also of the liquid #ow rate. The relationship between these parameters is the wellknown Zuber and Findlay (1965) equation
�
� (17) �" P C #(; /J ) � @ P where J is the sum of the super"cial velocities of the gas P and the liquid, � is the ratio of the super"cial gas velocity to the total super"cial velocity, C is a characteristic � parameter, and ; is the bubble rise velocity. The para@ meter C is a function of the radial velocity pro"le; � C typically varies from 1.0 to 1.3 as the #ow changes � from turbulent to laminar. The bubble rise velocity ; is @ a function bubble size. For the type of bubbles existing in the riser, the velocity tends to be between 0.2 and 0.4 m s\�. Eqs. (16) and (17) are solved simultaneously to determine the holdup � and the velocity ; for any P * speci"ed height h of the airlift column. The speci"c P energy input in the reactor may be calculated for any speci"ed volume #ow rate Q of the injected gas; thus % P Q hg �" % " % P , (18) M < where P is the power input due to aeration, M is the % mass of culture, and < is the culture volume.
For estimating the gas}liquid oxygen transfer capability of the airlift column, the overall gas}liquid volumetric mass transfer coe$cient k a may be estimated directly * * using various available correlations (Chisti, 1989, 1999a); however, the reliability of such estimates is often quite poor especially for unusual reactor geometries as was the case here. A more reliable prediction method based on fundamental principles and small-scale experimentation has been demonstrated for several cases (Chisti, 1989, 1999a) and that approach was used here. Thus, the volumetric mass transfer coe$cient (k a ), the gas holdup * * (� ), the mean bubble diameter (d ), and the true mass P transfer coe$cient (k ) are known to be related (Chisti, * 1989) according to the equation: k k a (1!� ) *" * * P . (19) d 6� P Calculations of the k /d ratio (Eq. 19) from the mea* sured k a and gas holdup in bubble columns and airlift * * devices have shown this ratio to be a constant for a given #uid, irrespective of the aeration rate (Chisti & MooYoung, 1987; Chisti, 1989). For air}water dispersions and for suspensions in which the suspending #uid is waterlike, the value of k /d may be calculated (Chisti, 1989) * with the equation
�
�
k gD ��� � � * "5.63;10\� * e\� ���!�1 , (20) d �� * where C is the concentration of solids in suspension 1 (wt/vol%), D is the di!usivity of gas in liquid, and � is * the interfacial tension. The k /d ratio calculated with * Eq. (20) could be used in Eq. (19) to determine the k a . * * The gas holdup � had been determined earlier using P Eqs. (16) and (17).
3. Materials and methods 3.1. Organism and culture conditions Phaeodactylum tricornutum UTEX 640 was the microalga used. The cultures were operated as chemostats. Fresh medium was supplied only during the 10-h daylight period and dilution stopped during the night. The photobioreactor was made of Plexiglas. The reactor was located outdoors in AlmermH a (363 50 N, 23 27 W), Spain. The cultures were maintained at pH 7.7 by automatically injecting carbon dioxide, as needed. Nutrients limitations were prevented by using the Mann and Myers (1968) medium at three times the normal concentration. The solar receiver loop was submerged in a pond of water held at 20$23C. The bottom and the inside walls of the pool were painted white to improve re#ectance. The liquid velocity in the solar tube varied independently of the dilution rate, from 0.17 to 0.50 m s\�.
F. G. AcieH n Ferna& ndez et al. / Chemical Engineering Science 56 (2001) 2721}2732
The photosynthetic photon #ux #uence rate or quantum scalar irradiance I , was measured inside the pond U using a quantum scalar irradiance meter (QSL-100 Biospherical Instruments Inc., San Diego, CA, USA). This type of sensor measures the photon #ux from all directions and it is better suited for systems that operate independently of the geometry of the light "eld. Because phytoplankton are scalar collectors, and photosynthesis does not depend on the direction from which the photons are received, scalar irradiance is a better measure of the available photon #ux (Lassen & Jorgensen, 1994). 3.2. Outdoor photobioreactor The tubular photobioreactor consisted of a 4 m tall airlift section with a degasser zone as shown in Fig. 1. Air was injected in one of the vertical tubes, or the riser, of the airlift device. Two ends of a continuous run solar receiver tubing were connected to the airlift riser and downcomer sections, respectively. The internal diameter of the tubing of the solar loop, the riser, and the downcomer was the same at 0.053 m. The external tube diameter was 0.06 m. The total reactor volume was 0.2 m�. The continuous run solar loop tubing was arranged in two layers to occupy a compact land area of 12 m�. The total run length was 80 m. The adjacent intertube distance in any horizontal plane was 0.09 m. The wall-towall vertical distance between the two layers of the loop was 0.03 m. The length of the degasser zone was 0.22 m and its bottom was sloped at an angle of 603 to the horizontal, so that biomass would not settle permanently. A suitable placement of tubes was established empirically by arranging 0.06 m diameter tubes with blackened surfaces in the con"guration of the solar loop and measuring the irradiance on the tube perimeter at 8 equally spaced locations on tubes in both planes (Fig. 2). The measurements were averaged to obtain a mean value, I . Irradiance I was measured also on
� � U the water pool. The mean irradiance on the surface of a tube was normalized with respect to that on the water
2725
pool, to obtain a dimensionless irradiance I . ��� ��� Measurements were made for a total of 18 combinations of vertical distance h and the horizontal tube spacing d (Fig. 2). The d-values tested were 0, 0.03, 0.06, 0.09, 0.12, and 0.15 m; the h-values were 0, 0.03, and 0.06 m. 3.3. The yuid-dynamic parameters The liquid velocity in the tube was measured by the tracer method. Thus, a pulse of acid/alkali was introduced at the entrance of the tubular loop and detected at the end using a pH electrode. The liquid velocity, ; , was * calculated using the known distance ¸ between the R tracer injection and detection points (entrance and exit of the solar receiver), and the measured time interval between injection and detection; thus, ¸ ; " R, (21) * t KP where t was the time interval between injection and KP detection. The gas holdup in the riser was measured by the manometric method (Chisti, 1989). Thus, two pressures taps drilled near the top and the bottom of the riser section were connected to an inverted U-tube manometer. From the known vertical distance h beR tween the taps, and the manometer reading h , the K holdup was calculated as follows:
h � " K. (22) P h R Because visible gas bubbles did not recirculate, the gas holdup in the downcomer and the loop were negligible, except when the gas was injected in the loop. In the latter case, the gas holdup in the loop was estimated as the ratio of the gas #ow rate and the total (gas and liquid) #uid #ow in the tube. The axial dispersion coe$cient in individual sections of the reactor was determined using the method of Verlaan, Van Eijs, Tramper, and van't Riet (1989). For this, a pulse of tracer was injected and signals from two probes located downstream at the entrance and exit of each zone (solar loop and the airlift system) were registered on-line. By comparing both signals, the Bodenstein number, Bo, was obtained in each zone and the dispersion coe$cient D was calculated as follows: X ; ¸ D " * ���� �� . (23) X Bo 3.4. Volumetric mass transfer coezcients
Fig. 2. Solar loop geometry. The vertical distance h and the horizontal spacing d between tubes are shown. Eight measurement points are indicated on the perimeter of tubes for averaging the irradiance received values.
The volumetric gas}liquid mass transfer coe$cient was determined in seawater without the cells. The reactor was "lled with seawater and liquid circulation was
2726
F. G. AcieH n Ferna& ndez et al. / Chemical Engineering Science 56 (2001) 2721}2732
initiated by supplying air in the riser, as in normal culture operations. Once a steady state had been attained, the water became air saturated and the measured concentration of dissolved oxygen was constant at the entrance (i.e., in the degasser zone) and the exit of solar tube. At this point, nitrogen was injected at the inlet of the solar tube. The location of the nitrogen injection point and the #ow rate of the gas were identical to those used typically with carbon dioxide during the cultures. Because of stripping of dissolved oxygen by the nitrogen gas, the oxygen concentration at the exit of the solar tube declined continuously until a new steady state had been attained (Camacho Rubio, AcieH n FernaH ndez, SaH nchez PeH rez, GarcmH a Camacho, & Molina Grima, 1999). At this condition, the amount of dissolved oxygen stripped in the solar receiver equaled the amount of oxygen absorbed in the airlift pump (riser and degasser). An oxygen mass balance on the solar receiver could now be established (Camacho Rubio et al., 1999) as follows: Q ([O ] ![O ] ) * � � � ��� "< k a ([OH]![O ]) (1!� ). (24) * * * � � *+ J In view of the plug #ow regime, Eq. (24) employs a logarithmic mean driving force for oxygen transfer, calculated as follows:
4. Results and discussion 4.1. Design of the reactor Mean annual biomass productivity of P. tricornutum at the known optimal dilution rate of 0.040 h\� was simulated using previously established outdoor growth parameters for various conditions of irradiance and solar tube diameters (AcieH n FernaH ndez et al., 1998). Eqs. (1)}(3) were used for predicting the biomass productivities shown in Fig. 3a. Clearly, as the tube diameter increased, the volumetric productivity of biomass declined for otherwise "xed conditions; however, the areal productivity increased as more culture volume could be accommodated in a given area. Both the volumetric and the areal productivities were similarly sensitive to changes in the tube diameter (Fig. 3a). Too low a volumetric productivity is not wanted as it implies a dilute culture broth and this substantially increases the cost of recovering the biomass, as a greater volume needs to be processed for obtaining a given quantity of cells. In addition, as the tube diameter increased, the energy dissipation per unit mass decreased whereas the range between maximum
([OH]![O ]) � � *+ ([OH] ![O ] )!([OH] ![O ] ) � � � � � ��� � ��� . " (25) ln([OH] ![O ] )/([OH] ![O ] ) � � � � � ��� � ��� The dissolved oxygen values at the inlet and the outlet of the solar tube were determined experimentally, whereas the equilibrium dissolved oxygen values were established using Henry's law. At the entrance of the solar tube (i.e., the end of the degasser), because pure nitrogen bubbles were present, the dissolved oxygen concentration in equilibrium with the gas phase was zero. At the exit of the solar tube, the mole fraction of oxygen in the nitrogen bubbles needed to be known in order to calculate [OH] . The exit mole fraction of oxygen in the gas phase � ��� was calculated using the equation: Q ([O ] ![O ] )"F � > � , (26) * � � � ��� , - ���� where F � is the molar #ow rate of the injected nitrogen , and > � is the oxygen-to-nitrogen molar ratio in the gas exiting from the solar receiver tube. Similar balances could be established for the airlift pump and, hence, the k a in the airlift device (excluding the solar tube) * *� � �� could be determined (Camacho Rubio et al., 1999). Because for the conditions studied the absorption rate was shown to be independent of the chemical reaction taking place in the liquid phase, the k a could be directly * *�!-� related to the k a for oxygen by a single factor ("0.93) * * that took into account the di!erence in aqueous di!usivities of the two gases.
Fig. 3. In#uence of tube diameter on: (a) volumetric and areal biomass productivities of P. tricornutum cultures; (b) the speci"c energy dissipation rate and maximum acceptable culture velocity (; ) to avoid * � shear stress related damage. The minimum velocity needed for well developed turbulence are also shown. The mean annual biomass productivity values were obtained by using the growth model (AcieH n FernaH ndez et al., 1998), Eq. (1) and Eq. (3), with the following parameters: n"1.49, I "114.67 �E m\� s\�, K "0.0369 m�g\�, and I ? � "0.063 h\�. The energy dissipation rate and culture velocity were
� obtained by using Eqs. (6)}(9).
F. G. AcieH n Ferna& ndez et al. / Chemical Engineering Science 56 (2001) 2721}2732
Fig. 4. In#uence of the horizontal and vertical tube spacing on the irradiance received on the tubes surface relative to irradiance on the water pond. The data are the mean values from an analysis of variance of the measurements.
and minimum culture velocity available increased (Fig. 3b). Thus, to attain a compromise between the con#icting demands of volumetric and areal productivities, the energy dissipation per unit mass and the available culture velocity, a tube diameter value of 0.06 m was selected for construction. The estimated annual mean productivity for the selected tube diameter was 35 g m\�d\� or 1.5 g l\�d\�, about 70% of the maximum value expected in a tube with a diameter of 0.03 m. Regarding the optimal vertical and horizontal distances between adjacent tubes of the solar loop, the horizontal distance was found to be the main factor that in#uenced normalized irradiance (Fig. 4). Tubes spaced further apart horizontally (Fig. 4) received greater sunlight; however, once a spacing of about 0.1 m had been attained further increase did not signi"cantly enhance the radiation received. Thus, a spacing of 0.09 m was selected for construction. The vertical distance between the two layers of tubes did not signi"cantly a!ect the sunlight received; however, the irradiance was reduced slightly as the distance increased to 0.06 m (Fig. 4); thus, a lower value of 0.03 m was selected as satisfactory for construction of the solar loop. The noted geometry of the solar receiver enhanced light capture by 64% compared to if the tubes were installed parallel, in a single layer, directly on the #oor with a white re#ective coating on the #oor, as previously used by Torzillo et al. (1993). The selected con"guration reduced surface irradiance on tubes by only 17% compared to the single layer, parallel run
2727
con"guration with widely spaced tubes, as previously used by Molina Grima et al. (1994b). As previously noted, excessive turbulence is potentially damaging to algal cells (Chisti, 1999b) and the culture velocity through the solar tubing is limited by shear stress considerations. Turbulence associated damage appears to occur when the dimensions of the terminal microeddies approach those of the algal cells (Torzillo et al., 1993; Contreras GoH mez, GarcmH a, Camacho, Molina Grima, & Merchuk, 1998). For P. tricornutum, Contreras GoH mez et al. (1998) observed a decline in speci"c growth rate when the estimated dimensions of microeddies became 45 �m and lower. These dimensions are comparable to those of the P. tricornutum cells that are typically up to 35 �m long and 3 �m wide (Lewin, 1958). Thus, in the solar receiver tube, the #ow velocity should be such that the microeddy dimensions remain greater than 45 �m (Molina Grima et al., 1999). If a lower safe limit on eddy length of 50 �m is accepted, the maximum culture velocity cannot exceed 1.0 m s\� (Fig. 5), assuming a water-like behavior of the culture broth. The #ow velocity to attain an eddy size of 50 �m is always greater than the threshold for laminar}turbulent transition. A velocity of 1.0 m s\� corresponds to an speci"c power input of 0.17 W kg\�, or 170 W m\�. Although an upper velocity limit of 1.0 m s\� was estimated, the design value was lower at 0.5 m s\� because of limited mechanical strength of the plastic solar loop. Using this value of velocity, also in the turbulent regime, the maximum tube length was calculated such that the oxygen concentration at the end of the loop would not exceed 300% of air saturation value. The latter had been shown to be acceptable in earlier work (AcieH n FernaH ndez et al., 1998; Camacho Rubio et al., 1999). Thus, a maximum oxygen generation rate of 0.003 mol O m\� s\�, corresponding � to a biomass productivity of 2.5 g l\� d\� (AcieH n FernaH ndez et al., 1998), was used in Eq. (10) to obtain a maximum loop length of 80 m, for an assumed oxygen concentration of 100% of air saturation at the inlet of the loop. The induced liquid circulation velocities for various aeration rates and heights of the airlift column were
Fig. 5. In#uence of liquid velocity on the length � of the microeddies and power dissipation (consumption) for a 0.06 m diameter tube and a #uid with waterlike properties.
2728
F. G. AcieH n Ferna& ndez et al. / Chemical Engineering Science 56 (2001) 2721}2732
Fig. 6. E!ects of super"cial gas velocity (; ) in the riser on: (a) the %P induced liquid velocity in the solar receiver tube; and (b) volumetric mass transfer coe$cient (k a ) in the riser zone. The plots were * * simulated using Eqs. (16)}(20) for various heights of the airlift circulator.
simulated using Eqs. (16) and (17) to establish a satisfactory design height of the airlift column. Similarly, for the various selected gas injection rates in the airlift riser, the values of the mass transfer coe$cient k a were deter* * mined using Eqs. (17), (19), and (20). The results are shown in Fig. 6. As expected, for a given gas velocity in the riser and otherwise "xed conditions, the induced liquid circulation velocity increases as the height of the airlift column increases; however, as is obvious from Fig. 6a, the requisite liquid velocity of about 0.5 m s\� cannot be attained with an airlift column that is less than 4 m tall for any reasonable gas #ow rate. Thus, a 4 m airlift height was selected for construction. Also, for a 4 m tall airlift, the k a value of 0.13 s\� is easily attained in the airlift * * column (Fig. 6b). This value of k a was estimated as * * being su$cient for reducing the dissolved oxygen concentration from 300% of air saturation to less than 150% of air saturation at the entrance of the solar receiver. 4.2. Hydrodynamic and mass transfer characterization Once the photobioreactor had been built, its hydrodynamic and mass transfer behavior was characterized to validate the design approach used. Thus, the experimental measurements of the induced liquid velocity, the k a and the dispersion coe$cient values are * * shown in Fig. 7 for various values of the super"cial aeration velocity in the riser. Separate k a values are * *
Fig. 7. E!ects of the super"cial gas velocity ; in the riser on: (a) the %P measured liquid velocity ; in the loop; (b) the measured mass transfer * coe$cients, k a ; and (c) the measured axial dispersion coe$cient D . * * X The k a and D values are shown for the solar receiver tubing, the * * X airlift device, and the airlift}loop combined (global) system.
shown for the airlift section and the tubular loop of the photobioreactor. Both the general behavior and the magnitude of the liquid velocity and the k a data agree with * * the design predictions. The k a values in the solar loop * * were of course much lower than ones in the airlift device (Fig. 7b) because the gas holdup and, consequently, the mass transfer interfacial area were minimal in the solar tube. Also, because the marginal gas holdup in the solar tube was little a!ected by the gas injection rate in the riser of the airlift device, the k a in the loop was relative* * ly insensitive to aeration rate. A relatively constant k a * * in the loop also attests to a good gas}liquid separation performance of the degasser zone of the airlift device. As previously noted, the k a in the airlift zone essentially * * controls the oxygen removal capability of the airlift column. The k a in the solar loop in#uences the absorp* * tion of carbon dioxide injected in the loop.
F. G. AcieH n Ferna& ndez et al. / Chemical Engineering Science 56 (2001) 2721}2732
The mixing performance of the photobioreactor was characterized in terms of the axial dispersion coe$cients for the solar loop, the airlift zone, and an overall value for the airlift-loop combination. These various measured dispersion coe$cients (D ) are shown in Fig. 7c, as funcX tions of the super"cial gas velocity in the riser. Based on the dispersion coe$cient values, the airlift device is clearly far better mixed than the solar tube. The mixing in the airlift zone improved as the gas #ow rate increased. The solar tube, with low values of dispersion coe$cients, was in plug #ow and the dispersion coe$cient was virtually constant irrespective of the liquid #ow rate in the tube, or the aeration rate in the airlift riser zone. Because of poor axial mixing in the solar loop, axial gradients in concentration of nutrients can develop. However, for most nutrients this was not an issue as the culture was continuously fed with fresh medium in the airlift device. The only nutrient that could become limiting in the solar loop was carbon dioxide that was injected near the entrance of the solar loop. Because the k a * * value in the loop was low, pure carbon dioxide was indicated for injection to improve the gas}liquid mass transfer driving force and prevent carbon limitations (Camacho Rubio et al., 1999). However, injecting pure carbon dioxide can a!ect local pH values and culture productivity (Olaizola, Duerr, & Freeman, 1991; Mazzuca Sobczuk et al., 2000). This e!ect may be reduced by diluting the injected gas with air or nitrogen. With careful attention to design, it is usually possible to ensure a su$cient mass transfer capability in the airlift device so that photosynthetically generated oxygen does not accumulate to excessively high concentrations. This capability was achieved as demonstrated during culture, discussed next. 4.3. Outdoor culture In order to check the performance of the bioreactor the microalga P. tricornutum was cultured outdoors during Spring (Table 1). A biomass productivity of 1.2 g l\� d\� was obtained at a dilution rate of 0.050 h\� when the mean solar irradiance on the pool (I ) was about U 1200 �E m\� s\�. (Note: the mean daily irradiance was calculated by time-averaging the instantaneous irradiance over a 24 h period.) The experimentally obtained biomass productivity of 1.2 g l\� d\� was about 10%
2729
greater than the value estimated using the design methodology. A similar level of agreement was seen between the predicted and measured areal productivities of biomass, thus validating the predictive capability of the design equations. To assess the in#uence of the solar loop liquid velocity on the culture performance, three di!erent liquid velocities were tested: 0.50, 0.35, and 0.17 m s\�, at a constant dilution rate of 0.050 h\�. At the highest liquid velocity, the biomass concentration attained was 2.38 g l\�. A lower concentration of 2.29 g l\� was obtained when the velocity was reduced to 0.35 m s\�; however, the biomass productivity at these two velocities did not di!er signi"cantly. The culture carried out at a velocity of 0.17 m s\� failed to attain steady state; the culture perished when the velocity was reduced further. Turbulence is known to enhance biomass productivity relative to laminar #ow conditions. For example, Carlozzi and Torzillo (1996) noted a lower biomass productivity in laminar #ow relative to that in turbulent conditions for Spirulina cultures in tubular photobioreactors. A 29% increase in Spirulina biomass productivity was observed when the #ow pattern changed from laminar to turbulent in straight tubes. Further improvement in turbulent mixing produced no bene"cial e!ect; a high liquid velocity of 0.97 m s\� damaged the culture and reduced the biomass productivity. Similar bene"cial e!ects of limited turbulence have been also observed for Chlorella growing in a tubular photobioreactor (Pirt et al., 1983). Turbulence repeatedly moves cells from darker interior of a tube to the better illuminated peripheral zone, hence the cells are not starved of light for extended periods. Also, movement of cells from light to dark zones may actually enhance productivity so long as the duration of a dark period remains small. Dark intervals of the order of 1 s are said to improve of the solar energy conversion by biomass (Laws, Satoru, Hirater, & Pang, 1987; Terry, 1986), as such intervals allow the dark catalytic reactions of photosynthesis to run to completion, restoring the photosynthetic apparatus to its full e$ciency for the next light period. With P. tricornutum too, the biomass productivity increased with enhanced turbulence. Thus, as shown in Table 1, the biomass productivity was a little better at a higher #ow velocity of 0.50 m s\� compared to when the velocity was
Table 1 Biomass concentrations and productivities for various dilution rates, liquid velocities, and mean daily solar irradiance levels (Spring season) during cultures in the designed reactor. Date
D, h\�
; , m/s *
I (�E m\� s\�) U
C , g/l @
P , g/l d @T
P , g/m�d @?
30/3 5/4 8/4
0.050 0.050 0.050
0.50 0.35 0.17
1289 1126 1250
2.38 2.29 *
1.19 1.15 *
19.8 19.1 *
2730
F. G. AcieH n Ferna& ndez et al. / Chemical Engineering Science 56 (2001) 2721}2732 Table 2 Design and operation variables of the bioreactor for outdoor culture of microalgae
Fig. 8. Variation of solar irradiance and the dissolved oxygen concentration in the degasser zone with the solar hour. Data are shown for three di!erent liquid velocities.
0.35 m s\�. Potentially, this di!erence can be attributed to the small di!erence in irradiance between March and April (Table 1); however, the substantial change in productivity during April (Table 1) is clearly related with the velocity. As previously noted, the culture collapsed when the velocity was reduced to below 0.17 m s\�, apparently because of photooxidation e!ects. Liquid velocity also determines the maximum dissolved oxygen concentration developed in the tubular loop. This is because the residence time in the tube is governed by the velocity and the rate of generation of oxygen by photosynthesis is "xed under a given level of irradiance. The dissolved oxygen concentration in Fig. 8 varies because of a combined e!ect of the liquid velocity and the change in the irradiance level (AcieH n FernaH ndez et al., 1998). During the early morning the dissolved oxygen concentration increases rapidly as irradiance increases to around 2500 �E m\� s\�. At midday, when the irradiance level exceeds 2500 �E m\� s\�, the dissolved oxygen declines because of a reduced rate of generation by photoinhibition. In the afternoon, as the solar irradiance decreases, the dissolved oxygen concentration also reduces. The maximum dissolved oxygen concentration attained is clearly in#uenced by the liquid velocity. Diurnal variation in concentration is minimal at the highest liquid velocity (Fig. 8).
5. Concluding remarks A method is developed for design of airlift-driven photobioreactors with continuous run tubular solar loops. The design method e!ectively combines the relevant aspects of external irradiance-dependent cell growth, oxygen accumulation in the solar loop, oxygen removal in the airlift device, and hydrodynamics of the airlift system that determine the #ow velocity through the solar receiver. A bioreactor con"guration determined by the design methodology is proved during continuous outdoor culture of the microalga P. tricornutum. The
Description
Value
Tube diameter Loop length Culture volume Land area occupied Airlift column height Vertical spacing between tube layers Horizontal spacing between adjacent parallel tube rungs Culture velocity through the solar tube Super"cial aeration velocity in the riser of the airlift
0.06 m 80 m 0.20 m� 12.0 m� 4m 0.03 m 0.09 m 0.5 m s\� 0.3 m s\�
model predicted hydrodynamic behavior of the bioreactor agreed closely with the measured data. Similarly, the predicted culture productivity matched measurements. The designed bioreactor con"guration and the suitable operations conditions are summarized in Table 2.
Notation A P A " A B Bo C C @ C D C 1 C � D d d D *
Cross sectional area of riser, m� Cross sectional area of degasser, m� Cross sectional area of downcomer, m� Bodenstein number in Eq. (23) Tracer concentration, mol l\� Biomass concentration, g l\� Fanning friction factor Concentration of suspended solids, g l\� Characteristic parameter in Eq. (17) Dilution rate, h\� Horizontal spacing between tubes, m Mean bubble diameter, m Di!usivity of the transferring gas in liquid, m� s\� D Axial dispersion coe$cient, m�s\� X Molar #ow rate of the injected nitrogen, F � , mol s\� g Gravitational acceleration, m s\� h Vertical spacing between tubes, m h Fluid height in the degasser, m "
h Manometer reading, m K h Height of riser, m P h Vertical distance between manometer taps, m R I Average irradiance inside the reactor, � �E m\� s\� I Constant in Eq. (2), �E m\� s\� I I Irradiance averaged over 24 h, �E m\� s\�
� � I Normalized irradiance ��� ��� I Irradiance on photobioreactor surface, M �E m\� s\�
F. G. AcieH n Ferna& ndez et al. / Chemical Engineering Science 56 (2001) 2721}2732
I U J P k a * * k * K ? K K 2 ¸ ¸ " ¸ �� ¸ ���� �� ¸ R M n n 2 [OH] � [O ] � � [O ] � ��� P @? P @T P % Q % Q * Re R � t t KP ; @ ; %P ; * ; *" < < * > � -
Irradiance in the water pool, �E m\� s\� Sum of super"cial velocities of gas and liquid phases, m s\� Volumetric gas}liquid mass transfer coe$cient, s\� Gas}liquid mass transfer coe$cient, m s\� Extinction coe$cient for biomass, m� g\� Frictional loss coe$cient for the bottom zone of the airlift Frictional loss coe$cient for the top of the airlift Straight tube length in loop, m Length of the degasser section, m Equivalent length of solar loop, m Length of #ow path in any zone, m Distance between the tracer injection and detection points, m Mass of liquid in reactor, kg Exponent in Eq. (2) Design speci"ed factor in Eq. (5) Saturation concentration of oxygen in liquid in equilibrium with gas phase, mol l\� Dissolved oxygen concentration at entrance of solar tube, mol l\� Dissolved oxygen concentration at the outlet of the solar tube, mol l\� Areal productivity of biomass, g m\� d\� Volumetric productivity of biomass, g l\� Power input due to gassing, J s\� Volumetric #ow rate of gas in the riser zone, m� s\� Volumetric #ow rate of liquid, m� s\� Reynolds number Volumetric rate of oxygen generation, mol O m\� s\� � Time, s Time interval between tracer injection and detection, s Terminal rise velocity of single bubble, m s\� Gas velocity in the riser zone, m s\� Super"cial liquid velocity in the tube, m s\� Super"cial liquid velocity in the degasser, m s\� Volume of culture, m� Volume of liquid in a given zone, m� Oxygen-to-nitrogen molar ratio, mol O mol N\� � �
Greek symbols � � J � P � B �
Ratio of super"cial gas velocity to the total (gas and liquid) super"cial velocity Gas holdup in the loop Gas holdup in the riser Gas holdup in the downcomer Length of microeddies, m
� � * �
� � � �
�� �
2731
Speci"c growth rate, h\� Viscosity of the culture broth, kg m\� s\� Maximum speci"c growth rate, h\� Energy dissipation per unit mass, J s\� kg\� Density of the #uid, kg m\� Interfacial tension, J m\� Solar tube diameter, m Length of light path in Eq. (3) de"ned by Eq. (4), m Solar zenith angle in Eq. (4), deg
References AcieH n FernaH ndez, F. G., GarcmH a Camacho, F., SaH nchez PeH rez, J. A., FernaH ndez Sevilla, J. M., & Molina Grima, E. (1997). A model for light distribution and average solar irradiance inside outdoor tubular photobioreactors for the microalgal mass culture. Biotechnology and Bioengineering, 55, 701}714. AcieH n FernaH ndez, F. G., GarcmH a Camacho, F., SaH nchez PeH rez, J. A., FernaH ndez Sevilla, J. M., & Molina Grima, E. (1998). Modelling of biomass productivity in tubular photobioreactors for microalgal cultures: E!ects of dilution rate, tube diameter and solar irradiance. Biotechnology and Bioengineering, 58, 605}616. Aiba, S. (1982). Growth kinetics of photosynthetic microorganisms. Advances in Biochemical Engineering, 23, 85}156. Alfano, O. M., Romero, R. L., & Cassano, A. E. (1986). Radiation "eld modelling in photoreactors}I. Homogeneous media. Chemical Engineering Science, 41, 421}444. Burlew, J. S. (1953). Algal culture from laboratory to pilot pant, vol. 600. Washington DC: Carnegie Institute. Camacho Rubio, F., AcieH n FernaH ndez, F. G., SaH nchez PeH rez, J. A., GarcmH a Camacho, F., & Molina Grima, E. (1999). Prediction of dissolved oxygen and carbon dioxide concentration pro"les in tubular photobioreactors for microalgal culture. Biotechnology and Bioengineering, 62, 71}86. Carlozzi, P., & Torzillo, G. (1996). Productivity of Spirulina in a strongly curved outdoor tubular photobioreactor. Applied Microbiology and Biotechnology, 45, 18}23. Chisti, M. Y. (1989). Airlift bioreactors. London: Elsevier. Chisti, Y. (1999a). Mass transfer. In M. C. Flickinger, & S. W. Drew (Eds.), Encyclopedia of bioprocess technology: Fermentation, biocatalysis and bioseparation, vol. 3 (pp. 1607}1640). New York: Wiley. Chisti, Y. (1999b). Shear sensitivity. In M. C. Flickinger, & S. W. Drew (Eds.), Encyclopedia of bioprocess technology: Fermentation, biocatalysis, and bioseparation, vol. 5 (pp. 2379}2406). New York: Wiley. Chisti, M. Y., & Moo-Young, M. (1987). Airlift reactors: Characteristics, applications and design considerations. Chemical Engineering Communications, 60, 195}242. Chisti, Y., & Moo-Young, M. (1993). Improve the performance of airlift reactors. Chemical Engineering Progress, 89(6), 38}45. Contreras GoH mez, A., GarcmH a Camacho, F., Molina Grima, E., & Merchuk, J. C. (1998). Interaction between CO }mass transfer, light � availability, and hydrodynamic stress in the growth of Phaeodactylum tricornutum in a concentric tube airlift photobioreactor. Biotechnology and Bioengineering, 60, 317}325. Erickson, L. E., & Lee, H. Y. (1986). In W. Barclay, & R. P. McIntosh (Eds.), Algal biomass technologies: An interdisciplinary perspective (p. 197). Gudin, C., & Chaumont, D. (1983). Solar biotechnology study and development of tubular solar receptors for controlled production of photosynthetic cellular biomass. In W. Palz, & D. Pirrwitz (Eds.), Proceedings of the Workshop and E. C. Contractor's meeting in Capri (pp. 184}193). Dordrecht: D. Reidel Publishing Company.
2732
F. G. AcieH n Ferna& ndez et al. / Chemical Engineering Science 56 (2001) 2721}2732
Incropera, F. P., & Thomas, J. F. (1978). A model for solar radiation conversion to algae in shallow pond. Solar Energy, 20, 157}165. Kawase, Y., & Moo-Young, M. (1990). Mathematical models for design of bioreactors: Applications of Kolmogoro!'s theory of isotropic turbulence. Chemical Engineering Journal, 43, B19}B41. Lassen, C., & Jorgensen, B. (1994). A "ber optic irradiance microsensor (cosine collector): Application for in situ measurements of absorption coe$cients in sediments and microbial mats. FEMS Microbiology Ecology, 15, 321}336. Laws, E. A., Satoru, T., Hirata, J., & Pang, L. (1987). Optimization of microalgae production in a shallow outdoor #ume. Biotechnology and Bioengineering, 32, 140}147. Lewin, J. C. (1958). The taxonomic position of Phaeodactylum tricornutum. Journal of General Microbiology, 18, 427}432. Mann, J. E., & Myers, J. (1968). On pigments, growth and photosynthesis of Phaeodactylum tricornutum. Journal of Phycology, 4, 349}355. Mazzuca Sobczuk, T., GarcmH a Camacho, F., Camacho Rubio, F., AcieH n FernaH ndez, F. G., & Molina Grima, E. (2000). Carbon dioxide uptake e$ciency by outdoor microalgal cultures in tubular airlift photobioreactors. Biotechnology and Bioengineering, 67, 465}475. Molina Grima, E. (1999). Microalgae, mass culture methods. In M. C. Flickinger, & S. W. Drew (Eds.), Encyclopedia of bioprocess technology: Fermentation, biocatalysis and bioseparation, vol. 3 (pp. 1753}1769). New York: Wiley. Molina Grima, E., AcieH n FernaH ndez, F. G., GarcmH a Camacho, F., & Chisti, Y. (1999). Photobioreactors: Light regime, mass transfer, and scale up. Journal of Biotechnology, 70, 231}248. Molina Grima, E., GarcmH a Camacho, F., SaH nchez PeH rez, J. A., FernaH ndez Sevilla, J. M., AcieH n FernaH ndez, F. G., & Contreras GoH mez, A. (1994a). A mathematical model of microalgal growth in light limited chemostat culture. Journal of Chemical Technology and Biotechnology, 61, 167}173. Molina Grima, E., GarcmH a Camacho, F., Sanchez Perez, J. A., Urda Cardona, J., AcieH n FernaH ndez, F. G., & FernaH ndez Sevilla, J. M. (1994b). Outdoor chemostat culture of Phaeodactylum tricornutum
UTEX 640 in a tubular photobioreactor for the production of eicosapentaenoic acid. Biotechnology and Applied Biochemistry, 20, 279}290. Olaizola, M., Duerr, E. O., & Freeman, D. W. (1991). E!ect of CO � enhancement in an outdoor algal production system using Tetraselmis. Journal of Applied Phycology, 3, 363}366. Pirt, S. L., Lee, Y. K., Walach, M. R., Pirt, M. W., Balyuzi, H. H., & Bazin, M. J. (1983). A tubular bioreactor for photosynthetic production of biomass from carbon dioxide: Design and performance. Journal of Chemical Technology and Biotechnology, 33B, 35}58. Rorrer, G. L., & Mullikin, R. K. (1999). Modeling and simulation of a tubular recycle photobioreactor for macroalgal cell suspension cultures. Chemical Engineering Science, 54, 3153}3162. Terry, K. L. (1986). Photosynthesis in modulated light: Quantitative dependence of photosynthetic enhancement on #ashing rate. Biotechnology and Bioengineering, 28, 988}995. Tredici, M. R. (1999). Bioreactors, photo. In M. C. Flickinger, & S. W. Drew (Eds.), Encyclopedia of bioprocess technology: Fermentation, biocatalysis and bioseparation, vol. 1 (pp. 395}419). New York: Wiley. Torzillo, G., Carlozzi, P., Pushparaj, B., Montaini, E., & Materassi, R. (1993). A two plane tubular photobioreactor for outdoor culture of Spirulina. Biotechnology and Bioengineering, 42, 891}898. Torzillo, G., Pushparaj, B., Bocci, F., Balloni, W., Materassi, R., & Florenzano, G. (1986). Production of Spirulina biomass in closed photobioreactors. Biomass, 11, 61}64. Verlaan, P., Van Eijs, A. M. M., Tramper, J., & van't Riet, K. (1989). Estimation of axial dispersion in individual sections of an airliftloop reactor. Chemical Engineering Science, 44, 1139}1146. Weissman, J. C., Goebel, R. P., & Benemann, J. R. (1988). Photobioreactor design: Mixing, carbon utilization, and oxygen accumulation. Biotechnology and Bioengineering, 31, 336}344. Zuber, N., & Findlay, J. A. (1965). Average volumetric concentration in two phase #ow systems. Journal of Heat Transfer ASME, 453}457.