Journal of American Science 2010;6(5)
Roy et al, Air quality depreciation index
Air quality depreciation index in a coal mining area- a case study from eastern India Papiya Roy1, Gurdeep Singh2, Asim Kumar Pal3 1
JRF, Dept. of Environmental Sc. & Engg., Indian School of Mines, Dhanbad, Jharkhand, India Professor & Head, Dept. of Environmental Sc. & Engg., Indian School of Mines, Dhanbad, Jharkhand, India 3 Associate Professor, Dept. of Environmental Sc. & Engg., Indian School of Mines, Dhanbad, Jharkhand, India 2
[email protected] Abstract: The comparison with National Ambient Air Quality Standards does not always depict a true picture of the Air Quality Status of a study area. As an alternative an index that measures depreciation in Air Quality on more realistic terms has been proposed and applied to the ambient air monitoring data collected from Talcher Coalfields in India. Results have been discussed in detail to illustrate the application of the proposed index and utility in bringing out more realistic air quality assessment [Journal of American Science 2010;6(5):107-114]. (ISSN: 1545-1003). Key words: National Ambient Air Quality Standards, value function curves, air quality depreciation index 1.0 Introduction Coal mining and coal based thermal generation activities result in serious pollution problems due to release of particulates and noxious gases in the atmosphere. Over the past few years, with the introduction of mechanized mining techniques and heavy earth moving equipments, this problem has been further aggravated (Singh and Sharma, 1991; Sharma and Singh, 1992). Air quality assessment in Korba Coalfield also revealed an unsatisfactory air quality there. The concentration of respirable particulate matter (RPM) was found to be at an alarming level there (Singh and Puri, 2004). In opencast mines all the major mining activities directly or indirectly contribute to air pollution. Sharma & Singh (1990) found that unloading and loading, transportation of coal, poor condition of roads and huge quantities of open air coal burning were responsible for air pollution in coal mines. Mining operations share a number of common stages or activities each of which has potentially adverse impacts on the natural environment. The health and safety status of the occupational and the communities in the environs of the mine may also be affected as a result of mining. Like other industries, social and cultural conditions of the concerned environment may accordingly be modified. In absence of appropriate control measures mining operations may lead to environmental disturbances. The impact of a mining operation commences with exploration activities, extends through extraction and processing of minerals and may continue even after closure of the operation. One http://www.americanscience.org/journals
[email protected].
of the important environmental impact of mining is the degradation in the air quality. The monitoring and evaluation of ambient air quality is first important step in controlling air pollution. Current approaches to the evaluation of air quality in India are based entirely on the comparison of measured concentration of pollutants with National Ambient Air Quality Standards (NAAQS). A comparison of data with NAAQS serves the purpose to some extent, but this cannot map the periodical degradation in the air quality, particularly if the measured values remain below NAAQS. A number of air quality indices have been formulated (Babcock, 1970 and Ricci, 1979). Most of the indices take NAAQS standards as the base for devising the scale. There are other systems, which are independent of the NAAQS and based on the measurement of air quality (with due weightage to the potential of pollutants to affect biophysical, health and aesthetic attributes) on an absolutely environmental quality scale and not in relation to NAAQS. Although the use of this approach to some extent helps to maintain a 'desired' environmental quality, it does a little to 'map' periodic degradation in air quality, particularly if the measured values remain below NAAQS. The reason behind this drawback arises from the fact that by providing an upper threshold concentration value in the form of a standard, air quality tends to get categorized either as 'good' or 'bad' depending on whether the standards have been exceeded on not. In reality, however, there are instances where concentration of pollutants become sufficiently high to pose environmental and 107
Journal of American Science 2010;6(5)
Roy et al, Air quality depreciation index
health problems, but owing to the fact that may not falsely interpreted to represent ‘acceptable’ air quality. Viewed in this backdrop, the present paper attempts to propose an air quality depreciation index that measures deterioration in air quality (with due weightage to the potential capacity of pollutants to affect bio-physical, health and aesthetic attributes) on an 'absolute' environmental quality scale independent of NAAQS. 1.1 Air Quality Depreciation Index The air quality depreciation index, as proposed here, attempts to measure deterioration in air quality on an arbitrary scale that ranges between 0 and –10. An index value of ‘0’represents most desirable air quality having no depreciation from the best possible air quality with respect to the pollutants under consideration while an index value of –10 represents maximum depreciation or worst air quality. Index values differing from 0 towards –10 represent successive depreciation in air quality from the most desirable. The air quality depreciation index is defined as follows:
be high enough to cross the threshold value, they are
HWi
= Health Weight for ith parameter
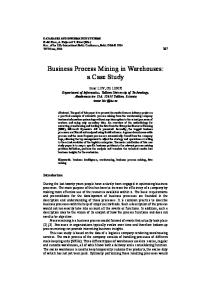
….(1) where, AQi = Air quality index value for ith parameter CWi = Composite weight for ith parameter n = Total no. of pollutants considered The values of the AQi are obtained from the value function curves. In the value function curves the value of 0 signifies worst air quality and value of 1 represents the best air quality for corresponding pollutant concentration. Typical value function curves for SPM, SO2, NOx and (TSP x SO2) are given in Figures 1, 2, 3 and 4, respectively.
Figure 1. Value function curve for suspended particulate matter (Jain et al. 1977)
Value of CWi in equation (1) is computed using the following expression: …………(2) where, TWi = Total weight of ith parameter
where, AWi = Aesthetic weight for ith parameter BPIWi = Bio- Physical Impact Weight for ith parameter http://www.americanscience.org/journals
[email protected].
108
Journal of American Science 2010;6(5)
Roy et al, Air quality depreciation index
Figure 2. Value function curve for sulphur dioxide (Jain et al., 1977) Figure 3. Value function curve for nitrogen oxides
impinger samples (containing SO2, NOX in specific absorbing solutions) were analyzed spectrophotometrically using Scanning Visible Spectrophotometer (VIS-7200). Improved WestGaeke method and Jacob & Hocheiser modified methods were used for analysis of SO2 and NOX, respectively as per standard methods prescribed by Central Pollution Control Board (CPCB, July 2003), India. 3.0 Results and discussions Assignment and computation of Composite Weight for different pollutants is given in Table 1. Air Quality monitoring results for Talcher mining Belt is summarised in Table 2. Values for AQi and AQdep calculated as per equation (1) are given in Table 3. For MCL Coalfield the air quality depreciation values are depicted in Table 3. Comparison with NAAQS cannot forcefully categorize air quality as 'objectionable' or 'unacceptable'. Till standards are exceeded, there is no indication of deterioration in air quality from what can be considered 'truly acceptable air quality'. Results of air quality monitoring in the study areas show that the concentration levels of SPM and PM10 exceeds the NAAQS while concentration levels of NOx and SO2 are found to be below the NAAQS at most of the sampling stations of both the study area. So the overall results do not provide a clear picture about the Ambient Air Quality status of the study areas. If all the pollutants exceeded the NAAQS then the air quality of the station could be referred to as 'objectionable' or 'unacceptable'. But this situation does not prevail in the study areas. Application of the air quality depreciation index to the observed data, however, clearly 'maps' this deterioration in the quality of air around these mining sites. Depreciation in air quality from the desired value of 0 is clearly apparent, as AQdep values at all the locations of the study area are less than -1.0. The deterioration in the Air Quality in the coal mining areas of Talcher Coalfields can be undoubtedly visualised in the Table 3. Depreciation in air quality from the most desired value of '0' is clearly apparent, as AQdep values at all the locations are less than -1.0. After assigning rank to the resulted depreciation values it was found that Ananta OCP (A3) had the highest depreciation value (-4.59) followed by Jagannath OCP (A4), Lingraj OCP(A1) and Bhubaneswari mines (A2) with depreciation values -4.50, -3.21 and -3.20, respectively. Among residential and other areas Dera chowk (A15) had higher depreciation value (-3.10) followed by Jagannathpur village (A13) with depreciation value 2.85.
(Jain et al., 1977) Figure 4. Value function curve for TSP × SO2 (Luhar & Khanna, 1988) In computing TWi, an importance weight between 1 to 5 is subjectively assigned to AWi, BPIWi and HWi (i.e. for the ith pollutant) by a team of assessors or experts. Least important assignment is 1 and most important marking is 5. The weights are then aggregated in accordance with equations (2) and (3). 2.0 Materials and methods The air quality depreciation index was applied to the set of data obtained from monitoring ambient air quality of some coal mining areas of Talcher coal field (Fig. 5) of MCL (Orissa). The Talcher Coalfields constitutes mostly the southeastern part of the Lower Gondwana Mahanadi Master Basin and occupies an area of over 1813 sq km. The coalfield is bounded by latitudes 20°50' N and 21°15' N and longitudes 84°09' E and 85°33' E. This basin mainly occupies the Brahmani River Valley. It covers parts of Dhenkanal and Angu1 districts along with a small portion of the adjoining Sambalpur District of Orissa. The main sources of air pollutants located in this region are Talcher Thermal Power Station (TTPS) and the extensive mining industries of MCL and other allied industries. Systematic air quality monitoring was carried out at twenty one sampling stations (Fig. 6) in the study area using Respirable Dust Samplers (Envirotech-make Model APM 460) with thermoelectrically cooled impinger attachment for gaseous sampling. 24-hourly ambient air samples were collected for SPM, PM10, SO2 and NOX. The http://www.americanscience.org/journals
[email protected].
109
Journal of American Science 2010;6(5)
Roy et al, Air quality depreciation index
This pointed out that mining premise was the most polluted area followed by traffic junction. The results also suggest that the Raghunathpur Village has the best air quality followed by TTPS Guest House Colony.
Figure 5. Location map of the study area. Table 1. Assignments and computation of composite weight for different pollutants Pollutants SPM SO2 NOx SPM X SO2
AWi (Range 1-5) 4 1 2 1
BPIWi (Range 1-5) 4 4 3 2
HWi (Range 1-5) 3 4 3 5 n
∑ TWi = 36 i=1
http://www.americanscience.org/journals
[email protected].
110
TWi
CWi
11 9 8 8
3.1 2.5 2.2 2.2
Journal of American Science 2010;6(5)
A1-Lingraj OCPa A5-Bharatpur Colony
Roy et al, Air quality depreciation index
A2- Bhubaneswari Mines A6-kalinga Township
A9-Raghunathpur village A13-Jagannathpur village A17-Kalamchui village
A10-Barasinghra village A14-Sharma chowk
A21-Mukundnali village
a
A18-Ekgharia village
A3-Ananta OCP
A4-Jagannath OCP
A7-Gopal Prasad village A11-Talcher guest house A15-Dera chowk
A8-Donnara village
A19-Ananta Guest House
A20-Rakash village
Open cast project
Air sampling stations Coalfield boundary Figure 6. Air quality sampling stations
http://www.americanscience.org/journals
[email protected].
111
A12-TTPS Residential area A16-Talbera village
Journal of American Science 2010;6(5)
Roy et al, Air quality depreciation index
Table 2. Ambient air quality monitoring results of MCL coal mines of Talcher coalfield Locations Lingraj OCP
Code
SPM1
TSP2
SO2
NOx
SPM3
TSP*SO2/ 100
A1
278.92
422.87
27.04
34.75
274.11
1.16
Bhubaneswari Mines
A2
233.58
324.87
28.29
35.71
227.93
0.93
Ananta OCP
A3
500.71
773.79
29.33
31.83
490.73
2.31
Jagannath OCP
A4
440.79
639.29
31.0
36.0
434.29
2.03
Bharatpur Colony
A5
190.83
280.71
25.5
30.92
188.39
0.73
Kalinga village
A6
196.67
286.29
25.96
28.25
193.80
0.76
Gopalprasad village
A7
121.37
181
23.58
27.12
119.85
0.43
Utkal village
A8
118.62
176.21
21.21
23.46
117.21
0.38
Donnara
A9
177.25
268.13
19.91
26.62
166.86
0.55
Raghunathpur village
A10
109.42
165.08
24.33
27.79
105.20
0.41
Barasingra village
A11
193.92
286
22.45
31.75
192.97
0.65
TTPS Guest House
A12
117.58
178.96
25.37
27.79
116.08
0.45
TTPS residential
A13
129.37
195.46
26.95
29.37
125.27
0.53
Jagannathpur village
A14
224.75
330.12
25.83
31.71
212.01
0.86
Sharma Chawk
A15
152.46
237.29
28.08
31.17
144.56
0.67
Dera Chawk
A16
287.83
437.58
37.58
38.08
280.92
1.68
Talbera village
A17
126.75
183.67
20.66
24.83
126.00
0.38
Kalamchui village
A18
141.12
206.37
23.63
25.92
136.35
0.48
Ekghari village
A19
149.5
212.83
23.54
26.42
144.9
0.50
Ananta Guest House
A20
148.46
213.12
26.75
28.37
140.74
0.57
Rakash village
A21
153.29
221.25
25.33
25.17
139.95
0.60
A22 120.21 170.62 24.66 29.25 117.16 NAAQS 500 800 120 120 Arithmetic Mean Value of annual air quality monitoring results Total Suspended Particulate (Sum of preceding two columns) Geometric Mean Value of annual air quality monitoring results National Ambient Air Quality Standards.
0.42
Mukundnali village 4
1 2 3 4
http://www.americanscience.org/journals
[email protected].
112
Journal of American Science 2010;6(5)
Roy et al, Air quality depreciation index
Table 3. Value functions and AQdep values for different sampling locations of Talcher coalfield
A1 A2 A3 A4 A5 A6 A7 A8 A9 A10 A11 A12 A13 A14 A15 A16 A17 A18 A19 A20 A21
SPM 0.15 0.19 0.01 0.04 0.23 0.24 0.47 0.29 0.52 0.26 0.5 0.44 0.24 0.38 0.14 0.44 0.42 0.38 0.4 0.4 0.48
SO2 0.98 0.981 0.98 0.972 0.992 0.99 0.998 0.99 0.99 0.992 0.999 0.98 0.99 0.998 0.991 0.99 0.99 0.992 0.99 0.992 0.99
NOx 0.9 0.899 0.93 0.898 0.91 0.921 0.948 0.932 0.95 0.928 0.945 0.933 0.918 0.941 0.928 0.938 0.93 0.927 0.93 0.939 0.921
TSP×SO2 0.699 0.56 1.386 1.22 0.436 0.456 0.259 0.332 0.249 0.391 0.273 0.319 0.518 0.406 1.01 0.228 0.286 0.3 0.342 0.362 0.25
The air quality of Raghunathpur Village may be considered as the background status of Air Quality Depreciation as this location is free from any major air pollution sources. While comparing with the Air Quality Depreciation Index data of other mining sites reported in other studies, it was found that index calculated was quite high as compared to other mining areas. In a study, Jharia was found to have the most degraded air quality status having index value upto -7.8 followed by Korba coalfield with a index value upto -5.94 (Singh, 2006). The highest index was calculated for the Raniganj coalfield with the index upto -3.31. So it can be inferred that the Talcher coal mine areas has a better air quality as compared to other mining areas.
AQdep
6.787 6.977 5.407 5.498 7.175 7.397 8.106 7.448 8.223 7.308 8.063 7.789 7.153 7.957 6.905 8.339 8.241 8.124 7.975 7.941 8.189
-3.21 -3.02 -4.59 -4.50 -2.83 -2.60 -1.89 -2.55 -1.78 -2.70 -1.94 -2.21 -2.85 -2.04 -3.10 -1.66 -1.76 -1.88 -2.03 -2.06 -1.81
Rank 3 5 1 2 7 9 16 10 19 8 15 11 6 13 4 21 20 17 14 12 18
potential for environmental damages. We believe that adoption of such an index to monitor air quality at all the mining locations in India will help mutual comparisons in a much more realistic and meaningful manner. This work is just a step in this direction. Since the air quality depreciation index is neither geographically specific nor constrained for the type or number of pollutants, it can be easily used for different situations and applications. Acknowledgement Financial supports carrying out this study by Indian School of Mines University, Dhanbad and State Pollution Control Board (SPCB), Orissa are gratefully acknowledged. The authors are thankful to director of Indian School of Mines University for providing necessary institutional facilities and permitting to publish this paper. Thanks are also due to Regional State Pollution Control Board (Angul) and SPCB (Orissa) for providing necessary support and facilities during field survey.
4.0 Conclusions The application of the proposed Air Quality Depreciation Index has shown that the index allows for more realistic air quality assessment as compared to interpretive evaluations that revolve around comparing observed concentrations to national ambient air quality standards. The Air Quality Depreciation index can be an invaluable tool to map periodic deterioration in air quality with respect to its http://www.americanscience.org/journals
[email protected].
Weighted AQi
Corresponding Author: Ms. Papiye Roy Department of Environmental Science and Engineering, 113
Journal of American Science 2010;6(5)
Roy et al, Air quality depreciation index
Indian School Mines, Dhanbad, Jharkhand-826004.
[email protected] References 1. Babcock LR. A combined index for measurement of air pollution. J. Air Pollu. Control Assoc. 1970: 20 (10); 653-659. 2. Dee N, Baker J, et al. An Environmental evaluation system for water resource planning. Water Resources Research 1973; 9 (3): 523535. 3. Jain RK, Urban LV, Stacey GS. Environmental Impact analysis. Van Nustrand Reinhold, N.Y. 1977; 170-187. 4. Luhar AK, Khanna P. Computer aided rapid environmental impact assessment. Env. Impact Assess Rev. 1988; 8: 9-25. 5. Ricci Paolo F. A comparision of air quality indices for 26 Canadian cities. J. Air Pollu. Control Assoc. 1979; 29 (12): 1242-1243. 6. Sharma PK, Singh G. Assessment of ambient air quality in Tilaboni, Nakrakonda and Jhanjra Block of Raniganj Coalfields. Int. J. Env. Protec. 1990;10 (2): 105-112. 7. Sharma PK, Singh G. Distribution of suspended particulate matter with trace element composition and apportionment of possible sources in the Raniganj Coalfields, India. Env. Monit. Asses. 1992; 22: 237-244. 8. Singh G. An index to measure depreciation in air quality in some coal mining areas of Korba industrial belt of Chhattisgarh, India. Env. Monit. Asses. 2006;122: 309-317. 9. Singh, G. and Puri, S. K. (). Air Quality assessment in Korba Coalfield. Indian Journal of Air Pollution Control. 2004; 4(2): 31-41. 10. Singh G, Sharma PK. Ambient air quality status in certain coal mining areas of Raniganj coalfield. Energy Environment Monitor. 1991; 7(2): 56-65. 14/10/2009
http://www.americanscience.org/journals
[email protected].
114