Air Pollution, Climate Change and Health
Dr Clare Heaviside Air Pollution and Climate Change Group Centre for Radiation, Chemical and Environmental Hazards
National Air Quality Strategy Regulated Pollutants Particles (PM10 and PM2.5) Nitrogen dioxide
Ozone Sulphur dioxide PAH (B[a]P)
Benzene 1,3-Butadiene Carbon monoxide Lead
Recent trends for the UK
Defra Air Quality Statistics in the UK, 1987 to 2013
Pollutant Sources NO2 - mainly from road traffic, also electricity generation and industry (higher in cities) PM10 and PM2.5 - have many sources, particularly from road traffic and industry. Primary sources from combustion, or secondary sources from chemical reactions. Natural sources are sea spray or dust. O3 - a secondary pollutant, no single source, so prediction and regulation is difficult. Heavily influenced by meteorology (higher in rural and suburban areas)
Health Effects of Air Pollution • Acute (e.g. respiratory symptoms) or chronic (e.g. lung cancer) effects • Vulnerable populations: elderly, very young, people with pre-existing disease (e.g. cardiovascular or asthma)
Mortality Hospital Admissions Emergency Room Visits General Physician Visits
Medication Use Symptoms Impaired Pulmonary Function Sub-clinical Effects
Population Affected
Committee on the Medical Effects of Air Pollutants COMEAP estimated the mortality burden of human-made particulate pollution in UK in 2008 as: • an effect equivalent to approximately 29,000 deaths • a loss of 340,000 years of life • average loss of 6 months of life expectancy from birth
(2010) http://comeap.org.uk/
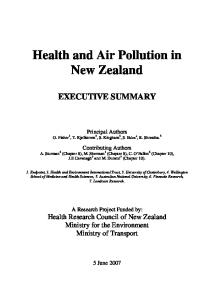
Local Mortality associated with PM2.5 • Attributable percentage: UK: 5.3 % England: 5.6 % • Attributable deaths: UK: 29,000 England: 25,000 • Years of life lost: UK: 307,000 England: 265,000 Guidance on estimating mortality attributable PM2.5 at Local Authority level
(Gowers et al. 2014)
Annual mean PM2.5 μg/m3 (2010)
Percentage of mortality attributable to anthropogenic PM2.5
Fraction of mortality attributable to particulate air pollution
2012
Climate Change and Health
Ozone is highly influenced by the weather Ground level ozone formation can be controlled by: temperature, humidity, winds, sunlight and land surface type Peaks in ozone often coincide with heatwaves, due to increased sunlight and light winds. Ozone levels are sensitive to climate change as well as man-made emissions. Climate projections for the UK: • Increased annual mean temperature of 2-5oC in the UK by 2080 (medium emissions)
of up to
NASA
• Increased frequency of heatwaves
max temp
• Temperatures reached 38.5oC in Kent in Aug 2003 • >2000 excess deaths in the UK • Estimates that between 21 and 38% of the excess deaths were due to the elevated ozone and particulate levels Stedman (2004)
2003 mortality min temp Baseline mortality
Daily mortality, London, aged >75yrs
- ozone - PM10
Johnson et al (2004)
Ground level ozone Change in ozone for +5oC temperature change (2003 emissions)
Change in ozone for 2030 for medium emissions scenario (cf 2003)
Effect of modelled 5oC temperature increase is smaller than impact of emissions changes, although both indicate increased ozone concentrations Heal et al. (2013)
13
ppb
Short lived climate pollutants (SLCPs) Limiting CO2 is necessary to stabilise global temperatures in the long term. However, efforts to address climate change should also focus on pollutants which remain in the atmosphere for much shorter periods SLCPs affect health as well as climate change so reduction has a double benefit
Short lived climate pollutants (SLCPs)
Climate and Clean Air Coalition
SLCPs: Black carbon Black carbon is a constituent of PM, emitted from gas and diesel engines and fossil fuel burning Climate effects: • Short lived, but with a large effect on climate, changes in rain and cloud patterns • Deposits in the arctic decrease the Earth’s ability to reflect sunlight, absorb heat, and accelerate melting Health effects: Respiratory, cardiovascular disease, and cancer. Reductions in BC can be expected to bring climate and health benefits within the short term (decades).
Air Pollution and Climate Change Need to be treated together Win-win: active travel, urban greening
Lose-win: wood burning, diesel cars? Maximise public health co-benefits e.g. local air quality, physical activity and climate change mitigation Avoid potential trade-offs e.g. energy efficiency and indoor air quality in homes
(IGBP and IGAC 2012)
Public Health England’s Air Pollution Objective • Develop a programme in support of national and local government to reduce 25,000 deaths each year in England attributable to air pollution • The new public health arrangements for England provide an opportunity to join up national-level research and advice on air pollution & climate change with local-level influencing and action
Conclusions There are many interactions between air pollution and climate change Climate change may exacerbate air pollution such as ground level ozone in future The links between climate and air pollutants means that reducing GHGs can also help reduce health impacts: • There could be considerable health benefits for reducing levels of SLCPs such as black carbon • Policies such as promoting active travel and urban greening can have environmental and health benefits
• However, we should be careful to anticipate potential unintended harmful effects of ‘green’ policies, e.g. transport or housing.
Acknowledgements PHE Air Pollution and Climate Change Group University of Edinburgh COMEAP (and Ozone working group)