Agro-ecological aspects when applying the remaining products from agricultural biogas processes as fertilizer in crop production Dissertation Zur Erlangung des akademischen Grades doctor rerum agriculturarum (Dr. rer. agr.)
eingereicht an der Landwirtschaftlich- Gärtnerische Fakultät der Humboldt-Universität zu Berlin von Diplom Biologin M. Sc. ENVIROFOOD Gabriela Bermejo Domínguez Präsident der Humboldt-Universität zu Berlin: Prof. Dr. Jan-Hendrik Olbertz Dekan der Landwirtschaftlich-Gärtnerischen Fakultät: Prof. Dr. Dr. h.c. Frank Ellmer Gutachter: 1. Prof. Dr. Dr. h.c. Frank Ellmer 2. Prof. Dr. Christoph Engels 3. Prof. Dr. Liliane Rueß
Tag der mündlichen Prüfung: 11.06.2012
Abstract With the increase of biogas production in recent years, the amount of digestates or the remaining residues increased accordingly. Every year in Germany more than 50 million tons of digestates are produced, which are used as fertilizer. Thus nutrients return into the circulation of agricultural ecosystems. However, the agro-ecological effects have not been deeply researched until now. For this reason, the following parameters were quantified: the influence of dry and liquid fermentation products on the yield of three selected crops in comparison to or in combination with mineral-N-fertilizers in on-farm experiments; the growth, development and yield of two selected crops in comparison to mineral-N-fertilizer, liquid manure and farmyard manure in a randomized complete block design; selected soil organisms as compared to mineral-N-fertilizer, liquid manure and farmyard manure in a randomized complete block design. In addition, the mineralization of dry and wet digestates in comparison with liquid manure and farmyard manure was investigated in order to evaluate the effects of different fertilizers on the humus formation under controlled conditions. The 2-year results of on-farm experiments showed that for a sandy soil, the combination of digestates in autumn and mineral-N-fertilizer in spring for winter crops (wheat, rye and rape) brought the highest yields. The wet digestate achieved the highest dry-matter yield as the only fertilizer for maize in spring. In a clayey soil, the use of 150 kg ha-1 N mineral-Nfertilizer brought the highest grain yield. These results were similar to the ones obtained by the application of dry digestates, if they were applied in two doses. Maize showed no significant differences between the dry-matter yields of the different treatments. The results in the field experiments from 2009 to 2011 showed that the effect of digestates on the yield of winter wheat and Sorghum sudanense was up to 15 % lower than the effect of the mineral-N-fertilizer. There were no negative effects from both digestates on the population of earthworms one month after the application. The enchytraeid populations were negatively influenced by wet digestate, liquid manure and mineral-N-fertilizer on the short term. This effect was reversed seven months after application. Under controlled conditions, the results from 2010 and 2011 showed that due to the CO2 exhalation curve and the lignin content, the liquid manure and wet digestate seem to be the most stable fertilizers with regards to the humus reproduction in the soil. However, further studies should be done to quantify the effect of digestates under an agroecological more reliable view.
II
Zusammenfassung Durch die Zunahme der Biogasproduktion in den letzten Jahren hat sich auch die Menge von Gärprodukten, die verbleibenden Rückstände, entsprechend erhöht. In Deutschland fallen jährlich mehr als 50 Millionen Tonnen Gärprodukte an, die als Dünger verwendet werden. Damit werden Nährstoffe in den Kreislauf landwirtschaftlicher Ökosysteme zurückgeführt. Allerdings sind die agroökologischen Wirkungen noch nicht hinreichend erforscht. Aus diesem Grund wurden die folgenden Parameter untersucht: Einfluss von trockenen und flüssigen Gärprodukten auf dem Ertrag von drei ausgewählten Fruchtarten im Vergleich zu oder in Kombination mit Mineraldünger in On-Farm Versuchen; Wachstum, Entwicklung und Ertrag von zwei ausgewählten Fruchtarten im Vergleich zu Mineraldünger, Gülle und Stallmist in einer vollständig randomisierten Blockanlage; Einfluss auf ausgewählte Bodenlebewesen im Vergleich zu Mineraldünger, Gülle und Stallmist in einer vollständig randomisierten Blockanlage. Zusätzlich wurde die Mineralisierung von flüssigen und festen Gärprodukten im Vergleich zu Gülle und Stallmist untersucht, um Effekte der verschiedenen Düngestoffe auf die Humusbildung unter kontrollierten Bedingungen zu bestimmen. Die Ergebnisse der 2-jährigen On-Farm-Versuche zeigten, dass auf sandigen Böden die Kombination von Gärprodukten im Herbst und Mineraldünger im Frühjahr für die Fruchtarten der Winterung die besten Ernteresultate erzielte (Weizen, Roggen und Raps). Das flüssige Gärprodukt als alleiniger Dünger für Mais im Frühjahr erbrachte vergleichbare Ergebnisse wie Mineraldünger. Auf einen tonigen Boden erbrachte die Anwendung von 150 kg ha-1 N Mineraldünger den höchsten Winterweizen-Kornertrag. Vergleichbare Ergebnisse wurden bei der Anwendung von trockenen Gärprodukten erzielt, wenn sie ebenfalls in zwei Gaben ausgebracht wurden. Silomais zeigte keine deutlichen Unterschiede zwischen dem Trockenmasseertrag der verschiedenen Prüfglieder. Im Feldversuch zeigten die Ergebnisse von 2009 bis 2011, dass die Wirkung der Gärprodukte auf den Ertrag von Sorghum sudanense und Winterweizen in der Regel bis zu 15 % niedriger war, als die Wirkung des Mineraldüngers. Die Gärprodukte hatten keine negativen Auswirkungen auf die Populationen von Regenwürmern einen Monat nach der Ausbringung. Die enchytraeidenpopulationen wurden durch flüssige Gärprodukte, Gülle und Mineral-N-Dünger kurzfristig negativ beeinflusst. Dieser Effekt kehrte sich sieben Monate nach der Anwendung wieder um. Unter kontrollierten Bedingungen zeigten die Ergebnisse von 2010 und 2011, dass aufgrund der CO2-Exhalationskurve und der Lignin-Gehalte Stallmist und flüssiges Gärprodukt die stabilsten Düngestoffe mit Blick auf die Humusreproduktion im Boden zu sein scheinen. Allerdings müssen weitere Studien gemacht werden, um die Wirkung der Gärprodukte unter agroökologischer Sicht sicherer zu quantifizieren.
III
Key Words: Biogas, Digestates, Agro-ecosystem, Crop production, Soil biota Schlagwörter: Biogas, Gärprodukte, Agrarökosystem, Pflanzenbau, Bodenlebewesen
IV
Table of Content Abstract ................................................................................................................................ II List of Figures ................................................................................................................... VII List of Tables ...................................................................................................................... IX 1 Literature Review ............................................................................................................. 2 1.1 Biogas market development in recent years and outlook ............................................ 2 1.2 Anaerobic digestion processes and biogas production ................................................ 4 1.3 Digestates: remaining products from agricultural biogas production ............................ 6 1.4 Agronomic aspects when applying digestates as fertilizers ......................................... 7 2 Aim of the Study .............................................................................................................. 9 3 Chapter 1: Digestates from the agricultural anaerobic digestion process as fertilizers on selected plants in on-farm experiments ................................................. 11 3.1 Introduction ............................................................................................................... 11 3.2 Material and Methods................................................................................................ 12 3.2.1 Field site description ...................................................................................... 12 3.2.2 Management practices .................................................................................. 14 3.2.3 Dry-matter yield, grain yield, yield formation and crop quality ........................ 19 3.2.4 Statistics ........................................................................................................ 20 3.3 Results ...................................................................................................................... 20 3.3.1 Friedersdorf location ...................................................................................... 20 3.3.2 Trebbin location ............................................................................................. 21 3.4 Discussion ................................................................................................................ 23 3.5 Conclusions .............................................................................................................. 28 4 Chapter 2: Effects of digestates and other fertilizers on selected plants in a randomized complete block design ............................................................................. 30 4.1 Introduction ............................................................................................................... 30 4.2 Material and Methods................................................................................................ 31 4.2.1 Field site description ...................................................................................... 31 4.2.2 Experimental design and assessment parameters ......................................... 33 4.2.3 Plant Growth and Development ..................................................................... 36 4.2.4 Dry-matter yield, grain yield, yield formation and crop quality ........................ 38 4.2.5 Statistic .......................................................................................................... 39 4.3 Results ...................................................................................................................... 39 4.3.1 Sorghum bicolor var. sudanense ................................................................... 39 4.3.2 Winter wheat ................................................................................................. 42
V
4.4 Discussion ................................................................................................................ 48 4.5 Conclusions .............................................................................................................. 51 5 Chapter 3: Impact of digestates and other fertilizers on the soil biota in a randomized complete block design ............................................................................. 53 5.1 Introduction ............................................................................................................... 53 5.2 Material and Methods ............................................................................................... 55 5.2.1 Experimental design and soil parameters ...................................................... 55 5.2.2 Determination of the soil biota ....................................................................... 55 5.2.3 Statistics ........................................................................................................ 60 5.3 Results ..................................................................................................................... 60 5.3.1 Field experiments with earthworms ............................................................... 60 5.3.2 Field experiments with enchytraeids .............................................................. 62 5.3.3 Experiments in the laboratory ........................................................................ 63 5.4 Discussion ................................................................................................................ 65 5.5 Conclusion ................................................................................................................ 68 6 Chapter 4: Influence of digestates from agricultural biogas production and organic fertilizers on the humus formation ............................................................................... 71 6.1 Introduction ............................................................................................................... 71 6.2 Material and Methods ............................................................................................... 72 6.2.1 Experimental Greenhouse design ................................................................. 72 6.2.2 Measurements of CO2 efflux from soil surface ............................................... 73 6.2.3 Analysis of the soil and organic fertilizers ...................................................... 74 6.2.4 Soil biological activity .................................................................................... 76 6.2.5 Statistics ........................................................................................................ 76 6.3 Results ..................................................................................................................... 77 6.4 Discussion ................................................................................................................ 83 6.5 Conclusion ................................................................................................................ 86 7 General discussion ....................................................................................................... 88 8 Conclusions ................................................................................................................... 92
VI
List of Figures Figure 1: Development in the number and electrical installed capacity of biogas plants in Germany ............................................................................................................................ 3 Figure 2: Phases of the anaerobic digestion process .......................................................... 6 Figure 3: Total precipitation and average air temperature from 2009-2010 at the Friedersdorf location. ......................................................................................................... 13 Figure 4: Total precipitation and average air temperature from 2009-2010 in comparison to the mean over the last 30 years at the Thyrow experimental station.................................. 14 Figure 5: Winter wheat experimental field plots in Friedersdorf.......................................... 16 Figure 6: Monthly values, total precipitation and average air temperature from 2009-2011 at the experimental station in Berlin-Dahlem ......................................................................... 32 Figure 7: Randomized complete block design on the experimental fields in Berlin-Dahlem .......................................................................................................................................... 33 Figure 8: Daily precipitation and air temperature from August in 2010 at the experimental fields in Berlin-Dahlem....................................................................................................... 37 Figure 9: Plant height development of Sorghum sudanense during 2009 and 2010. ......... 39 Figure 10: Leave Area Index (LAI) development by Sorghum sudanense during 2009. ..... 40 Figure 11: Development of the green color of the youngest leaf by Sorghum sudanense during 2009 and 2010. ...................................................................................................... 41 Figure 12: Dry-matter yield (dt ha-1) of Sorghum sudanense (2009-2010) ......................... 42 Figure 13: Plant height development by winter wheat during 2010 and 2011. ................... 43 Figure 14: Leave Area Index development by winter wheat during 2010 and 2011. .......... 44 Figure 15: Development of the green color of the youngest leaf by winter wheat during 2010 and 2011 ........................................................................................................................... 45 Figure 16: Grain yield (dt ha-1) of winter wheat (2010-2011) .............................................. 46 Figure 17: Example of division of one of the treatments on the experimental field in Berlin Dahlem. ............................................................................................................................. 56 Figure 18: O'Connor method ............................................................................................. 57 Figure 19: Avoidance test. ................................................................................................. 57 Figure 20: Example of a vessel divided into 6 chambers. .................................................. 58 Figure 21: Scheme of avoidance response test ................................................................ 59
VII
Figure 22: Development of the abundance of enchytraeids during 2010-2011. ..................62 Figure 23: Abundance of earthworms after the avoidance test 2 ........................................64 Figure 24: Abundance of enchytraeids after the avoidance test with 2 chambers...............65 Figure 25: Conceptual model of soil organic matter ...........................................................71 Figure 26: Environmental Gas Monitor (EGM-4). ...............................................................74 Figure 27: Bait laminas used as bioindicators for the biological activity. .............................76 Figure 28: 100 days of decomposition process during 2010. ..............................................77 Figure 29: 100 days of decomposition process during 2011. ..............................................78 Figure 30: Ammonia content in the different treatments during the decomposition process in 2011. ..................................................................................................................................79 Figure 31: Nitrate content in the different treatments during the decomposition process in 2011. ..................................................................................................................................79 Figure 32: C/N ratio of the different treatments during the decomposition period of the organic matter in 2010 and 2011. .......................................................................................80 Figure 33: Percentage of mineralized carbon of the organic fertilizers (%). ........................81 Figure 34: Percentage of biological activity in the different treatments in 2010. ..................82 Figure 35: Percentage of biological activity in the different treatments in 2011. ..................82 Figure 36: Summary of the aspects investigated in this study. ...........................................88
VIII
List of Tables Table 1: Chemical parameters from soil samples from the Friedersdorf location collected before the fertilization of the field. ...................................................................................... 15 Table 2: Experimental fields in Friedersdorf. Different combination of dry digestate (DD) and calcium ammonium nitrate (CAN) applied to winter wheat and silage maize. .................... 16 Table 3: Chemical parameters of soil samples from the Trebbin location collected before the fertilization of the fields.. .............................................................................................. 17 Table 4: Experimental fields in Trebbin. Different combinations of wet digestate (WD) and calcium ammonium nitrate (CAN) by winter wheat, applied at two different dates. ............ 18 Table 5: Yield Parameters of winter wheat at the Friedersdorf location ............................. 20 Table 6: Dry-matter yield (dt ha-1 DM) of silage maize at the Friedersdorf location ............ 21 Table 7: Yield Parameters of winter rye at the Trebbin location ......................................... 22 Table 8: Grain yield (dt ha-1 91 % DM) and thousand kernel weight (g) of winter oilseed rape at the Trebbin location ....................................................................................................... 23 Table 9: Dry-matter yield (dt ha-1 DM) of silage maize at the Trebbin location ................... 23 Table 10: Soil Texture at the experimental field in Berlin Dahlem. ..................................... 32 Table 11: Crop sequences corresponding to the experiment 1 and 2. ............................... 33 Table 12: Soil chemical properties 1) before and 2) after the winter wheat vegetative period corresponding to the experiment 1 and 2. ......................................................................... 34 Table 13: Soil chemical properties 1) one month after the fertilization of the experiment 2 and 2) after vegetative period corresponding to winter wheat. ........................................... 34 Table 14: Chemical and physical parameters of the applied fertilizers ............................... 35 Table 15: Application rates (kg ha-1 FW) of the different fertilizers depending on their amount of nitrogen. ........................................................................................................... 36 Table 16: Soil-Air temperature, precipitation and solar radiation during the germination, growth and development of Sorghum sudanense and winter wheat .................................. 38 Table 17: External and internal quality parameters of winter wheat.. ................................. 47 Table 18: Experiment 1: Quantity of fertilizer per vessel and chamber and equivalent quantity to be applied in the field (kg ha-1 N). ..................................................................... 58 Table 19: Experiment 2: Quantity of fertilizer per chamber and equivalent amount of fertilizer to be applied in the field (kg ha-1 N). ..................................................................... 59 Table 20: Enchytraeid experiment. .................................................................................... 60
IX
Table 21: Experimental field 1, 2009. Abundance (Individuals m-2) and Biomass (g m-2) of earthworms one month after application of 120 kg ha-1 N in various organic fertilizer treatments and an untreated control. ..................................................................................61 Table 22: Experimental field 2, 2010. Abundance (Individuals m-2) and Biomass (g m-2) of earthworms one month after application of 120 kg ha-1 N in various organic fertilizer treatments and an untreated control. ..................................................................................61 Table 23: Pearson correlation coefficient (r) between soil chemical parameters and the abundance of echytraeids and earthworms in the experimental field 2. ..............................63 Table 24: Abundance of earthworms after the avoidance test ............................................64 Table 25: Soil chemical parameters corresponding to 2010 and 2011................................72 Table 26: Chemical parameters of the organic fertilizers corresponding to 2011. ...............73 Table 27: Hemicelullose, celullose and lignin content of the different organic fertilizers in 2011. ..................................................................................................................................78 Table 28: Pearson correlation coefficient (r) between the exhaled CO2, total organic carbon (TOC), hot water extractable carbon (HWSC), ph, nitrate (NO3--N), ammonia (NH4+-N) and C/N ratio.............................................................................................................................81
X
Literature Review
1
1
Literature Review
1.1
Biogas market development in recent years and outlook
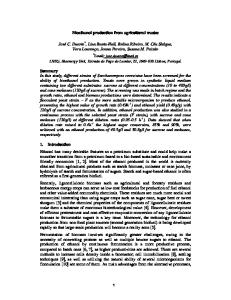
A new era is upon us for energy and the environment in the European Union. Strategies like the reduction of the dependency on imported energy, the improvement of the security of its supply, the reduction of greenhouse-gas emissions, the increase of renewable energy usage and the improvement of energy efficiency, are on the forward-looking political agenda by 2020 (BOSCH et al., 2009). Renewable energy is already seen as one of the short-term and medium-term options for mitigating greenhouse-gas (GHG) emissions and replacing fossil fuels. This is certainly evident in Europe, where a variety of activities and programs for developing and encouraging renewable energies have been implemented, both at European (European Commission – EC) and national level. Basically, every country in Europe has included renewable energy in its energy and climate policies (FAAIJ, 2006). In Germany, the main sources of renewable energy in 2010 were wind, which produced 36.5 billion kilowatts hour (KWh); hydropower, which produced 19.7 billion KWh; biomass, which produced 33.5 billion KWh; photovoltaic, which produced 12.2 billion KWh; and geothermal, which produced < 0.1 billion KWh. Biogas, as part of biomass energy, produced 12.8 billion KWh (BÖHME et al., 2010). In Europe, biogas production comes from three main sources: landfills, sewage sludge and others such as decentralized agricultural plants. However, Germany has opted to develop agricultural anaerobic digestion plants by encouraging the planting of energy crops. As a result of this strategy, Germany is the leading European biogas producer, alone accounting for half of Europe’s primary energy output (50.5 % in 2009) and half of its biogas-sourced electricity output (49.9 % in 2009) (Eurobserver, 2010). According to the German Agency for Renewable Resources (Fachagentur für Nachwachsende Rohstoffe), in Germany over 5,900 biogas plants are currently operating with a total electrical capacity of approximately 2,300 megawatts (MW) (Figure 1). The steady increase in crop digesters in Germany can be directly attributed to a favorable supportive national legal framework coupled with the tariffs paid for renewable energy. Staggered feed-in tariffs (which depend on the electrical power capacity of the biogas plants) are guaranteed for the entire depreciation period of the investment (Murphy et al., 2011). The electricity generation from biogas in 2010 was about 12.8 billion kWh, equivalent to about 2.1 % of the total electricity consumption in Germany, or about 12.6 % of the electricity supply from renewable energies.
2
Installed Electric Pow er (MW)
Num ber of Biogas Plants
3.500 3.000 2.500
247
2001
2002
2003
2004
3891
3000 2000 1000
0
Number of Biogas Plants
6000
4000
650
1760 190
1608 160
500
1360 111
1.000
2680 2010
3711
1377
1.500
1100
3500
1271
2.000
7000
5000
1893
4984
2291
5905
2728
7000
2005
2006
Installed Electric Power
2007
2008
2009
2010
2011 *
0
*Prognosis
Figure 1: Development in the number and electrical installed capacity of biogas plants in Germany (FNR, 2011).
Biogas can not only be used for power generation, but also for admixing products (in blends with natural gas) or for transport application as biofuel (HERR et al., 2010). The concept of biogas production by digestion and its subsequent conversion into electricity in combined heat and power (CHP) plants or feeding as biogas into the gas networks is an essential contribution to utilizing biowaste from households, communities and agriculture (GRAAF & FENDLER, 2010). The German market for the feed-in of biogas into the grid is still young. The first two biogas plants were put into operation at the end of 2006. In 2007, five more plants were opened. Around 30 plants had been connected to the network by the end of 2009. By the end of 2010, more than 70 plants were expected to be feeding into the German gas grid with a total hourly feed-in capacity of 54,000 cubic meters of biogas. With the plants that were presumably installed by the end of 2010, almost 4.2 billion kilowatt hours of biogas could be generated and fed-in. This amount suffices to cover the final energy demand for heating and hot water of 215,000 four-person households with a yearly consumption of 20,000 kilowatt hours of natural gas each. Biogas can also be used as a substitute for natural gas for natural-gas-powered vehicles. By means of gas-grid feed-in, the gas can be distributed around the German gas-station network and be a substitute for fossil fuels. (HERR et al., 2010).
3
1.2
Anaerobic digestion processes and biogas production
Numerous plant species and plant residues have been tested for their methane potential. In principal, many varieties of grass, clover, cereals and maize, including whole plants, as well as rape and sunflower have proved feasible for methane production. Hemp, flax, nettles, potatoes, beets, kale, turnip, rhubarb and artichokes have all been tested successfully. These crop materials can be used directly as input material for the anaerobic digestion process after the harvest, or can be stored in silage clamps. There are two types of anaerobic digestion processes depending on the type of processed material. The most common is the co-digestion process in which crops are combined with manure or other liquid substances to promote homogeneous or stable conditions. The second and less common way to produce biogas is mono-digestion, in which only crops are used as input material for biogas production. In this type of digestion process, the recirculation of the digestate is required in order to maintain homogeneous as well as buffered digester conditions. In 2004 and 2009, an evaluation of the German biogas plants was carried out. It was observed that most plants used manure-based substrate mixtures, with a range of crops including maize, grass and cereals. Food and vegetable wastes, potato-processing residues, whey and fat-trap contents were also used as co-substrates with liquid manure. In the 2004 study, manure was the dominant substrate (75-100 %) in nearly 50 % of the plants considered. About 83 % of these German agricultural biogas plants operated with a mixture of crops and manure; 15 % used crops only and just 2 % were operated with manure only. Nearly 90 % operated with wet-digestion technology while the remainder used dry digestion (MURPHY et al., 2011). Anaerobic digestion processes can be also termed “wet” or “dry” depending on the total solids concentration of the substrate. If the concentration is less than 15 % the anaerobic digestion is defined as wet, and if the concentration reaches 20-40 % it is defined as dry (NAYONO, 2010). Depending on the temperature there are two main digestion processes: thermophilic which ranges from 35 to 45 ° C and mesophilic which ranges from 45 to 65 ° C (HAKE, 2004). In the thermophilic range, decomposition and biogas production occur more rapidly than in the mesophilic range. However, the process is highly sensitive to disturbances, such as changes in feed materials or temperature. While all anaerobic digesters reduce the viability of weed seeds and disease-producing (pathogenic) organisms, the higher temperatures of thermophilic digestion result in more complete destruction (TILAK & DEY, 2010). Digesters can be designed for batch feeding or continuous feeding. In batch digesters, a full charge of raw material is placed into the digester which is then sealed off and left to ferment as long as gas is produced. When gas production has ceased, the digester is emptied and refilled with a new batch of raw material (TILAK & DEY, 2010). With
4
continuous-load digesters the raw material enters the digester continuosly and an equal amount of digested material is removed (NAYONO, 2010). Digestion systems can also be configured with different levels of complexity depending on the number of stages of fermentation. In a single-stage process the digestion occurs simultaneously in a single reactor, whereas in a two- or multi-stage reactor the reaction takes places sequentially in at least two reactors. Both, the two- and multi-stage system allow the intermediate steps of the anaerobic digestion to be controlled and investigated. Otherwise, the one-step system due to its simple design suffers less frequent technical failures and has lower investment costs (MATA-ALVAREZ, 2003). The residence time of the feed material in the digester depends on the amount and type of the input material, the configuration of the digestion system and whether it has one or two stages (MANDAN & MANDAN, 2009). Normally the time of residence in a mesophilic digestion is between 15 and 30 days. The thermophilic digestion needs a residence time of 12 to 14 days (ARVANITOYANNIS, 2008). Anaerobic digestion (AD) is a biological process that happens naturally when bacteria breaks down organic matter in the absence of oxygen. The main products of the process are carbon dioxide and methane, but minor quantities of nitrogen, hydrogen, ammonia and hydrogen sulphide are also generated. As a result of the removal of carbon, organic bound minerals and salts are released in their soluble inorganic form (AHRING, 2003). The main steps in the anaerobic digestion process are: – Hidrolysis, in which complex insoluble organic polymers such as carbohydrates, cellulose, proteins and fats are broken down and liquified by eytracelullar enzymes produced by hydrolytic bacterias. Proteins are converted into amino acids, fats into long-chain fatty acids and carbohydrates into simple sugars (EVANS, 2001). – Acidogenesis, in which facultative anaerobic and hydrogen-producing acidogenic bacterias convert the simple organic material via oxidation/reduction reactions into intermediate products, generally acetic acid and a small proportion of organic volatile fatty acids (porpionic, butiric and valeric acids) hydrogen, carbon dioxide (MARKANDEY & RAJVAIDYA, 2004), alcohol and acetic acid (W ATTER, 2009). – Acetogenesis in which the fatty acids are converted into acetate, hydrogen and carbon dioxide via acetogenic dehydrogenation by obligate hydrogen-producing bacteria and, – Methanogenesis in which the acetate and hydrogen plus the carbon dioxide are converted by methane-producing bacteria into methane, carbon dioxide, water and remaining products or by-products (MARKANDEY & RAJVAIDYA, 2004) (Figure 2).
5
Large Insoluble Polymers Large Insoluble Polymers Polysaccharides Lipids Proteins HYDROLISIS by hydrolytic bacteria Soluble Organic Compounds - Monosaccharide - Fatty acids /glycerine - Amino acids ACIDOGENESIS by acidogenic bacteria By products - Organic fatty acids - Carbon dioxide (CO2) - Hydrogen (H2) - Alcohols - Acetic acid ACETOGENESIS by acetogenic bacteria Acetate, H2, CO2 METHANOGENESIS by methanogenic bacteria
BIOGAS - Methane (CH4) - Carbon dioxide (CO2)
DIGESTATE
WATER
Figure 2: Phases of the anaerobic digestion process (own illustration).
Besides the variety of possible applications of biogas like heat and electricity generation, fuel for cars and feeding into natural grids, the produced biogas can be stored for later use according to fluctuation demands (KARAGIANNIDIS, 2012). 1.3
Digestates: remaining products from agricultural biogas production
The by-product of the anaerobic digestion is termed “digestate” and consists of raw organic material that cannot be used by microorganisms and water. It also consists of the mineralised remains of the dead bacteria from within the digesters (MANDAN & MANDAN, 2009). More than 90 % of nutrients entering anaerobic digesters are retained within the digestate, which can therefore be used as soil conditioner (OECD, 2010). Digestate typically contains elements such as lignin that cannot be broken down by the anaerobic
6
microorganisms (MANDAN & MANDAN, 2009). Due to the reduction of organic matter also a part of the organically bound nitrogen is mineralized. This results in a higher amount of ammonium than in other conventional organic fertilizers like cattle manure (ROSCHKE & PLÖCHL, 2006). During the fermentation process, the organic dry matter is decomposed into methane (CH4) and carbon dioxide (CO2); the carbon content in the digestate is reduced and this consequently results in a narrowing of the C/N ratio (LEITHOLD, 2010). The reduction of the organic dry matter depends on the duration and intensity of the fermentation and also on the composition of the starting material (BRENNER, 2008). A typical organic dry-matter content of 50-60 % is often seen in manure-based systems. In the case of digestates, the organic dry-matter content is normally 40-50 % primarily in the form of fibers (AHRING, 2003). The anaerobic digestion results in an increase in pH in the digestate in comparison to the original material (BRENNER, 2008; CLEMENS et al., 2001). This is presumaby due to the production of amonium (SCOTTISH EXECUTIVE ENVIRONMENT AND RURAL AFFAIRS, 2007). The pH value of the digestates is higher than that of liquid manure and farmyard manure. A comparative measurement over a twenty-week period of one digester biogas plant in Germany yielded an average of 0.45 pH units higher pH of the digestate in comparison to fresh manure (BERENDONK, 2011). Phosphorus, potassium and magnesium do not undergo extreme change during the fermentation process. As with nitrogen, some of the phosphorus is also converted into an inorganic form or a readily available form for the plants. Potassium and magnesium contents do not suffer significant changes during the fermentation process (FNR, 2004). 1.4
Agronomic aspects when applying digestates as fertilizers
The digestates produced by most operational plants are destined for use as soil conditioner or fertilizer. They demonstrate a useable nutrient level, both in terms of concentration and in a form which makes them available for plant uptake. Consequently, the use of digestates results in a reduced requirement for mineral fertilizers (EVANS, 2001) and therefore lower fertilizer investment costs. However, digestates have characteristics that are specific to each digester tank. These characteristics can vary between batches from the same digester and even within the same batch of digestate, following storage (LUKEHURST et al., 2010), so a continuous monitorization of digestates before the application is required (MÖLLER, et al., 2009). According to the German Fertilizer Ordinance (DüMG 1977, § 3 No. 1 and 2), organic fertilizers can be authorized in the market only if they are used properly and they do not cause harm to the soil fertility, the health of humans, domestic animals and crops and do not compromise the balance in the ecosystem. According to the German Fertilizer 7
Ordinance, organic fertilizers are “…liquid manure, farmyard manure, straw and similar byproducts from agricultural production, and further treated, which promote growth, increase the yield and improve the quality of plants". Most digestates in Germany are a typical form of further by-products from agricultural production, so they are included in the fertilizer legislation (DITTRICH, 2011). According to the German Fertilizer Regulation (DüV) before applying any fertilizer the analysis of available nutrients in the soil and in the applied fertilizer is recommended. The soil conditions at the time of application should be taken into account. The application of fertilizer when the soil is flooded, saturated, frozen or has more than a 5 cm layer of snow is forbidden. The maximum amount of applied organic fertilizer is 170 kg N ha-1 per year, with a maximum permissible excess of 60 kg N ha-1 per year and 20 kg ha-1 P2O5 per year (only if the P content in the soil is