Advantages of the Biotech Industry in Taiwan I. Top 10 reasons to invest in the biotech industry in Taiwan (1) Located between Japan, Korea and the Southeast Countries and across the Taiwan Strait from Mainland China, Taiwan, with its unique geographic, economic and strategic position, is the best entry point for western enterprises to enter the Asia market (2) Well-developed supply chain ensures that there will be no material shortage from the upstream suppliers (3) The Biotech industry, as an emphasized mainstream industry, is promoted by the Taiwan Government and is benefiting from government initiatives Promotion Plan for the Biotechnology Industry initiated by the Executive Yuan in 1995 and Taiwan Biotech Take-off Diamond Action Plan enforced in 2009 (4) Related quality regulations in the biotech industry are up to the international standards and products produced are approved by the international community (5) Industrial clusters of the biotech industry are formed in the northern, central and southern parts of Taiwan to maximize the cluster effects (6) The government has constructed relevant development platforms for the industry to engage in RD developments and provided subsidies (7) Abundant supplies of the talent pools ensure that HR requirements i n the industry can be met (8) The income tax is 17%, which is relatively lower than that in other countries (9) Incubation centers are founded by government research institutes and private foundations to house new ventures with know-how in certain technology fields (10) There are a lot of products and technologies breakthroughs in the industry (pharmeticual, medical device, emerging biotech) and most biosimilar and
new drugs are in their clinic phases now
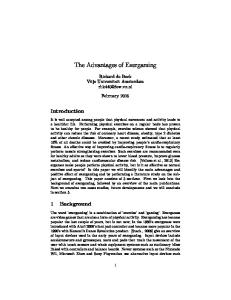
II. Introduction of Major Suppliers in the Biotech Industry in Taiwan Although the market size of the biotech industry is relatively small, its growing momentum is very strong. The total number of suppliers in the biotech industry has climbed to 1,505 in 2012, and for major suppliers in the industry, such as Scino Pharm, Excelsior Medical, China Chemical & Pharmaceutical, FORMOSA LABORATORIES, INC., Grape King Inc., Standard Chem&Pharm and so on, their 2012 revenue has exceeded NTD$2 billion, as shown in Table 11-1. Among other key suppliers, Scino Pharm focuses exclusively on providing high revitalization and purification ingredients to the niche markets. Product margins of all its products are more than 50% and its 2012 revenue even exceeded NTD$4.57 billion. Scino Pharm has registered more than 631DMFs as of 2012 in more than 60 countries in the world and in terms of the number of registered DMFs, Scino Pharm is far ahead of its competitors in the industry. YungShin Global Holding is a wholly owned subsidiary of Yung Shin Pharm IND after its share swap in January 2011, and its focus is on holding controls on all subsidiaries in the industry and for the purpose of professional specialization. Through offerings of seasoned equality and issuance of corporate bonds, Excelsior Medical has co-founded the Yujia Yiliao in Shanghai with Sinopharm in 2010 and Excelsior Asset Management in Taiwan in 2010. For all companies listed in Table 11-1, Scino Pharm, YungShin Global Holding, China Chemical & Pharmaceutical, FORMOSA
LABORATORIES,
INC.,
Standard
Chem&Pharm,
Sinphar
Pharmaceutical Co., Ltd, Chunghwa Chemical Synthesis & Biotech Co., Ltd, SCI Pharmtech, Inc. and PhytoHealth Corp. are representatives from the pharmaceutical industry; Excelsior Medical, Apex Biotechnology Corp, Bionime Corp are from the medical device industry; for the emerging biotech industry, the major companies include Grape King Inc., Abnova Corp and GenMont Biotect Inc.; as for Maywufa Company, it operated Borden Pharmacy, a pharmacy chain, to market its own
products and distribute medical products for other brands. Table 11-1
Major Suppliers in the Biotech Industry in Taiwan 2012Net
2011 Net
Revenue
Revenue
Revenue
(in NTD
(in NTD
Milion dollars)
Million dollars)
Growth Rate
4,572.20
3,948.46
15.80%
25.6
24.3
509.09
608.16
-16.29%
87.32
91.12
Excelsior Medical
3,116.54
3,158.00
-1.31%
8.85
10.57
China Chemical & Pharmaceutical
2,848.52
3,154.00
-9.69%
11.31
9.69
FORMOSA LABORATORIES, INC.
2,524.28
2,625.00
-3.84%
0.2
8.8
Grape King Inc.
2,884.68
2,401.00
20.14%
21.45
19.69
Standard Chem&Pharm
2,198.74
2,086.00
5.40%
12.34
11.82
Maywufa Company
2,102.61
2,229.00
-5.67%
2.84
1.88
Apex Biotechnology Corp.
2,026.09
1,876.00
8.00%
25.8
28.06
Sinphar Pharmaceutical Co., Ltd
1,777.53
1,581.00
12.43%
6.82
4.56
Chunghwa Chemical Synthesis & Biotech Co., Ltd
1,329.58
1,167.00
13.93%
13.2
14.64
Bionime Corp
1,336.86
1,364.00
-1.99%
2.55
13.12
SCI Pharmtech, Inc.
1,262.57
1,037.00
21.75%
15.4
8.67
Abnova Corp
463.77
472.00
-1.74%
16.57
25.36
GenMont Biotect Inc.
179.03
185.00
-3.23%
16.14
20.58
PhytoHealth Corp.
176.65
156.00
13.24%
-58.76
-108.56
Company
Scino Pharm YungShin Global Holding
2012
2011
Net Profit Net Profit Ratio Ratio
Source: Market Observation Post System; annual report from above companies IEK, ITRI
III. Because of the sharp increase in export in the medical device industry, the entire biotech industry in general is growing in trade size, and the trade deficit has narrowed over the years. In 2012, the total export of the biotech industry was NTD$84.1 billion, while imports reached NTD$184.5 billion and the demand in the domestic market was
NTD$340.7 billion. In 2012, the total export of the biotech industry rose to NTD$93.6 billion, or 11.30% growth from 2011 and this is due to the sharp increase in export in the medical device industry; the total imports in the biotech industry also grew to NTD$203.5billion, or 10.30% growth from 2011. Analyzed from the import and export statistics, it can be seen that although trade imbalance exists in the industry, the magnitude of trade deficit becomes gradually lower.
(I) Pharmaceutical Industry According to import and export statistics by Directorate General of Customs, Ministry of Finance, R.O.C., the export of western medicine in 2012 reached NTD$41.3 billion, or 4.09% growth from the 2011 figure, NTD$39.6 billion. For the top 10 exporting countries of western medicine in the world (as shown in Table 11-3), 8 of them are in Asia, indicating that Asian countries are still the major exporting countries for Taiwan. Australia is the largest exporting country for Taiwan and the export climbed from NTD$571 million in 2011 to NTD$1.99 billion in 2012 or 248.51% growth, reflecting the fact that Australia firms produce in Taiwan and export back to Australia. China and U.S. are the second and third largest exporting countries for Taiwan, revealing that the deployment effort of pharmaceutical manufacturers from Taiwan in the US is not without merit and they are harvesting now. Currently, the pharmaceutical industry is emphasizing generic drugs to improve the healing ability of the patients and still relies on other countries for new drugs that are more effective to cure diseases. As these drugs are very expensive, the total import is still growing. In 2012, total imports reached NTD$70.8 billion, or 5.86% from 2011. The top 10 drug importing countries are mostly the ones with strong drug development abilities, and among them, the US is the largest one with an import of NTD$10.9 billion.
Table 11-2
Top 10 Importing and Exporting Countries of the Pharmaceutical Industry in Taiwan from 2011~2012 Unit: in NTD$100 billion, % Export
Import
Rank
Growth Country
2011
2012
Growth Country
2011
2012
Rate
Rate
1
Australia
5.71
19.90
248.51
USA
108.95
124.40
14.18
2
China
14.65
16.30
11.26
Germany
79.46
90.27
13.60
3
USA
12.41
14.45
16.44
Switzerland
59.14
62.82
6.22
4
Japan
7.65
8.18
6.93
UK
51.87
53.83
3.83
5
Vietnam
6.55
6.13
-6.85
France
59.44
51.62
-13.16
6
Hong Kong
4.14
4.52
9.18
Italy
49.73
49.82
0.18
7
Malaysia
2.85
3.73
30.88
Ireland
39.93
48.20
20.71
8
South Korea
2.41
3.65
51.45
Japan
42.57
42.63
0.14
9
Singapore
2.70
2.75
1.85
Puerto Rico
24.07
31.49
30.83
10
Thailand
1.85
2.60
40.54
Australia
28.63
25.25
-11.81
Source: import and export statistics, Directorate General of Customs, 2013 Medical and Pharmaceutical Industry Technology and Development Center
(II) Medical Device Industry According to import and export statistics by Directorate General of Customs, Ministry of Finance, R.O.C., the export of medical devices reached NTD$41.2 billion in 2011 while imports reached NTD$55.1 billion. Although a trade deficit exists in the medical device industry, it has narrowed gradually as the export becomes higher than the import. Europe, the US and Japan are three major exporting markets for the medical device industry in Taiwan (as shown in Table 11-3), indicating that the qualities of medical devices manufactured in Taiwan are approved by these exporting countries and can meet drug review regulations befo re their market distribution.
Table 11-3
Top 10 Exporting Countries of the Medical Device Industry in Taiwan from 2010~2011 Unit: in NTD$1 Million, % 2010
Rank Country
2011
Export
% Total Export
Country
Export
% Total Export
1
USA
12,234
31
USA
12,199
30
2
Japan
4,346
11
Japan
5,080
12
3
China
2,502
6
China
2,709
7
4
Germany
2,345
6
Germany
2,190
5
5
UK
1,747
4
UK
1,914
5
6
Australia
1,114
3
Netherlands
1,187
3
7
Netherlands
1,046
3
Hong Kong
968
2
8
Hong Kong
980
2
Australia
917
2
9
South Korea
814
2
South Korea
841
2
10
France
629
2
Belgium
686
2
Source: 2012 Medical Devices Industry Yearbook; IEK
The top three importing countries in 2011 for the medical device industry in Taiwan were the US, Japan and Germany (as shown in Table 11-4) and their imports together made up 58% of total industrial imports. Among the three countries, the US is the largest one, but it has not been much change in import as a whole, indicating that the source of Taiwan import is highly concentrated, purchased items and products are very consistent, and overall market structure remains much the same.
Table 11-4
Top 10 Importing Countries of the Medical Device Industry in Taiwan from 2010~2011 Unit: in NTD$1 Million, % 2010
Rank
2011
Country
Import
% Total Import
Country
Import
% Total Import
1
USA
17,348
34
USA
18,846
34
2
Japan
7,304
14
Japan
7,267
13
3
Germany
5,859
12
Germany
5,855
11
4
China
4,472
9
China
5,026
9
5
Ireland
2,301
5
Ireland
2,369
4
6
UK
1,619
3
UK
2,117
4
7
Switzerland
1,531
3
Switzerland
1,641
3
8
South Korea
1,363
3
Thailand
1,433
3
9
France
1,363
3
France
1,405
3
10
Thailand
1,070
2
South Korea
1,341
2
Source: 2012 Medical Devices Industry Yearbook; IEK