Name _____________________
Class ______________
Date _________
Activity P36: Instantaneous Speed versus Average Speed (Photogates) Concept Linear motion
DataStudio P36 Average Speed.DS
Equipment Needed Photogate (CI-6838 or ME-9204) Dynamics Cart (w/ Track) Five Pattern Picket Fence (648-04704)
ScienceWorkshop (Mac) P03 Average Speed Qty 2 1 1
ScienceWorkshop (Win) P03_AVSP.SWS
Equipment Needed Meter stick Photogate Bracket (003-04662) 1.2 m Track System (ME-9429A)
Qty 1 2 1
What Do You Think?
If you are watching the Indianapolis 500 car race, which value will tell you who is winning: the average or instantaneous speed for each car? Which is more important for a car trying to set a speed record (to see how fast it can go)? Why? Take time to answer the ‘What Do You Think?’ question(s) in the Lab Report section. Background
An average speed can be a useful value. It‟s the ratio of the overall distance an object travels and the amount of time that the object travels. If you know you will average 50 miles per hour on a 200 mile trip, it‟s easy to predict how long the trip will take. On the other hand, the highway patrol office following you doesn‟t care about your average speed over 200 miles. The patrol officer wants to know how fast you‟re driving at the instant the radar strikes your car, so he or she can determine whether or not to give you a ticket. The officer wants to know your instantaneous speed. If you measure average speed of a moving object over smaller and smaller intervals of distance, the value of the average speed approaches the value of the object‟s instantaneous speed. SAFETY REMINDERS
Follow all directions for using the equipment.
Procedure
Use two Photogates to measure the amount of time it takes for an object to move a measured distance. Enter the measured distance into the computer. Use ScienceWorkshop or DataStudio to calculate the average speed based on the distance you enter, and the time that is measured. Then change the distance over which the object‟s motion is measured and repeat the process.
P36
© 1999 PASCO scientific
p. 1
Physics Labs with Computers, Vol. 2 P36: Instantaneous Speed and Average Speed
Student Workbook 012-07001A
PART I: Computer Setup
1.
Connect the ScienceWorkshop interface to the computer, turn on the interface, and turn on the computer.
2.
Connect one Photogate‟s stereo phone plug to Digital Channel 1 on the interface. Connect the second Photogate‟s stereo phone plug to Digital Channel 2.
3.
Open the file titled as shown: DataStudio P36 Average Speed.DS
ScienceWorkshop (Mac) P03 Average Speed
ScienceWorkshop (Win) P03_AVSP.SWS
•
The DataStudio file has a Graph display of Average Speed vs. Distance and a Workbook display. Read the instructions in the Workbook. Timing is set to „Time Between Gates‟.
•
The ScienceWorkshop document has a Graph display and a Table display of Average Speed vs. Distance.
PART II: Sensor Calibration and Equipment Setup
•
You do not need to calibrate the Photogate.
1.
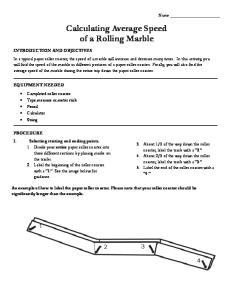
Place the Dynamics Track on a table. Raise one end of the track a few centimeters.
2.
Mark a point at the center of the track with a pencil, and record the point as “X1” in the Data Table.
3.
Choose another point near the top end of the track as the starting point for the dynamics cart, and mark the point with a pencil as “X0”.
4.
Place the Photogate connected to Digital Channel 1 (“Gate 1”) at the top end of the track 40 cm away from the X1 point. Place the Photogate connected to Digital Channel 2 (“Gate 2”) at the bottom end of the track 40 cm away from the X1 point.
5.
Place the “five-pattern picket fence” into the accessory tray on the top of the dynamics cart. Place the picket fence so that one of the solid bands will block the Photogate beam as the cart moves down the track.
6.
Put the cart on track. Adjust the height of both Photogates so that the photogate beams are blocked when the cart and picket fence move down the track.
p. 2
© 1999 PASCO scientific
P36
Name _____________________
Class ______________
Date _________
Preparing to Record Data
•
Before recording any data for later analysis, you should experiment with the Photogate, cart, and picket fence. Put the cart at the starting point on the track.
•
Start recording data. (Hint: In DataStudio, click „Start‟. In ScienceWorkshop, click „REC‟. In DataStudio, the „Start‟ button changes to a „Keep‟ button ( ). In ScienceWorkshop, the „Keyboard Sampling‟ window opens.)
•
Release the cart so it moves down the track. Timing begins when the Photogate beam is first blocked.
•
After the cart moves through the second Photogate, enter the distance between the Photogates as your first Distance value. (Hint: In DataStudio, click „Keep‟. In the ScienceWorkshop „Keyboard Sampling‟ window, type „0.80‟ and click „Enter‟.)
•
Stop recording. The data will appear as „Run #1‟.
•
Erase your trial run of data. Select „Run #1‟and press the „Delete‟ key.
PART III: Data Recording
1.
Make sure that the overall distance “D” between the centers of the two Photogates is the first value shown in the Distance Table. Trial
Distance “D” (m)
1
0.80
2
0.70
3
0.60
4
0.50
5
0.40
6
0.30
7
0.20
8
0.10
2.
Place the cart at the starting point on the track.
3.
Start recording data. (In DataStudio, click „Start‟. In ScienceWorkshop, click „REC‟.)
4.
Release the cart so it moves down the track. Timing begins when the Photogate beam is first blocked.
5.
After the cart moves through the second Photogate, enter the distance between the Photogates as your first Distance value.
•
In DataStudio, click „Keep‟ to enter the first value for distance. (The file includes the default values for distance shown above.)
P36
© 1999 PASCO scientific
p. 3
Physics Labs with Computers, Vol. 2 P36: Instantaneous Speed and Average Speed
•
Student Workbook 012-07001A
In the ScienceWorkshop „Keyboard Sampling‟ window, type „0.80‟ and click „Enter‟. The entered value will appear in the window.
‘Average Speed’ is automatically calculated based on the ‘Distance’ value and the ‘Time Between Gates’.
p. 4
© 1999 PASCO scientific
P36
Name _____________________
Class ______________
Date _________
6.
Move the two Photogates closer to the midpoint X1 by 5 cm for each Photogate. (For the second trial, the overall distance between the Photogates is 0.70 m.)
•
Make sure that each Photogate is the same distance from the midpoint X1!
7.
Repeat the data recording process. Place the cart at the starting point at the top of the track. Release the cart. Enter the Distance value.
•
In DataStudio, click „Keep‟ to enter the next default value for distance. In ScienceWorkshop, enter „0.70‟ in the Keyboard Sampling window and click „Enter‟.
8.
For each new trial, continue to decrease the distance between Photogates by 10 cm (or 5 cm for each Photogate.) Make sure the Photogates are equidistant from the midpoint X1. Record data as described above. (Stop when the Photogates are 10 centimeters apart.)
9.
End data recording. (In DataStudio, click the „Stop‟ button ( ). In ScienceWorkshop, click „Stop Sampling‟ in the Keyboard Sampling window.)
•
The data will appear as „Run #1‟.
Analyzing the Data
1.
Rescale your Average Speed vs. Distance plot so the data fills the window.
2.
Find the slope and „Y Intercept‟ of the best-fit line through your data.
•
In DataStudio, click „Fit‟ ( ) in the Graph toolbar and select „Linear‟. The „Y Intercept‟ appears in the „Linear Fit‟ window.
•
In ScienceWorkshop, click „Statistics‟ (
) to open the statistics area. In the statistics
area, click the „Statistics Menu‟ button ( ) and select „Curve Fit, Linear Fit‟. The coefficient „a1‟ in the statistics area is the „Y Intercept‟. Use your results to answer the questions in the Lab Report section.
P36
© 1999 PASCO scientific
p. 5
Physics Labs with Computers, Vol. 2 P36: Instantaneous Speed and Average Speed
Student Workbook 012-07001A
Lab Report - Activity P36: Instantaneous Speed and Average Speed What Do You Think?
If you are watching the Indianapolis 500 car race, which value will tell you who is winning: the average or instantaneous speed for each car? Which is more important for a car trying to set a speed record (to see how fast it can go)? Why?
Data Table
Y Intercept
m/s
Questions
1.
What is the relationship between the „Y Intercept‟ on the Graph and the instantaneous speed of the cart as it moved through the midpoint X1?
2.
Which of the average speeds that you measured do you think gives the closest approximation to the instantaneous speed of the cart as it moved through the midpoint X1?
3.
What factors (accuracy of timing, object being timed, release of object, type of motion) influence the results? Discuss how each factor influences the result.
4.
Are there ways to measure instantaneous speed directly, or is instantaneous speed always a value that must be derived from average speed measurements?
p. 6
© 1999 PASCO scientific
P36
Name _____________________
P36
Class ______________
© 1999 PASCO scientific
Date _________
p. 7