Active
performance measures
TRANSPORTATION
TABLE
Of Contents
Introduction APPLYING ACTIVE TRANSPORTATION PERFORMANCE MEASURES RECOMMENDED MEASURES AND METRICS
Recommended Measures & Metrics HEALTH & SAFETY . . . . . . . . . . . . . . . . . . . . . . . . . . . . . . . . . . . . . . . . 6
Collisions Personal Security Public Health MULTIMODAL. . . . . . . . . . . . . . . . . . . . . . . . . . . . . . . . . . . . . . . . . . . 12
Network Quality Transit Access Facility Use EQUITY. . . . . . . . . . . . . . . . . . . . . . . . . . . . . . . . . . . . . . . . . . . . . . . . 18
Coverage ADA Access EDUCATION. . . . . . . . . . . . . . . . . . . . . . . . . . . . . . . . . . . . . . . . . . . . 22
Programs Key Staff Information Design and Layout by Fehr & Peers
ACCESS . . . . . . . . . . . . . . . . . . . . . . . . . . . . . . . . . . . . . . . . . . . . . . . 28
100 Pringle Avenue, Suite 600
INFRASTRUCTURE. . . . . . . . . . . . . . . . . . . . . . . . . . . . . . . . . . . . . . . . 32
Walnut Creek, CA 94596 Main: 925-977-3200 Fax: 925-933-8007 www.fehrandpeers.com
Built Environment Connectivity Street Network Maintenance Network Quality Financial Investment Supportive Facilities ECONOMIC DEVELOPMENT. . . . . . . . . . . . . . . . . . . . . . . . . . . . . . . 40
ALL RIGHTS RESERVED Copyright ©2015 Fehr & Peers No portion of this report may be used or reproduced without prior written consent of Fehr & Peers.
Sales Property Value Societal Costs and Benefits PLACEMAKING . . . . . . . . . . . . . . . . . . . . . . . . . . . . . . . . . . . . . . . . . 46
Public Arts and Events Community Investment Landscaping
table of contents
WHY ACTIVE TRANSPORTATION PERFORMANCE MEASURES
Active Transportation Performance Measures
Active Transportation Performance Measures Active transportation performance measures enable comprehensive evaluations of walking and biking projects based on quantitative data. The Active Transportation Performance Measures User Guide were developed to identify best practices in estimating and applying active transportation performance measures in transportation plans and studies. The Bicycle and Pedestrian Disciple Group at Fehr & Peers developed an Active Transportation Performance Measures Guide to identify best practices in estimating and applying active transportation performance measures. The goal of the Guide is to help transportation planning and engineering professionals select and evaluate appropriate performance measures to track the success of their bicycle and pedestrian projects and articulate the benefits of active transportation projects to skeptical funders or elected officials. The current focus on quantitative measurement of active transportation projects is fairly new, and resources and standards available for this type of assessment are less established than those for vehicles. The Guide provides a comprehensive look at meaningful performance measures for biking and walking and recommendations for how to apply them.
Why Active Transportation Performance Measures? Planning and designing for pedestrians and bicyclists increasingly requires performance measures to help prioritize projects, evaluate appropriate facility types, and track project progress over time. Today, limited and varied guidance is available at a local and national level on what active transportation performance measures to use and how and when to apply them. Meaningful and context-sensitive performance measures dedicated to bicycling and walking are valuable for many reasons, including: �D �emonstrating the value of pedestrian and bicycle projects to citizens and elected officials racking the success of an active �T � transportation program, policy, or facility nforming smarter investment through I�� data-driven measures of success �C �omplying with federal, state, and MPO funding requirements �P �roducing a better built environment for walking and bicycling �P �roviding information to engage a broad set of stakeholders in project and program identification and prioritization C ��apturing the value of new and innovative datasets and data collection methods for the active transportation field
Active transportation performance measures are important for assessing the current state of bicycling and walking conditions and for tracking the change of these conditions over time. They can help a jurisdiction set quantifiable goals for bicycling and walking, guide a jurisdiction on how to achieve these goals, and help document when the goals have been met. Through the use of active transportation performance measures, a jurisdiction can evaluate and adopt customized policies and plans to implement projects that enhance active transportation safety, mobility, equity, and accessibility.
Applying Active Transportation Performance Measures Performance measures for biking and walking can be applied to a number of different project types including master plans, corridor studies, safety studies, transit studies, Safe Routes to School plans, facility designs and before/after studies. The type of performance measure, its geographic scale and the means for quantifying it will vary based on the nature of the plan, the plan’s context and the data available. For example, to measure the success of a wayfinding program included in a countywide plan, the extrapolation of bicycle volumes based on spot counts may be most appropriate. On the other hand, the success of a new bicycle facility on a downtown roadway may be best quantified through turning movement counts conducted at every intersection along the corridor.
Active Transportation Performance Measures
We identified eight categories, or goals, for describing active transportation performance measures: health and safety, multimodal, equity, education, access, infrastructure and placemaking.
Economic Development performance measures characterize the influence of active transportation on local and regional economic performance. They can be evaluated through sales records, property values and societal costs/benefits.
M et ri
mance Meas fr or ur Pe
c
GOAL fo
r
e
er
c
Placemaking performance measures capture the sense of place created through art, landscaping and public amenities. They can include the number of public art and community events, the quality and quantity of landscaping, the presence of wayfinding, and the amount of other investments in the community.
ric et M
P
E �ducation performance measures examine the effectiveness of active transportation programs in reaching a broad and diverse audience. These measures can be evaluated based on the number of available active transportation programs, participation in these programs, and level of staff training. They can also be assessed through their success at effecting change, such as shifting mode splits towards more walking and bicycling.
Performance measures are grouped into the eight goals based on the lens through which they assess a project or plan. A given performance measure can be evaluated or represented in multiple ways, using quantifiable metrics. The metrics chosen to evaluate a performance measure will depend on the data available, the scale of the study area, and the goals of a project. The hierarchical structure from goal to performance measure to metric is shown in the flow chart below.
e
E � � quity performance measures evaluate the fair distribution of active transportation improvements and funding. They can be measured by the geographic diversity of the areas covered by a project, relative investment in Communities of Concern, or a project’s compliance with ADA requirements.
Infrastructure performance measures are broad in nature and evaluate the quantity and quality of active transportation facilities. They include bicycle and pedestrian enhancements on the street network, the quality of those enhancements measured through user comfort, the provision of supporting facilities such as short term bicycle parking, the level of financial investment, and the requirements of maintenance.
M et ri
� �Multimodal performance measures quantify and compare the quality of travel experience across all modes. They include travel time, delay, network connectivity, and multimodal access.
Access performance measures reflect the character of the built environment within a project area and the connectivity of its active transportation network. They can be evaluated by intersection density, trail connections and gap closures.
rm
ance
a Me
su
ric et M
� �Health and Safety performance measures look at the impact of a project on the well-being and safety of network users. Safety can be measured by objective metrics like number of collisions, crime rate and number of on-duty police officers. They can also be estimated using proxy variables such as driver yield rates at pedestrian crossings or evaluated through surveys that capture user perceptions of safety and personal security. Public health may be measured by individual activity levels or air quality.
Recommended Measures and Metrics The eight performance measure goals are discussed in detail in the following sections. Each goal contains a description, a summary table of applicable performance measures and metrics, methods of evaluation for each performance measure, relevant applications, and case studies.
Active Transportation Performance Measures
Health and Safety
The following table summarizes performance measures and metrics used to assess the health and safety success of success of active transportation projects. Performance Measures and Metrics for Health and Safety GOAL
PERFORMANCE MEASURE
METRIC Number of Collisions Average Daily Traffic (ADT)
Collisions
85th Percentile Speed Conflict Points Between Pedestrians/Bicycles and Vehicles Perceived Safety Crime Rate
Health and Safety
Lighting Quality Personal Security
Illegal Graffiti Enforcement Perceived Security Individual Activity Levels Calories Burned
Public Health
Air Quality Index Emergency Response Time Environmentally Conscious Design Noise Pollution
health and safety
Healthy and safe travel for all users is a fundamental goal in any transportation plan or study. Safety-related performance measures track collisions and personal security, evaluating both actual and perceived risk levels. Public health performance measures cover personal well-being, overall quality of the surrounding environment, and efficiency of emergency response.
Active Transportation Performance Measures
Section 1:
|
HEALTH & SAFETY:
Collisions
Projects may aim to reduce the occurrence and severity of vehicle-pedestrian and vehiclebicyclist crashes. Progress towards this goal can be measured by tracking collisions and the details surrounding them, including where they occurred, when they occurred, who was involved, and what precipitating actions took
place. Collision performance measures can also evaluate the risk of future collisions on a roadway by evaluating surrounding built environment and traffic conditions. Finally, perceptions of safety can be measured based on a person’s fear of a collision on a roadway or documentation of “close calls”.
Methods of Evaluation Collision performance measures are often evaluated based on the observed reduction in the number of vehicle-pedestrian and vehicle-bicyclist collisions. Evaluation could focus on changes for specific crash groups, such as severe collisions involving death and serious injury or vulnerable population collisions involving children and seniors. Observed collision performance measures could also determine changes in collision exposure levels based on total population, total users, total travel distance, or total infrastructure miles. Observed collision data are collected by incident and can be aggregated to the intersection, block, corridor, or community-wide level. Most historic collision records are found in state or local police reports that document the parties involved, the movements that led to the collisions, and elements of the surrounding environment such as location, date, time, and weather. Anticipated collision risk or severity reduction is often evaluated based on vehicle volumes and speed, as well as the frequency with which a pedestrian or bicyclist would interact with the vehicles. Potential measures for a given roadway could include average daily traffic (ADT), posted speed limit, drivers’ compliance with the posted speed limit, the number of conflict points where vehicles would interact with people walking or bicycling, including intersections and mid-block crossings. Perceptions of safety measure how comfortable users of all ages and abilities feel on a roadway, and they can be evaluated through a user survey. Data on anticipated collision risk is often collected through vehicle counts and field observations. Field visits are also essential for conducting intercept surveys to measure user perceptions of safety. The Highway Safety Manual’s Crash Modification Factors can also rate the performance of various safety countermeasures.
HEALTH & SAFETY:
Personal Security Personal security is an important element of safety. Projects may aim to promote the use of a street or neighborhood by enhancing the actual and perceived level of personal security. Methods of Evaluation The most direct way to measure personal security is to total the number of crimes, both violent and non-violent, or the number of calls for service in a given area. Personal security can also be measured indirectly based on the use of adequate lighting that meets ADA/AASHTO standards and guidance, as well as by the amount of illegal graffiti. These elements strongly affect people’s perceptions of personal safety, which can be evaluated using a survey of visitors, residents, employees, or businesses. Personal safety data can be collected at the individual, corridor, or community-wide level. Crime rates and service calls can be collected from local enforcement agencies. The number of on-duty police officers active in an area is also available from the local police department. Field observations are often required to measure lighting, graffiti, and trash, as well as to conduct intercept surveys to gauge perceptions of personal security.
HEALTH & SAFETY
|
Page 8
Active Transportation Performance Measures
HEALTH & SAFETY:
Public Health Projects have the ability to influence public health outcomes through their effects on individual activity, the natural environment, emergency response and use of certain construction materials. Common performance measures evaluate whether transportation investments allow people to have healthier lifestyles through increased access to physical activity and reduced exposure to pollutants.
Section 1:
|
HEALTH & SAFETY
When to Consider Health & Safety Performance Measures Metrics measuring the health and safety impacts of bicycling and walking projects are applicable when conducting various types of plans or studies at multiple scales, including: �C �omprehensive, Master, or Subarea Plans
T � ransit Studies
C �orridor Studies
F� acility Design
S� afety Studies or Action Plans
��S� afe Routes to School B �efore & After
HEALTH & SAFETY:
Case Study Applications Methods of Evaluation Individual health performance measures often evaluate a person’s level of activity, such as minutes walking or bicycling per day, and the daily number of calories burned. Impacts on the natural environment are often measured based on air quality, or a project’s ability to minimize pollutant emissions such as diesel particulate matter, benzene, ground-level ozone, carbon monoxide, sulfur oxides, nitrogen oxides, and lead. The ability of emergency response teams to respond to an incident also impacts public health and can be measured by average emergency response times or travel time to health facilities. Health data can be collected at the personal or community-wide level, depending on the measure. To understand individual health, on-body devices can record the amount of time a person spends engaged in active movement and the number of calories burned. Individual activity levels can also be determined through household travel surveys or developed from community-wide data on mode share and commute patterns. Measures of air pollutants recorded in a given location have community-wide implications, but general air quality can also be measured at the individual level based on asthma diagnoses in the local population. The amount of environmentally sensitive materials that consider permeable surfaces and urban heat island effect can also be measured to indicate the short and long term environmental effects of a project. Emergency response data can be requested from the police, fire, and medical teams that serve the area. This will vary locally, but emergency services may have a threshold of being able cover a certain area in a set amount of time. GIS network analysis can be used to ensure that the proposed project meets the needs of emergency services.
Example applications of health and safety performance measures include the Great Rivers Greenway Gateway Bike Plan and San Francisco Bicycle Coalition Report Card. Great Rivers Greenway Gateway Bike Plan (St. Louis, MO)
The Gateway Bike Plan identifies a vision and proposed bicycle network as well as programmatic and policy recommendations for the greater St. Louis region. The final chapter of the plan titled “Performance Measures and Accountability” provides metrics to track and evaluate the plan’s implementation. One of two prioritized long-term performance measures is the ratio of reported crashes to bicycle trips. This is calculated by dividing the number of police-reported on-street bicycle collisions by recorded bicycle counts collected every other year. The plan recommends that jurisdictions set up a repository where crash data are sent and compiled. This metric allows the region to track its progress in increase bicycling while reducing collisions. San Francisco Bicycle Report Card (San Francisco, CA)
The San Francisco Bicycle Coalition conducted a widespread survey of bicyclists to compile a gazette of facts and figures on citywide bicycling. Two of the six categories of questions were based on safety and theft. In addition to collision data compiled from the San Francisco Municipal Transportation Agency, the survey asked respondents generally how safe bicyclists feel bicycling in the city, if they have been in a collision, their level of injury, and if they filed a police report. With regards to bicycle theft, respondents were asked if they have had a bicycle stolen in the past two years, if they reported the theft to the police, and if they got their bicycle back.
|
Page 10
Active Transportation Performance Measures
Multimodal
The following table summarizes performance measures and metrics used to assess the multimodal success of elements of active transportation projects.
Performance Measures and Metrics for Multimodal GOAL
PERFORMANCE MEASURE
METRIC User Delay
Network Quality
Travel Time Travel Time Reliability Transit Level of Service Proximity to Transit
Multimodal
Transit Access
Route Directions Station Quality User Counts
Facility Use
Facility Throughput Mode Split VMT Per Capita
table multimodal of contents
Pedestrian and bicycle networks function as pieces of the overall transportation network, and walking and bicycling often serve as one component of a larger multi-modal trip. Measuring how many people choose to walk and bicycle, and how these modes relate to the rest of the transportation network, are important elements of any transportation plan or study.
Active Transportation Performance Measures
Section 2:
|
MULTIMODAL
MULTIMODAL:
Transit Access Many pedestrians and bicyclists connect to public transit as part of their trips. Projects can improve transit accessibility and facility quality in support of longer multimodal trips for these users. Performance measures to evaluate a successful transit system for pedestrians and bicyclists measure access and amenities.
MULTIMODAL:
Network Quality The simple presence of a transportation facility does not guarantee that residents, employees, and visitors will utilize it. The service must be high quality, or of higher quality than the alternatives,
to attract users. Projects may aim to enhance the attractiveness of some modes over others, and performance measures can evaluate each mode’s relative quality of network and service.
Methods of Evaluation User delay, travel time, and travel time reliability assess differences in traveler convenience among various modes. User delay and travel time can be measured using Bluetooth data, INRIX, AVL for buses and crowdsourcing. The Fehr & Peers Reliability+ tool helps identify variations in travel time reliability. Jurisdictions will choose the optimal measurement tool based on their needs and available resources. Transit level of service reflects the comfort, safety and reliability of transit along a given corridor. It can be measured based on operational elements such as load factor and frequency, vehicle arterial level of service, and first mile/last mile accommodations.
Methods of Evaluation Transit access can be measured through the percentage of population living or working within ¼ mile of a transit stop and/or ½ mile of a transit station, as well as through the average distance a person must travel between stops. Route directness is another important access measure for walking and bicycling, since the convenience of transit depends on direct and safe connections between lines. Shelters, benches, and lighting at transit stops, as well as bike racks on transit vehicles and at transit stations, are key measures for a transit system that is friendly to pedestrians and bicyclists. The local transit agency may have standards or requirements for the number or types of amenities that should be present at each stop.
|
Page 14
Active Transportation Performance Measures
and user counts. This information is available from national data sources such as the American Community Survey and National Household Travel Survey, as well as local surveys.
Methods of Evaluation User counts, facility throughput, and mode split can be measured for trips across the entire population or broken down by specific factors, such as demographics, trip purpose, or time of day. Tracking counts, throughput and mode split provides a way to determine the growth of walking and bicycling in a community or on a corridor. The measures can also be used to generate system-wide vehicle, bicycle, or pedestrian miles traveled. Counting the number of pedestrians and bicyclists provides the most basic measure of how well the active transportation network is being utilized. There are many available methods for counting pedestrians and bicyclists, some manual and some automated, and they can focus on users at a single location, along a corridor, or across a study area.
When to Consider Multimodal Performance Measures Metrics measuring the multimodal network quality of projects are applicable when conducting various types of plans or studies at multiple scales, including:
C �orridor Studies �Safety Studies or Action Plans T � ransit Studies
MULTIMODAL
Case Study Applications
Facility Use
C �omprehensive, Master, or Subarea Plans
|
MULTIMODAL:
MULTIMODAL:
The characteristics of a person’s available transportation options have a large influence on the mode that person will choose for a given trip. To evaluate the use of pedestrian and bicycle networks, common measures include mode split
Section 2:
S� afe Routes to School F� acility Design B �efore & After
Example applications of multimodal performance measures include Performance Measures for the City of Los Angeles and the Seattle Bicycle Master Plan. Performance Measures for the City of Los Angeles (Los Angeles, CA)
The Los Angeles County Department of Public Health allocated funding for local cities to develop policies and plans to stimulate active transportation in their communities. The report establishes baseline conditions, including maps and summary statistics, for active transportation and proposes measures for tracking future progress in the City of Los Angeles. The report outlines metrics specific to transportation, including percentage of the population within a certain distance to bicycle facilities and transit service, as well as bicycle and pedestrian counts. The report shows both spatial and chart representations of the data for each metric in order to better guide the funding and prioritization of future projects. Seattle Bicycle Master Plan (Seattle, WA)
The Seattle Bicycle Master Plan includes a number of performance measures that are important in monitoring progress toward achieving the goals and objectives of the plan. The measures quantify the goals and objectives so that the City can assess and report improvement over time. One main goal for the plan is to increase bicycle use. The plan outlines two performance measures associated with this goal: number of bicyclists observed at specified count locations and bicycle mode split. The city identified 30 locations to perform bicycle counts every other year under similar conditions. This would provide enough data to develop a basic understanding of bicycle facilities and their usage trends. Mode split would be documented every five years through the Puget Sound Regional Travel Survey.
|
Page 16
Active Transportation Performance Measures
Equity Bicycle and pedestrian facilities provide affordable, healthy transportation solutions for communities, regardless of ethnicity, age or income. However, in some communities, access to transportation options is not equal across all populations. Transportation plans or studies often examine impacts on vulnerable communities and those typically underserved by transportation improvements. The following table summarizes performance measures and metrics used to assess the equity success of active transportation projects.
Performance Measures and Metrics for Equity GOAL
Equity
PERFORMANCE MEASURE
METRIC
Coverage
Meeting Travel Demand
ADA Access
Pedestrian Access Transit Access
equity
Active Transportation Performance Measures
EQUITY:
EQUITY:
Coverage performance measures provide a better understanding of a project’s impact on disadvantaged communities or other targeted populations, helping ensure that the project addresses residents with the highest active transportation travel needs.
The American Disabilities Act mandates that facilities provide safe and convenient access to persons with disabilities. Projects can be evaluated based on their ability to meet these requirements.
Coverage
Methods of Evaluation A project spanning a large area can measure the number of communities or council districts it serves with high needs or the percentage of the total project in these communities. Measures can also evaluate the percentage of a population a project may impact. For example, a bicycle master plan may measure the percentage of low-income population within ¼ mile of bicycle facilities. Demographic analysis, or how much of a given population would be impacted by a project, is useful in cases where a population has a disproportionate lack of access to bicycle or pedestrian infrastructure that the project would improve.
Tacoma. WA
ADA Access
Methods of Evaluation ADA-compliant pedestrian facilities include audible crossing warnings, truncated domes to indicate the transition from a sidewalk to a crosswalk, and setting standards for sidewalk and ramp construction. Sidewalk widths and curb ramps are the most common components of ADA compliance. Sidewalks are required to be at least 5-feet wide, and curb ramps should be surveyed for directionality, grade, flared sides, and detectable warnings. ADA requirements for the pedestrian realm are outlined in the ADA Best Practices Tool Kit for State and Local Governments, Chapter 6 (2007). http://www.ada.gov/ pcatoolkit/chap6toolkit.htm. Transit access can also be evaluated for ADA compliance. Requirements include boarding islands of sufficient width, lowfloor boarding vehicles or vehicle boarding ramps, and seating reserved for disabled riders.
Section 3:
When to Consider Equity Performance Measures Metrics measuring the equitable distribution of bicycling and walking enhancements are applicable when conducting various types of plans or studies at multiple scales, including: �C �omprehensive, Master, or Subarea �P �lans �C �orridor Studies �S� afety Studies or Action Plans
�T � ransit Studies �S� afe Routes to School �F� acility Design �B �efore & After
EQUITY:
Case Study Applications Example applications of equity performance measures include Tacoma’s Transportation Master Plan and Smart Growth America’s Evaluating Complete Streets Projects. City of Tacoma: Transportation Master Plan (Tacoma, WA)
The City of Tacoma Transportation Master Plan measured equity in terms of investment per community per mode. They used city and U.S. Census data to track their investments by local community needs. The goal of the performance measure is to support the build-out of a transportation network that is inclusive of all potential users regardless of race and income, as well as track investment by mode. Smart Growth America: Evaluating Complete Streets Projects
Many plans integrate equity as an element of health-related performance measures. These measures typically focus on access to public transportation and safety of existing active transportation, specifically in previously underserved communities. These measures relate the inequity of access to public transit with health related issues largely affecting these same communities. Health and equity are seen as crucial to successful transportation systems today.
|
EQUITY
|
Page 20
Active Transportation Performance Measures
Education
The following table summarizes performance measures and metrics used to assess the education success of active transportation projects.
Performance Measures and Metrics for Education GOAL
PERFORMANCE MEASURE Programs
Education
METRIC Program Availability Program Participation
Staff
Key Staff Training
Information
Outreach Extent
table ofeducation contents
Many jurisdictions have implemented educational programs to encourage their residents, workers and visitors to experience their communities on foot or by bicycle. Whether the programs help employees find ways to walk to transit or teach safe bicycling habits, educating people on their choices can provide confidence in trying walking and bicycling for new trips. Transportation plans and studies often include an education element, and performance measures help track the success of these education efforts.
Active Transportation Performance Measures
Section 4:
EDUCATION:
Programs
Maps and guides on walking and bicycling, either printed or shared online, are valuable resources that can be distributed outside of formal settings. The distribution of pedestrian and bicycle information is particularly important in communities with high levels of tourism or when preparing for a significant outreach effort.
EDUCATION:
Key Staff
The success of an educational campaign also depends on the number and quality of key staff trained in pedestrian and bicycle issues, rights and responsibilities. Staff members who regularly interface with community members can serve as excellent resources when trained in active transportation topics.
Methods of Evaluation Tracking the number of maps or guides distributed is common practice for jurisdictions that print their materials. For communities that post information on a website, tracking the number of downloads is another simple way to track the spread of supportive information for walking and bicycling.
Methods of Evaluation
fic
Stress Impa
When to Consider Education Performance Measures Metrics measuring biking and walking education are applicable when conducting various types of plans or studies at multiple scales, including: �C �omprehensive, Master, or Subarea Plans �C �orridor Studies �S� afety Studies or Action Plans �T � ransit Studies �S� afe Routes to School
ian and Bic r t es
list yc
The most direct way to evaluate staffing as a performance metric is to count the number of staff members who are trained in walking and bicycling issues. Staff who are specifically dedicated to walking and bicycling tasks as part of their job duties may be the most straightforward to tally, but keeping track of other staff who participate Metric Study in active transportation training opportunities is also important.
ct
Communities that require participation in CTR programs often track compliance by employer or neighborhood. Communities may also track the number of businesses that choose to participate in a CTR program without being required. The number of educational events and programs, such as ambassador programs, as well as the number of participants those events or programs generate, can indicate the success of educational efforts.
Information
Ped
Methods of Evaluation
EDUCATION
EDUCATION:
Tra f
National programs like Safe Routes to School teach children safe practices for walking or bicycling and provide safety resources to parents, schools, and officials. Some states or local jurisdictions also require large employers to participate in commute trip reduction (CTR) programs to reduce the number of employees driving alone to work. These efforts may be led by transportation management associations (TMAs) that do community outreach and education on transportation options. The success of a project can be measured by the availability of and participation in these programs.
|
�F� acility Design �B �efore & After
User Study
|
Page 24
Section 4:
|
EDUCATION:
Case Study Applications Example applications of education performance measures include the Great Rivers Greenway Gateway Bike Plan and the Seattle Bicycle Master Plan.
ater of Gre oalition ts Calendar C le c Bicy ven lphia E Philade
Great Rivers Greenway Gateway Bike Plan (St. Louis, MO)
The Gateway Bike Plan identifies a vision and proposed bicycle network as well as programmatic and policy recommendations for the greater St. Louis region. The final chapter of the plan titled “Performance Measures and Accountability” provides metrics to track and evaluate the plan’s implementation. The plan includes a large number
of measurable education goals including trainings for staff and the public, distribution of educational materials, up-to-date website, bike rodeos, workshops on design standards, driver education, and staff responsibility for programmatic implementation.
EDUCATION
Seattle, WA skyline
St. Louis Great Rivers Greenway Gateway Bike Plan
Active Transportation Performance Measures
Seattle Bicycle Master Plan (Seattle, WA)
The Seattle Bicycle Master Plan includes a number of performance measures that are important in monitoring progress toward achieving the goals and objectives of the plan. The measures quantify the goals and objectives so that the City can assess and report improvement over time. The number of participants in safety education programs or events is a strategic performance measure in the plan, designated as the responsibility of advocacy groups. The percentage of Seattle Department of Transportation (SDOT) staff who participate in trainings is another way the plan ensures that work is taking place at the leading edge of the field.
|
Page 26
Active Transportation Performance Measures
Access Implementing bicycle and pedestrian infrastructure can impact mobility, allowing people to access destinations safely and easily on bicycle or by foot. Transportation plans and studies may look to measure the impacts of its infrastructure projects on bicyclists and pedestrians. The following table summarizes performance measures and metrics used to assess the access success of active transportation projects. Performance Measures and Metrics for Access GOAL
PERFORMANCE MEASURE
METRIC Facilities For School Access
Built Environment
Land Uses Proximate to Facility Populations Proximate to Facility Walk Score or Bike Score Percentage of Network Constructed
Access
Intersection Density Connectivity
Facility Miles
First Mile/Last Mile Connection Trails Connection
access
Gap Closure
Active Transportation Performance Measures
ACCESS:
ACCESS:
The built environment has a large impact on people’s ability to access and use pedestrian and bicycle facilities. Facilities near schools, surrounded by dense and desirable land uses, surrounded by dense populations, and in generally more walkable or bikeable areas will be more successful.
New bicycle and pedestrian projects often contribute to an existing network of active transportation facilities and provide an important connection to goods, services, and key destinations. Common performance measures evaluate the extent of new facilities planned or constructed and the improved connections that
Built Environment
Connectivity
Section 5:
When to Consider Access Performance Measures Metrics measuring access via biking and walking are applicable when conducting various types of plans or studies at multiple scales, including: �C �omprehensive, Master, or Subarea Plans
�T � ransit Studies
�C �orridor Studies
�F� acility Design
�S� afety Studies or Action Plans
result from them. Methods of Evaluation Land uses greatly influence the demand for transportation projects, and this measure can be evaluated based on the percentage of key destinations such as schools, homes, commercial areas or transit stops within close proximity to the pedestrian or bicycle facility. Proximate populations are also key indicators of performance, such as the percentage of jobs or residents with easy access to the facility. Measures of an area’s walkability or bikeability include Walk Score and Bike Score, which quantify ease of access to nearby destinations on foot or bicycle. Built environment factors are regularly collected by the U.S. Census and compiled in databases such as EPA’s Smart Location Database. The data are typically available at the census block group level and block level, making local, corridor-level, community-wide or regional studies possible.
�S� afe Routes to School �B �efore & After
ACCESS:
Methods of Evaluation The number of miles of pedestrian and bicycle facilities, the number of intersections per square mile (intersection density), or the percentage of a planned network currently constructed help measure the level of connectivity of an existing active transportation network. Connectivity impacts of a project can be evaluated based on the extent to which new facilities close gaps in an existing network, accommodate first mile/last mile transit access, and provide links to existing trails or other signature facilities. Connectivity measures take into account existing versus planned bicycle and pedestrian networks and the configuration of the roadway and sidewalk networks. These measures can be evaluated at the local, corridor, community-wide, or regional level.
|
Case Study Applications Example applications of access performance measures include Smart Growth America’s Evaluating Complete Streets Projects and the Walk Score methodology. Smart Growth America: Evaluating Complete Streets Projects
The Smart Growth America report provides government agencies the support and resources to be able to provide performance metrics to support active transportation. The first goal in this report is access. One of the sub-categories of this goal is community connections, which measures the percentage of people living and destinations within close proximity to facilities or services. The report also cites examples that apply these metrics, including how Redmond, Washington measures network completeness. This report provides a number of other examples and definitions of performance measures that capture access. WalkScore
Walk Score is an online resource that calculates a score between 0 and 100 for a specific site, neighborhood, or community based on its walkability. Walkability is measured based on mix of destinations, proximity to destinations, population density, block length, and intersection density.
ACCESS
|
Page 30
Active Transportation Performance Measures
Infrastructure Tracking the quantity and quality of active transportation infrastructure within a study area can help quantify the success of a transportation plan or study in enhancing the area’s walkability and bikeability over time. Infrastructure performance measures evaluate street network facilities and the monetary and maintenance investments they require. The following table summarizes performance measures and metrics used to assess the infrastructure success of active transportation projects.
GOAL
PERFORMANCE MEASURE
METRIC Presence of Bicycle Facilities
Street Network
Presence of Pedestrian Facilities Distance Between Marked Crossings Bicycle Level of Traffic Stress (LTS)
Network Quality
Pedestrian Level of Service Pavement/Sidewalk/Crosswalk Quality Rating
Infrastructure
Supportive Facilities
Quantity of Supportive Bicycle Parking Use of Supportive Bicycle Parking Spending by Mode
Financial Investment
Cost Sharing Grant Applications for Active Transportation Projects Project Cost Maintenance Requests
Maintenance
Maintenance Projects Backlog
infrastructure
Performance Measures and Metrics for Infrastructure
Active Transportation Performance Measures
INFRASTRUCTURE:
INFRASTRUCTURE
Network Quality an intersection, and providing accommodations for bicyclists and pedestrians at intersections addresses a high priority safety need. More frequent marked crosswalks increase pedestrian compliance and increase convenient access to destinations for pedestrians.
Methods of Evaluation Facilities that accommodate bicyclists and pedestrians at intersections include, for example, bike boxes, bicycle push buttons, pedestrian push buttons, bicycle signal detectors, and high visibility markings. The percentage of intersections with bicycle and pedestrian facilities can be calculated through an inventory of where these facilities are present and where they are not present in the study area. Marked crosswalks are recommended where there is a demonstrated need for a crosswalk through high pedestrian volumes or a significant pedestrian desire line. Frequent applications include pedestrian generators such as midblock bus stops, transit stations, schools, parks, plazas, building entrances, and midblock passageways. Marked crosswalks are often recommended when the nearest marked crossing location is more than 300 feet away. An inventory of crosswalks along these corridors and the calculation of the average distance between them can help measure the pedestrianfriendliness of the street network. INFRASTRUCTURE:
Maintenance Effective infrastructure maintenance is an unglamorous yet essential element of successful projects. Maintenance ensures high pavement, painting and striping quality. Maintenance
|
INFRASTRUCTURE:
Street Network Bicycle and pedestrian accommodation on the street network can be measured through two main metrics: percentage of intersections with bicycle and/or pedestrian facilities and distance between marked crosswalks. Collisions between pedestrians/bicyclists and vehicles often occur at
Section 6:
performance measures track the quantity of maintenance work within a study area and the jurisdiction’s responsiveness to maintenance requests.
Methods of Evaluation Information on the number and character of local maintenance projects and maintenance requests, including Citizen Action Requests or ADA Grievances, is available through communication with local officials. Many communities have a 311 or 511 department that tracks maintenance requests and can make them publicly available.
Projects often aim to not only grow the amount of active transportation infrastructure on the street network but also improve the infrastructure quality. Bicycle and pedestrian facility quality can be quantified using Level of Traffic Stress (LTS) or Level of Service (LOS) measures. Methods of Evaluation Bicycle Level of Traffic Stress (LTS) indicates the level of bicyclist comfort on a street or facility. It is based on a number of factors including number of vehicle lanes, vehicle volume, vehicle speed, and bicycle facility type. There are generally four levels of traffic stress: LTS 1 is suitable for children, while LTS 4 creates a higher stress environment for bicyclists. The Mineta Transportation Institute has published a paper titled “Low-Stress Bicycling and Network Connectivity” that includes a number of tables to identify the appropriate LTS score for a segment. The quality of the pedestrian environment can be measured through a pedestrian Level of Service (LOS) analysis. Pedestrian LOS A describes a comfortable and safe walking environment with appropriate crossing opportunities, while pedestrian LOS F reveals an unsafe pedestrian environment without dedicated pedestrian facilities. Different methodologies are available for evaluating pedestrian service levels, including the San Francisco Department of Public Health’s Pedestrian Environmental Quality Index (PEQI), Fehr & Peers’ Streetscore+ tool, and the Highway Capacity Manual LOS methodology. Although each approach applies a slightly different methodology, the inputs are fairly similar, including number of vehicle lanes, vehicle speeds, vehicle volumes, presence and quality of pedestrian facilities, and pedestrian crossing facilities.
|
Page 34
Active Transportation Performance Measures
Section 6:
|
INFRASTRUCTURE
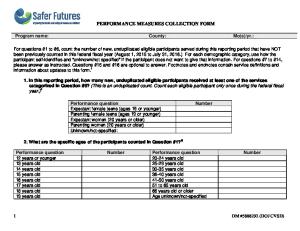
ATP Network Cost Estimating Tool Project Segment Type Bicycle
One Way Cycle-Track
Project
1 of 1
Telegraph Avenue Complete Streets
1
# of Miles
4
# of Signalized Intersections
2
# of Unsignalized Intersections
Project Segment Elements Targeted Segment Cost
Segment Name
2 of 2
High
Medium
Low
Custom
N
Raised Cycle Track
20th to 29th Streets Bikeway
In-Roadway Cycle Track with Striped Buffers
Soft-Hit Posts Landscape Planter Barrier
Project Description
In-Roadway Cycle Track with Raised Concrete Buffer
sample
In-Roadway Cycle Track with Raised Landscaped Buffer Wayfinding
Bicycle Detection-Loop Bicycle Detection-Video
Bicycle Signal Phase Protected Turn Phase
Project Cost Summary
Two Stage Turn Boxes
Segment Cost
$11,636,392
Bike Boxes
Total Project Cost
$11,918,878
Roadway Lighting
Active Transportation Cost Estimating Tool
INFRASTRUCTURE:
Financial Investment Financial investment in bicycle and pedestrian infrastructure is an indicator of a community’s commitment to bicycling and walking. Financial
investment captures the amount of money spent on an active transportation project, in absolute terms or proportional to the total capital budget.
Methods of Evaluation Project cost per linear foot or mile (scaled based on project size) is a common way to track financial investment in active transportation projects. Modal spending captures the relative investment in active transportation projects as compared to other modes and can be calculated as the percentage of a jurisdiction’s total capital budget spent on active transportation projects. Project costs and capital budgets are publicly accessible and can often be found on a jurisdiction’s website. Other important measures of financial investment are a jurisdiction’s ability to share the costs of a project by securing non-local dollars or additional outside funding through grants opportunities. Information on cost-sharing and grant applications can be found online or through communication with local officials.
INFRASTRUCTURE:
Supportive Facilities Supportive facilities to bicycling and walking include bicycle racks, bicycle lockers, bicycle fix-it stations, benches, and other features that support on and off-street bicycle facilities, sidewalks, and multi-use paths. These facilities are not essential for through travel, but projects include them to make bicycling and walking more comfortable, safe, and convenient. Methods of Evaluation The evaluation of supportive facilities for active transportation can involve counting the number of facilities present or the number of facilities added to the study area over a designated period of time. Measuring the use or occupancy of the supportive facilities is also a useful tool. Occupancy measures can be broken down by land use, geography, or trip type. For example, bicycle parking occupancy at transit nodes can be measured by counting the number of occupied bicycle parking spaces at transit stops and stations out of the total bicycle parking supply at peak times or throughout the day within the study area.
|
Page 36
Active Transportation Performance Measures
Section 6:
|
INFRASTRUCTURE
INFRASTRUCTURE:
Case Study Applications Example applications of infrastructure performance measures include a State Smart Transportation Initiative research paper and the Seattle Bicycle Master Plan.
Minneapolis skyline
State Smart Transportation Initiative
When to Consider Infrastructure Performance Metrics Metrics measuring the quantity and quality of bicycling and walking infrastructure are applicable when conducting various types of plans or studies at multiple scales, including: �C �omprehensive, Master, or Subarea Plans
�S� afe Routes to School
�C �orridor Studies
�F� acility Design
�S� afety Studies or Action Plans
�B �efore & After
�T � ransit Studies
The State Smart Transportation Initiative (SSTI) produced a paper for 2014 Pro Walk/Pro Bike/Pro Place called Performance Measures for Bicycle and Pedestrian Investments. The paper provides guidance on walking and bicycling performance measures based on interviews with transportation advocates, consultants, DOTs, MPOs and city staff. Through this research, SSTI discusses output-based metrics (as opposed to outcome-based metrics) that provide a way to measure the success of plans or policies through quantifying project implementation. Measuring the quantity and quality of infrastructure are noted as the most effective ways to measure outputbased metrics. The number of new miles of facilities (quantity) is often correlated with bicycling and walking activity, but infrastructure ratings (or quality) should also be considered for a more accurate representation of the improvement in the bicycle and pedestrian network. This paper further discusses how to best measure quantity and quality of infrastructure, the value in the simplicity and correlation of outcome based measures with success, and the current research on these metrics. Seattle Bicycle Master Plan (Seattle, WA)
Chapter 7 of the Seattle Bicycle Master Plan contains a number of performance measures, including many that focus on the presence and state of bicycle and pedestrian infrastructure. This plan includes metrics related to infrastructure including percentage of bicycle facility network complete, number of bicycle racks installed, number of bicycle project grant applications applied for and obtained, and number of bicycle spot improvements completed. For each performance measure, a baseline measure, performance target, data collection frequency and responsible party is also included.
|
Page 38
Active Transportation Performance Measures
Implementation bicycle and pedestrian infrastructure can influence the economy in many ways, including sales, property values, and costs/benefits to society. Certain metrics are available to measure economic performance over time and potentially reveal tangible benefits of active transportation projects, creating a strong defense for funding and political support. The following table summarizes performance measures and metrics used to assess the economic development success of active transportation projects. Performance Measures and Metrics for Economic Development GOAL
PERFORMANCE MEASURE
METRIC Customers by Mode
Sales
Revenue By Mode Number of Tourists Commercial Vacancies
Property Value Economic Development
Residential Vacancies Tax Yields Property Values Cost of Commute Mode Choice
Societal Costs and Benefits
Costs of Collisions Investments From Other Sectors Jobs Creation
economic development
Economic Development
Active Transportation Performance Measures
ECONOMIC DEVELOPMENT:
ECONOMIC DEVELOPMENT:
Investment in bicycle and pedestrian infrastructure has been shown to result in additional revenue for a community, as cited in the Advocacy Advance report Bicycling Means Business (2012). One way to measure a project’s impact on the local economy is through retail and
Bicycle and pedestrian projects can also increase property values within the project area. Vacancies may decrease while tax yields increase.
Sales
commercial property sales data by mode. Methods of Evaluation Sales can be measured in various ways: including: number of customers, revenue, or number of tourists. Number of tourists is often used as a proxy for sales revenue when those data are not available. Sales information can be found in tax documents, although it is rarely provided at the local level due to privacy concerns. Local information would need to be collected through surveys at commercial and retail locations and aggregated to the small area, corridor or community-wide level. If survey data has not been collected in the study area previously, design a survey that captures information such as tourist expenditure, business purchases and local consumer spending. Survey implementation can be expensive, so consider conducting the survey with a smaller representative sample and extrapolating to a larger area. A helpful resource on collecting sales information is “Measuring the Local Impact of Tourism,” available from the Department of the National Tourist Boards.
Section 7:
|
ECONOMIC DEVELOPMENT
Property Value
Methods of Evaluation Residential and commercial property values can be measured directly, or proxy variables that are correlated with property values can be used for indirect measurement. Direct methods include home values and retail square footage values within the project area, identified using property assessments or publicly accessible sites such as Trulia, Zillow, or LoopNet. Indirect ways of measuring property value include commercial and residential vacancy rates, tax-yield per acre, and nontransportation property investment such as the number of building modification permits or accessory dwelling unit requests, Information on property values is often publicly available on jurisdictions’ websites. Other valuable resources are Certificates of Occupancy issued by the municipal building department and building permit data.
ECONOMIC DEVELOPMENT:
Societal Costs and Benefits Projects may aim to reduce the costs, or increase the benefits, of transportation choices to the larger community. Costs and benefits are often indirect and are not realized by the individual but paid for on the societal level. Costs include emissions, noise pollution, healthcare costs, congestion, collisions and operating costs. Benefits include cleaner air, safer communities, social capital, productivity gains and savings to the healthcare system. Methods of Evaluation One way to measure transportation costs to society is through total miles traveled by mode. This measure can be applied within a range of geographical scales from block corridor to community-wide. One example of transportation cost measurement in the calculator created for Metro Vancouver through the Moving Forward project,which helps to determine the societal costs of each travel mode and travel distance. Two indirect approaches for measuring societal costs are investments leveraged from other sectors and the number of jobs created by a project which applies a multiplier to the capital cost estimate to come up with a job estimate.
|
Page 42
Section 7:
|
ECONOMIC DEVELOPMENT
2010 Olympic Cauldron in Vancouver, Canada.
Active Transportation Performance Measures
ECONOMIC DEVELOPMENT:
Case Study Applications Example applications of economic performance measures include Vancouver’s Moving Forward project and New York City’s Measuring the Street report. Moving Forward (Vancouver, Canada)
When to Consider Economic Development Performance Measures Metrics measuring the economic impact of bicycling and walking projects are applicable when conducting various types of plans or studies at multiple scales, including:
Tra f
fic
Stress Impa
ct
�C �omprehensive, Master, or Subarea Plans �C �orridor Studies �S� afety Studies or Action Plans �T � ransit Studies �S� afe Routes to School �F� acility Design �B �efore & After
Metric Study
Moving Forward is a data journalism project that considers transportation issues in Metro Vancouver. One element of the project was to create a calculator to determine the cost of commuting using different modes. This considers the broader impacts of transportation costs and benefits, not only to the individual, but to society as a whole. The costs of commuting incorporated factors such as health care cost savings, emissions, congestion, collisions, climate change, noise pollution and increased productivity. The calculator to quantify the societal costs of mode choice is intended to inform travel behavior decision making. Measuring the Street (New York, NY)
The New York City Department of Transportation Measuring the Street report evaluated active transportation projects with the intention of “illustrating how measuring results can show progress toward safe, sustainable, livable and economically competitive streets.” The report included metrics such as sales tax receipts, and number of visitors to help measure economic value and neighborhood vitality.
|
Page 44
Active Transportation Performance Measures
Placemaking Creating vibrant and welcoming public spaces for people to live, work, and play, also known as “placemaking,” is becoming a greater focus for many cities. In addition to the presence of people walking and bicycling in these public environments, placemaking efforts can contribute to the enjoyment people experience in a given space. Some of the metrics identified under previous goals, including Multimodal, Access and Infrastructure, are also considered under the placemaking goal and can be considered when measuring ‘the sense of place’ of a corridor or area.
Performance Measures and Metrics for Placemaking GOAL
PERFORMANCE MEASURE Public Art and Events
METRIC Arts Creation Wayfinding Public Seating
Placemaking
Community Investment Landscaping
River walk sculpture, downtown San Antonio, TX.
Community Participation Local Monies Storm Water Management Native Vegetation
Placemaking
The following table summarizes performance measures and metrics used to assess the placemaking success of active transportation projects.
Active Transportation Performance Measures
Section 8:
|
PLACEMAKING
PLACEMAKING:
Sculptures, fountains, murals, and other forms of art can inspire people to look, explore, and play. When located in public spaces, public art itself can be an attraction that residents and visitors gather around. Events, such as live performances, markets, and food vendors, have a similar draw. These relate to active transportation because many visitors arrive on foot or by bicycle and take part in the festivities by walking around. Wayfinding provides information signage about the direction and distance to destinations. This signage can be branded and designed to create a sense of community and make destinations feel more walkable and bikeable. The number of seats available at public art and event locations is also important because children, the elderly, people with disabilities, and patrons who stay for a long period of time will need somewhere to sit.
Boston Public Garden Ducks
Public Arts and Events Left: Seating at NoHo in Los Angeles, CA. Photo: LADOT/Jim Simmons
PLACEMAKING:
Community Investment Successful placemaking is often a very community driven process and depends on support and input from the surrounding community. Engagement of residents in the process and financial contributions in the form of local match or other methods are indications of local support for placemaking projects. PLACEMAKING:
Methods of Evaluation Public arts and events can often be measured by the number of installations or amount of programming throughout the year. When they are specifically related to walking and bicycling improvements or a particular project, this should be noted. In areas with significant investments in public arts and events, it may be worth tracking money spent over time.
Methods of Evaluation Public workshops, community meetings, and targeted outreach are common ways to engage the community in placemaking efforts. Counting the number of events and participants is a good way to track this metric. In addition to their time, residents may invest their money in placemaking through assessments, matching funds, and local improvement districts. The amount of money invested by residents or businesses to pay for placemaking is a valuable metric.
Landscaping Landscaping can contribute to the enjoyment of a place by providing scenery, offering shade, and separating people from moving vehicles on the street. Stormwater management elements and native vegetation are two common types of landscaping that create place. Stormwater management techniques may include bioswales, permeable pavement, and rain gardens. Native vegetation exhibits the character of a community. Methods of Evaluation Tracking the presence and amount of stormwater management elements and native vegetation are useful ways to account for landscaping that contributes to place. Measuring the length or area of space devoted to landscaping is an easy way to accomplish this.
|
Page 48
Active Transportation Performance Measures
Section 8:
|
PLACEMAKING
|
Page 50
When to Consider Placemaking Performance Measures
Leimert Park village Plaza, Los Angeles, CA. Photo: LADOT/Jim Simmons
Metrics measuring the placemaking impact of bicycling and walking projects are applicable when conducting various types of plans or studies at multiple scales, including: �C �omprehensive, Master, or Subarea Plans �C �orridor Studies �S� afety Studies or Action Plans �T � ransit Studies �S� afe Routes to School �F� acility Design �B �efore & After
PLACEMAKING:
Case Study Applications Example applications of placemaking performance measures include Smart Growth America’s Evaluating Complete Streets Projects and the MWCOG State of Place Tool. Smart Growth America: Evaluating Complete Streets Projects
Metropolitan Washington Council of Governments State of Place
The Smart Growth America report provides government agencies the support and resources to be able to provide performance metrics to support active transportation. One of the seven goals in the report is ‘place.’ Place measures factors such as public art, scenic views, and shading. An example discusses parklets in Los Angeles and how different components of the parklet affect quantity of visitors and type of use. This study also saw a direct correlation with these factors of ‘place’ and the amount of people walking.
MWCOG applies a State of Place tool to quantify walkability. The tool applies street level built environment data such as street trees, benches, parks, and street facades based on trends from reliable research to quantify walkability. It then applies an algorithm based on the various inputs. Parks, public spaces and amenities play an important role in measuring walkability.
Top: NoHo Plaza, Los Angeles, CA. Left: Hope St. Parklet, Los Angeles, CA. Right: Huntington Dr. Parklet, Los Angeles, CA. All Photos: LADOT/Jim Simmons
Active Transportation Performance Measures
Looking Ahead with Active Transportation Performance Measures As active transportation performance measures become more widespread, incorporating them into the planning process will be increasingly important. Methodology standardization and consistency will be crucial to track projects over time and across different localities. Some grant programs, including the Active Transportation Program (ATP) conducted by California’s Department of Transportation (CalTrans), already require the use of performance measures in the grant application process. As the demand for biking and walking grows throughout the country, performance measures will become essential to track, prioritize and fund biking and walking projects.
Active Transportation Performance Measures
Active
TRANSPORTATION Performance Measures
100 Pringle Avenue, Suite 600 Walnut Creek, CA 94596 Main: 925-977-3200 Fax: 925-933-8007 www.fehrandpeers.com
ALL RIGHTS RESERVED Copyright ©2015 Fehr & Peers