2120
JOURNAL OF COMPUTERS, VOL. 7, NO. 9, SEPTEMBER 2012
Acoustic Emission Signal Feature Extraction in Rotor Crack Fault Diagnosis Kuanfang He Hunan Provincial Key Laboratory of Health Maintenance for Mechanical Equipment, Hunan University of Science and Technology, Xiantan, 411201, China Email:
[email protected]
Jigang Wu, Guangbin Wang Engineering Research Center of Advanced Mine Equipment, Ministry of Education, Hunan University of Science and Technology, Xiangtan 411201, China Email:
[email protected],
[email protected]
Abstract—On the rotor comprehensive fault simulation testbed, characteristics of acoustic emission signal of different crack rotors in various depth and conditions are analyzed by the acoustic emission extraction experiment. The noiseeliminating method of the acoustic emission signal was researched by the wavelet packet technique, the characteristics of acoustic emission signal of the rotor crack was also obtained for fault diagnosis in this paper. The advantages of acoustic emission technique have been highlighted in the early period crack fault diagnosis compared to the vibration method of crack fault diagnosis. The diagnosis results were shown to be quite clear, reliable and accurate. Index Terms—Rotor crack, acoustic emission, wavelet packet, fault diagnosis
I.
INTRODUCTION
Rotor crack is a common fault in steam turbine rotor, turbines, generators, compressors and other large rotating machinery. Once such machinery and equipment occur failure suddenly in operation, it will bring about huge economic losses, even cause catastrophic accidents. So rotor crack fault diagnosis technology has been attracted attention from government, academia, and enterprises. Reference [1] showed that acoustic emission as a nondestructive testing method has been applied widely since the last mid century. Conventional diagnosis method of rotor crack is used to process and analyze fault characteristics by the vibration signal. However, rotating machinery vibration signals of fault are relatively complex and weak, especially for the early period failure without vibration sometimes. Therefore, it is a bottleneck problem that is difficult to identify the faulty feature by vibration method in strong background noise [2, 3]. The phenomena of relative motion of particles within material including atomic, molecular and particle swarm can produce the transient release of strain energy of elastic wave, which is used to identify and understand the substance or structure of the internal state. Currently, Acoustic Emission technology has been successfully
© 2012 ACADEMY PUBLISHER doi:10.4304/jcp.7.9.2120-2127
applied in the rotating machinery fault diagnosis, including gear box failure, rolling and sliding bearings failure, transmission component failure, rub rotor failure and so on. E.Govekar analyzed the acoustic emission signals to monitor machining processes in 2000 [4]. Followed by this, L.D. Hall used acoustic emission to detect shaft-seal rubbing in large scale turbines [5]. In reference [6], acoustic emissions was introduced to achieve diagnosis of continuous rotor–stator rubbing in large scale turbine units, this paper proposed the integration of acoustic emissions and signal processing methods to fault diagnosis. In order to expand acoustic emissions range of applications, H.M. Lei further studied the mechanism of electromagnetic acoustic transducer for ultrasonic generation in ferromagnetic material [7]. The acoustic emissions technology further promoted, reference [8] showed wavelet packets has been applied in acoustic emission signal feature extraction. References [9, 10] have proved that the elastic wave within the metal structure would be generated as the form of Lei Rem wave in the running of the equipment and communicate on the surface of the material. The elastic wave can be detected by the dedicated acoustic emission sensors. Therefore, the acoustic emission technique can be used to the rotor crack diagnosis. Because the acoustic emission technology in the early diagnosis of crack is highlighted by comparison of the time domain graph, power spectra of vibration crack fault diagnosis etc. Reference [11] has proposed crack fault identification in rotor shaft with artificial neural network. In reference [12, 13], Based on wavelet packet analysis, acoustic emission was applied to achieve location technique for crack fault source and feature extraction for cable damage. So the acoustic emission signal characteristics of rotor crack of four different crack depths with the same of materials are studied in this paper, as well as the relationship between acoustic emission signals and the depth, speed and load of the crack. The early period fault feature of crack is extracted by use of wavelet packet, which highlights the outstanding advantages in the acoustic emission signal analysis and processing. The acoustic emission technique for detection
JOURNAL OF COMPUTERS, VOL. 7, NO. 9, SEPTEMBER 2012
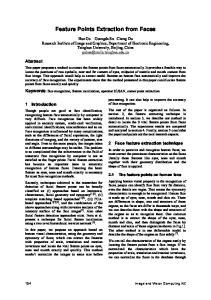
and fault diagnosis of rotor crack of rotating machinery is of great significance. II.EXPERIMENTAL METHODS AND DATA ACQUISITION A. Experimental Condition and Method Fig.1 shows rotor fault acoustic emission crack detection system diagram. The entire experiment is operated in the United States MFSPK6 integrated fault simulation. Acoustic emission (AE) acquisition system is the Danish SWAES full waveform acoustic emission monitor shown in Fig.2, the acoustic emission acquisition
Figure1. Rotor crack fault acoustic emission detection system diagram
2121
software is made in Beijing Sublimation Company shown in Fig. 3. Four home-made experimental shafts shown in Fig. 4, Size D×L is 16mm×53mm, materials are the 1Cr18Ni9Ti. One of them is good shaft, The remaining three shaft are made by pre-cut wire cutting and fatigue testing equipment, of which the crack depth is 3mm, 5m, 8mm with crack width of 0.12mm, crack near the roundabout at the centre of shaft, and the thickness of 0.10mm thin metal sheets is embed to simulate opening and closing of the crack, 502 glue is used to cement a side of the thin metal with the thin metal piece to prevent felling off during the experiment. Fig.5 is the rotor testing equipment. The fault simulation platform of the U.S. SpectraQuest company is chose as cracked rotor running environment. The testing can be able to simulate 32 kinds of failure modes such as bearing failure, gear failure, gearbox failure, shaft failure, electrical failure and so on, of which each failure mode supported by the typical fault conditions. Detection of acoustic emission of rotor crack failures is tested by this equipment; it is reliability, high precision and has a very
Figure2. Denmark SWAES full waveform acoustic emission detector Figure 5. American MFS integrated fault simulation test bed
Figure3. AE monitoring of signal collection software interface
Figure 4. Four pre-shaft
© 2012 ACADEMY PUBLISHER
valuable reference. Main components of SWAES full waveform acoustic emission detector includes SR15-type acoustic emission sensor with diameter of 19mm, weight of 34g, resonant frequency of 150KHz, sensitivity of 65dB, within the temperature scope of -65℃~177℃. The part of signal acquisition is the piezoelectric ceramic, which can sample the signal frequency range of 50~200 kHz. PAI preamplifier is frequency bandwidth of 0.02-2MHz and gain of 40dB. The main SA4 amplifier is frequency range of 20-400K, inputting impedance is more than 50M. The 9812 data acquisition card is 20MHz and 4-channel analog. The portable computer is IBM-T43. The acoustic emission signal is obtained by sensors, and sent to the pre-amplifier and main amplifier processing, then stored in the portable computer, which is controlled by the acoustic emission data acquisition system with the subsequent signal processing and analysis. Another function of the main amplifier is to supply electric for acoustic emission acquisition card. Two acoustic emission sensors are pasted to both ends of the bearing seat at the integrated fault simulation testing bench by glue in the experiment. The cable is
2122
JOURNAL OF COMPUTERS, VOL. 7, NO. 9, SEPTEMBER 2012
reasonable layout and non-contact rotating shaft in the experiment. B. Data Acquisition In experiment, we collect acoustic emission signals of four different shafts in the condition of same load at different speed and same speed at different loads. The first step is to measure the noise signal, fit the well shaft, and then run the integrated fault simulation testing bed, the collected signal in the experiment is the samples of the noise signal. The fitting method of process and denoising the crack acoustic emission signal is obtained by analyzing the characteristic of sampled noise signal. The acoustic emission signals of the four shafts are detected in the condition of same load at different speed and same speed at different loads. Acoustic emission signals usually have high amplitude compared to electromagnetic noise signals, so we can set a reasonable threshold in software to collect the signal. Fig. 6 shows time domain graph of the original signal at the speed of 1800r/min. Fig. 6 (a) shows that the signal amplitude is low at the range of 0.85V~1V, the Fig. 6 (b) (c) (d) show that the signal amplitude have an increasing trend as the degree of cracks deepen, and the timedomain signal of the well-shaft is relatively flat, the timedomain signal of the shaft has significantly waveform. Fig. 7 shows the vibration signal time domain graph of the entire shaft at the speed of 1800r/min, we can see that it is no significant differences between the well shaft and the crack shaft from the Fig.7. Therefore, detection of acoustic emission is more easily identified failure, especially the early period crack failure.
(c) 5mm crack depth of shaft
(d) 8mm crack depth of shaft Figure 6. 1800r/min the time domain graph of the AE signal
(a) Well shaft (a) Well shaft
(b) 3mm crack depth of shaft
© 2012 ACADEMY PUBLISHER
(b) 3mm crack depth of shaft
JOURNAL OF COMPUTERS, VOL. 7, NO. 9, SEPTEMBER 2012
2123
Fig. 8 shows the curve of rotating speed and the amplitude of acoustic emission signal with the load weight of 2.5Kg. Fig. 8 shows that the amplitude of acoustic emission signals increase as the rotor speed no
(c) 5mm crack depth of shaft
(c) 8mm shaft crack Figure8. Speed affects the curve of the AE signal amplitude
(d) 8mm crack depth of shaft Figure 7. 1800r/min time-domain diagram of vibration signal
(a) 3mm shaft crack
(a) 3mm shaft crack (b) 5mm shaft crack
(c) 8mm shaft crack (b) 5mm shaft crack
© 2012 ACADEMY PUBLISHER
Figure9. Load affects the curve of the AE signal amplitude
2124
JOURNAL OF COMPUTERS, VOL. 7, NO. 9, SEPTEMBER 2012
matter how the crack depth is. Fig.9 shows the curve of load and the amplitude of acoustic emission signal with rotational speed of 1800r/min. III. FAULT FEATURE EXTRACTION OF CRACK ACOUSTIC EMISSION SIGNAL Fig. 10 (a) is the power spectrum of vibration signal of
(a)
well-shaft rotating at the speed of 1800 r/min, Fig. 10 (b) (c), (d) are the power spectrum of the original acoustic emission signal of crack shaft rotating at the speed of 1800 r/min. In the Fig.10, we can see there are no significant difference between Fig.10 (a) and Fig.10 (b), but the difference between Fig. 10(c) and Fig. 10(d) are obvious. It illustrate that vibration detection is hard to find the early period crack fault. Fig. 11(a) shows the power spectrum of original acoustic emission signal of well-shaft rotating at the
Well-shaft
(b) 3mm crack depth shaft
(c)5mm crack depth shaft
(a)
(b)
Well-shaft
3mm crack depth shaft
(c)5mm crack depth shaft
(d)8mm crack depth shaft (d)8mm crack depth shaft Figure10. Power spectrum of original vibration signal of 4 shafts rotating at the speed of 1800 r/min
© 2012 ACADEMY PUBLISHER
Figure11. Power spectrum of original AE signal of 4 shafts rotating at the speed of 1800 r/min
JOURNAL OF COMPUTERS, VOL. 7, NO. 9, SEPTEMBER 2012
speed of 1800 r/min, Fig. 11 (b), (c), (d) are the power spectrum of the original acoustic emission signal of crack shaft rotating at the speed of 1800 r/min. Fig. 11 show that the power spectrum of well-shaft and crack shaft are very different, the range of frequency are wider, and the spectral lines of characteristic frequency are also higher. The distribution of acoustic emission signal energy and the concentration of band can be learned from Fig. 11 (b), (c), (d), as well as the existed crack fault. However, we can’t determine the location and the degree of the crack fault clearly from Fig. 11 (b), (c), (d). So it is hard to diagnose the crack fault by acoustic emission signals precisely only through Fourier Transform. In order to extract the feature of crack fault acoustic emission signal clearly, pretreatment such as trend eliminating, mean eliminating and Gaussian noise filtering to the original acoustic emission signal of 3mm depth crack shaft rotating are done at the speed of 1800 r/min. Wavelet packet feature extraction method of acoustic emission signals is introduced to decompose the acoustic emission signal after noise elimination by Shannon entropy and 4 layer db10 wavelet. Thus, 4 levels reconstructed signal is divided into 16 bands from high to low, the length of each band is 15.625KHz, wavelet packet decomposition coefficients of tree node (4, 2) and (4,6) are selected to reconstruct. Fig. 12 is the acoustic emission signal and power spectrum of signal
2125
reconstruction, concentrated high-frequency spectrum can be clearly seen between 55 KHz~70 KHz in Fig.12, it demonstrates that behavior of acoustic emission of highfrequency elastic waves are happened during the crack propagation. Fig. 13 shows the original acoustic emission signal of 3mm depth crack shaft rotating at the speed of 3600 r/min, the amplitude of the time domain signal is about 1.3V. According to the original acoustic emission signal of 3mm depth crack shaft rotating at the speed of 3600 r/min shown in Fig. 13, Fig. 14 is reconstruction of the power spectrum of acoustic emission signal after wavelet packet decomposition. Fig. 14 shows that the main spectrum line concentrates between 75 KHz and 95 KHz, the low amplitude of spectrum line is between 50KHz and 75KHz, and little frequency distributed above 100KHz, it illustrates that the crack expanded speed and the amplitude of acoustic emission signals increase as the
Figure14. The AE signal power after spectrum wavelet packet decomposition and reconstruction
Figure12. AE signal wavelet packet reconstruction signal and power spectrum
Figure13. The original AE signal of 3mm deep crack shaft with 3600r/min
© 2012 ACADEMY PUBLISHER
Figure15. The original AE signal of 3mm deep crack shaft with 4500r/min
Figure16. The AE signal power after spectrum wavelet packet decomposition and reconstruction
2126
JOURNAL OF COMPUTERS, VOL. 7, NO. 9, SEPTEMBER 2012
frequency become larger. Fig.15 shows the original acoustic emission signal of 3mm depth crack shaft rotating at the speed of 4500 r/min, the amplitude of time domain signal reaches about 2V, characteristics of acoustic emission signals are obvious. Fig.16 shows the power spectrum reconstruction of acoustic emission signal after 4 layers wavelet packet decomposition. Fig. 16 show that high-frequency spectrum are mainly distributed between 90KHz and 105KHz, a small amount of spectrum lines concentrates the rang form 50 KHz to 70KHz and around 150KHz, and the amplitude are very low. It demonstrates that the amplitude and the frequency of acoustic emission signal increase as the rotating speed rises and the crack extension expands. The same studying of the shaft crack depth of 5mm and 8mm are done, the results also show that the fault characteristic become more obvious as the increasing of crack depth and the rotation speed. The above analyses have been shown that acoustic emission is feasible to diagnose the early period crack failure with accurately effect. IV. CONCLUSIONS (1) According to the comparison of acoustic emission and vibration signal applied to analyze the cracks faults of rotor, it conclude that acoustic emission is easier to be detected for the early period cracks at high speed, the vibration signal is only to identify the early period crack fault in the low rotation speed. (2) Wavelet packet technique can extract the pulse signal represented fault source characteristic and obtain effective failure information from the acoustic emission signal. When wavelet packet technique is applied to the actual acoustic emission testing systems, it will greatly improve the relevant technical indicators such as the rate of fault coverage, fault diagnosis and reduce false alarming rate. (3) The features of acoustic emission signal detected by shafts crack in different states are obviously different as the time changes, which has a full matching with the actual crack expanded propagation process. It is an important significance of acoustic emission technology further applied to fault diagnosis for rotor crack. ACKNOWLEDGMENT This work was supported in part by a grant from Financial support from National Natural Science Foundation of China (51075140, 51005073), Hunan Provincial Natural Science Foundation of China (11JJ2027), Project of Hunan Provincial Research Scheme (2011GK3052), Scientific Research Fund of Hunan Provincial Education Department (10C0682), Ph. D Start Fund (E51088), CEEUSRO special plan of Hunan province(2010XK6066), Industrial Cultivation Program of Scientific and Technological Achievements in Higher Educational Institutions of Hunan Province (10CY008), also from Aid program for Science and Technology Innovative Research Team in Higher Educational
© 2012 ACADEMY PUBLISHER
Institutions of acknowledged.
Hunan
Province,
are
gratefully
REFERENCES [1] G.M.Liu, Non-destructive Testing Technology, Beijing: National Defence Industry Press, 2006. [2] L.D. Hall, D. Mba, “Diagnosis of continuous rotor–stator rubbing in large scale turbine units using acoustic emissions”,Ultrasonics, Germany, vol.41, pp.765–773, September 2004. [3] E. Govekar, J. Gradisˇek and I. Grabec, “Analysis of acoustic emission signals and monitoring of machining processes”, Ultrasonics, Germany, vol.38, pp.598–603, May 2000. [4] M.W.Yang, Acoustic Emission Testing, Beijing: Mechanical Industry Press, 2005, pp.108–117. [5] R.Bagnoli, P. Citti, “Comparison of accelerometer and acoustic emission signals as diagnostic tools in assessing bearing”, Proceedings of 2nd International Conference on Condition Monitoring, London, UK, pp.117 – 125, May 1988. [6] L.D. Hall, D. Mba, “The detection of shaft-seal rubbing in large scale turbines using acoustic emission”, 14th International Congress on Condition Monitoring and Diagnostic Engineering Management, Manchester, UK, pp. 21–28, September 2001. [7] H.M. Lei, P.W. Que and Z.G. Zhang, “Mechanism study on electromagnetic acoustic transducer for ultrasonic generation in ferromagnetic material”, Journal of Southeast University (English Edition), China, vol.20, pp299-314, September 2004. [8] C.J. Liao and X.L Luo. “Wavelet packets apply in acoustic emission signal feature extraction”, Electronic Measurement and Instrument, China, vol.22, pp.79-85, Aguest 2008, [9] C.Kumar, V.Rastogi, “A Brief Review on Dynamic of A Cracked Rotor”, International Journal of Rotating Machinery, United States, vol 32, pp.1-6, February 2009. [10] A.Alfyo, “Dual Time-Frequency-Feature Investigation and Diagnostics of A Cracked de-Laval Rotor”, IEEE Transl. Japan, vol. 2, pp.1-7, September 2009. [11] Y.Tao, H.Qingkai, “Crack Fault Identification in Rotor Shaft with Artificial Neural Network”, 2010 Sixth International Conference on Natural Computation, China, pp.1629-1633, March 2010. [12]Z.G.Zhi, R.K.Sun, “Acoustic emission source location technique based on wavelet packet analysis”, Journal of Jiangsu University,China, vol 21, pp109-113, September 2010. [13]D.Yang, Y.L.Ding, A.Q.Li, “Feature extraction of acoustic emission signals for cable damage based on wavelet packet analysis” Journal of Vibration and Shock, United States, vol 29, pp154-158, April 2010.
Kuanfang He, who was born on December 13,1979 in Hunan province, received master degree in 2006 and PHD in 2009 from South China University of Technology, research field are dynamic monitoring and control for electromechanical systems. He has been working at Hunan University of Science and Technology since 2009, mainly engaged in theory and practice of teaching, scientific research. His paper works are: “Research on Controller of Arc welding Process Based on PID Neural Network”, J. Control Theory and Applications (2008),“Fuzzy logic control strategy for
JOURNAL OF COMPUTERS, VOL. 7, NO. 9, SEPTEMBER 2012
submerged arc automatic welding of digital controlling” China welding (2008), “Time-Frequency Entropy Analysis of Arc Signal in Non-stationary Submerged Arc Welding” Engineering(2011) , “Wavelet Analysis for Electronic Signal of Submerged Arc Welding Process”ICMTMA(2011)”, “Modeling and Analysis of arc weld inverter based on Double closed-loop control” Applied Mechanics and Materials(2010), “Prediction Model of Twin-Arc High Speed Submerged Arc Weld Shape Based on Improved BP Neural Network.” Advanced Materials Research(2011),etc. His research interest is dynamic monitoring and control for electromechanical systems. Dr. He is a member of Hunan Province instrumentation Institute. In recent years, he has presided one National Natural Science Foundation of China and two provincial research projects, obtained three provincial academic reward, published more than 20 academic papers. Jigang Wu, male, born in 1978 August 3, 1978 in Hunan province, received master degree in 2004 and Ph.D in 2008 from Huazhong University of Science and Technology, research field are dynamic monitoring and control for electromechanical systems, fault diagnosis. He has been working at Hunan University of Science and Technology since 2008, mainly engaged in theory and practice of teaching, scientific research. His paper works are: “Subpixel Edge Detection of Machine Vision Image for Thin Sheet Part”, China Mechanical Engineering (2009), “Research on planar contour primitive recognition method based on curvature and HOUGH transform”,
© 2012 ACADEMY PUBLISHER
2127
Journal Of Electronic Measurement And Instrument (2010), etc. His research interest is dynamic monitoring and control for electromechanical systems, fault diagnosis. Dr. Wu is a member of Hunan Province instrumentation Institute. In recent years, he has presided two provincial research projects, obtained three provincial academic reward, published more than 10 academic papers. Guangbin Wang, male, born in December 1974 in LinZhou city of Henan province, obtained PHD in 2010 from Central South University, research field are manifold learning and equitment’s fault diagnosis. He has been working at Hunan University of Science and Technology since 1999, mainly engaged in student management, teaching and scientific research. His works have, “Fault diagnosis based on kernel schur orthogonal local fisher discriminant”, Chinese journal of scientific instrument (2010),“Rotor Fault Diagnosis Based on Orthogonal Iteration Local Fisher Discriminant” Journal of Vibration, Measurement and Diagnosis (2010), “An improved noise reduction algorithm based on manifold learning and its application to signal noise reduction” , Applied Mechanics and Materials(2010).His research interest are nonlinear signal processing and equipment’s condition monitoring and fault diagnosis. Dr. Wang is a member of Hunan Province instrument nation Institute. In recent years, he presided 2 provincial research projects, obtained two provincial academic reward, published more than 20 academic papers.