13th World Conference on Earthquake Engineering Vancouver, B.C., Canada August 1-6, 2004 Paper No. 2963
A THREE-DIMENSIONAL FINITE BEAM ELEMENT FOR MULTISCALE DAMAGE MEASURE AND SEISMIC ANALYSIS OF CONCRETE STRUCTURES Fabio BIONDINI 1 SUMMARY The paper presents a three-dimensional finite beam element for damage evaluation and seismic analysis of concrete structures. The proposed formulation takes both mechanical and geometrical non-linearity into account. The measure of the seismic structural performance is based on a set of damage indices defined at different scales. The accuracy of the finite beam element is proven with reference to the results of experimental tests on reinforced concrete columns under complex loading histories. An application to the seismic analysis and evaluation of the structural performance of a concrete bridge is finally presented. INTRODUCTION In most cases, concrete structures should be analyzed by taking material and, eventually, geometrical nonlinearity into account in order to obtain realistic results under all load levels. In this paper, the structural modeling is based on a three-dimensional reinforced concrete finite beam element which accounts for both mechanical non-linearity, associated with the cyclic constitutive properties of the materials, and geometrical non-linearity, due to the second order effects. Such element is different from the so-called fiber elements, since the numerical integration is performed by higher order rules. The constitutive law of concrete considers cracking and crushing, tension stiffening, confinement passive action of the stirrups and spalling of the concrete cover. The constitutive law of reinforcing steel accounts for yielding, kinematicisotropic hardening, saturation and memory of the plastic strains, buckling of the bars. Following the philosophy of the modern seismic codes, where the design requirements are specified in terms of acceptable levels of structural damage, a measure of the seismic performance based on a suitable set of multiscale damage indices defined at the material level and, progressively, at the sectional level, at the element level, and at the structural level, is proposed. In order to verify the capability of the finite element in reproducing the cyclic response of reinforced concrete systems under complex loading histories, the results of a series of experimental static tests on reinforced concrete columns subjected to cyclic biaxial bending and axial load, are considered. The direct comparison of numerical and experimental results proves the potentialities of the proposed formulation. A final application to the seismic analysis of a concrete bridge highlights also the effectiveness of the proposed multiscale approach to damage evaluation, which allows an accurate measure and a comprehensive vision of the structural performance. 1
Dept. of Structural Engineering, Technical University of Milan. P.za L. da Vinci, 32 – 20133 Milan (Italy).
[email protected]
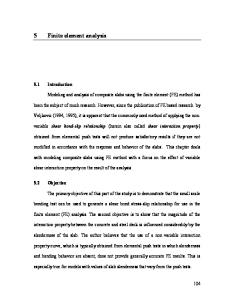
FORMULATION OF THE COMPOSITE FINITE BEAM ELEMENT Characteristics of the Finite Beam Element The formulation of the three-dimensional reinforced concrete finite beam element assumes the linearity of the cross-sectional strain field and neglects shear failures and bond-slip of the reinforcement. In particular, both material KM and geometrical KG contributions to the element stiffness matrix K′, the mass matrix M′, and the nodal forces vector f1′ equivalent to the applied loads fa = fa(x′), are derived by applying the principle of virtual displacements and then evaluated by integration over the length l of the beam (Figure 1):
K′ = K M + K G M′ =
l
∫ A M A dx′ T
Mx
x
0
∫ =∫
KM =
l 0
B T HB dx′
A
KG =
f1′ =
ρQ T Q dA
∫ l
l 0
N G T G dx
∫Nf 0
T
a
(1)
dx ′
(2)
where ρ is the volume density of the materials, N = N(x′) is the axial force, N = N(x′) is a matrix of displacement functions, A = A(x′), B = B(x′) and G = G(x′) are the corresponding compatibility matrices and Q = Q(y′, z′) is a kinematic operator (see Biondini 2000). Such formulation can be also extended to account for prestressing. Details about the prestressed beam element can be found in Biondini (2000).
y'
y'
ϕy1
v0
v1 ϕx1
u1
ϕy2
l
ϕx
w1
w0
ϕz1 z'
Ask
y'sk
v2 u0
w2
ϕx2
u2
x'
z'
z'sk
G
ϕz2
Figure 1. Three-dimensional reinforced concrete beam element.
The matrix N = N(x′) is defined by adopting the Hermitian shape functions of a linear elastic beam having uniform cross-sectional stiffness H and loaded only at its ends. However, due to material nonlinearity, the cross-sectional stiffness distribution along the beam is non-uniform even for prismatic members with uniform reinforcement. As known, exact interpolation functions can be derived from a flexibilitybased approach, but sufficient accuracy can be also achieved with the proposed stiffness-based approach if a suitable mesh is adopted. Thus, H is computed for each cross-section by integration over the area of the composite element, or by assembling the contributions of both concrete Hc and steel Hs (Malerba 1998): H = D dA = D c dAc + k D sk Ask = H c + H s (3)
∫
A
∫
Ac
∑
where Ac and Ask are the areas of the concrete and of the kth reinforcement bar, Dc and Dsk are the corresponding matrices which account for both stiffness and geometrical location of the materials. Therefore, to compute the matrix H, the constitutive laws of the materials have to be specified. Constitutive Laws of the Materials For the concrete, the material model accounts for cracking and crushing, tension stiffening, confinement of the concrete core and spalling of the cover. The envelope curve of the cyclic stress-strain law is shown in Figure 2.a. It is defined on the basis of the following dimensionless parameters: f σ σ ε E σ = c ε = c σ t = ct εt = t (4) E= c f cc ε cc Esec f cc E with: dσ c f f cc = kf c 0 ε cc = η 0 ε c 0 ε cu = η 0η1ε c 0 = η1ε cc Esec = cc (5) Ec = ε cc dε c
where fc0 and fcc are the compression strengths of the unconfined and confined material, respectively, εc0 and εcc are the corresponding strain values, εcu is the ultimate strain in compression, fct is the tensile strength, Ec0 is the initial modulus. The coefficients k, η0 and η1 which define the behavior of the confined material are defined on the basis of the model proposed by Mander et al. (1998). The branch in compression of the law σ = σ (ε ) is defined as follows (Popovics 1973): E0 rε r= (6) r −1 + ε r E0 − 1 while for the branch in tension the following law is assumed (Stevens et al. 1987): E ε 270 , ε ct ≤ ε ≤ 0 σ = 0 λ∗ = λε cc ≤ 1000 (7) λ= ∗ α σ t {(1 − α ) exp − λ (ε − ε t ) + α } , ε < ε t which allows also an effective modeling of the tension stiffening effects through a proper definition of the material parameter α which defines the asymptotic limit of the curve (see Figure 2.a). The cyclic model is formulated by means of a family of curves associated to a series of limit points along the load path. The coordinates of the limit points are listed in Tab.1. Based on such points, the family of curves in Table 2 is defined. Within this family, the curve which describe the load path is selected on the basis of the location of the current load point P ≡ (ε , σ ) with respect to the region ℜ shown in Figure 2.b, and of the sign of the strain increment ∆ε . It is worth noting that within the region ℜ ( P ∈ ℜ ) cracks are considered fully closed. Moreover, outside the region ℜ ( P ∉ ℜ ) the reloading rules take into account the contact effects which develop along the interlocked surfaces of the cracks during their closing process (Bolong et al. 1980). Figure 3 reproduces some typical loading and unloading paths.
σ =
[
σ
]
E0
σ
1
1
1
1
ℜ
εt ασt
1
σt
(a)
η1 ε
ε
ℜ ≡ closed cracks (b)
Figure 2. (a) Envelope curve of concrete. (b) Definition of the region ℜ with closed cracks.
σ
σ
U 1
E0 1
3
εa
4
4 3
R
ε
2
(a)
U 1
εcr
6 R 5
ε
2
σcr
(b)
Figure 3. Cyclic constitutive laws of concrete. (a) Unloading and reloading within the region ℜ. (b) Unloading on uncracked material and reloading after cracking.
Table 1. Limit points of the cyclic constitutive law of concrete.
1 ε 1 = max{ ε ε ∈ ℑ } 2 ε 2 = ε 1 − (ε 1 + ε a )
σ1 =
σ1 σ 1 + E0 ε a
rε 1 r − 1 + ε 1r
σ2 = 0
3 ε 3 = ε1 4 σ −σ 3 ε 4 = ε 1 + (2 + k ) 1 ER
σ 3 = 0.92σ 1 + 0.08σ R ≥ 0.92σ 1 rε 4 σ4 = r − 1 + ε 4r
5 ε 5 = min{ ε ε ∈ ℑ }
ϕE (ε − ε ) , ε cr ≤ ε 5 ≤ ε 2 σ5 = 0 5 2 ∗ { [ ( ) ] } σ ( 1 α ) exp λ ε ε α , ε 5 < ε cr − − − + cr 5 cr
6 ε6 = ε5 − εt U ε U = last{ ε ∆ε < 0 }
σ6 = 0 σ U = σ (ε U )
R ε R = last{ ε ∆ε > 0 } 1. 2. 3. 4. 5. 6. U. R.
σ R = σ (ε R )
Point of maximum strain ε on the envelope curve ℑ . Point of transition between compression and tension. Point of reloading in the elastic phase. Point of return on the branch in compression of the envelope curve ℑ . Point of minimum strain ε on the envelope curve ℑ . Point of transition between compression and tension. Point of last unloading with ∆ε < 0 . Point of last reloading with ∆ε > 0 .
ε a = a ε1
1 a = max ; 0.09ε 1 1 + ε 1
ER =
σ 3 −σ R ε3 − ε R
ε cr = ε 2 + ε t
σ cr = ϕσ t
ϕ=
1 1 + 0.3ε 14
For the reinforcing steel, the cyclic constitutive law refers to the models developed by Goldberg and Richard (1963), Giuffrè and Pinto (1970), Menegotto and Pinto (1973), Monti and Nuti (1992). Details of its implementation can be found in Biondini (2000). Here it is only recalled that such law accounts for yielding, kinematic-isotropic hardening, saturation and memory of the plastic strains, buckling of the bars.
Numerical Integration of the Finite Element Characteristics The quantities which define the characteristics of the finite element are evaluated by numerical integration. To this aim, the volume of the element is subdivided in isoparametric sub-domains having quadrilateral cross-sections, and each sub-domain is replaced by a grid of points which location depends on the adopted integration rule (Bontempi et al. 1996). In particular, depending on the function to be integrated and the geometry of the problem, the Gauss-Legendre and the Gauss-Lobatto schemes are used (Figure 4). Dynamic Equilibrium Equations of the Structure The equilibrium conditions of the finite beam element are derived from the already mentioned principle of virtual work. In this way, by assembling the element contributions with reference to a global coordinate system, the incremental dynamic equilibrium of the whole structure can be formally expressed as follows: M d&s& + C ds& + K ds = df (8) where s is the vector of the nodal displacements and f = f0+f1+fg is the vector of the nodal forces. The latter results from the nodal loads f0, the nodal forces f1 equivalent to the element loads fa = fa(x′), and the nodal forces fg= −ügMi equivalent to the seismic actions due to the non-inertial acceleration üg=üg(t) of the ground, and where i is the influence vector which components represent the nodal displacements for the static application of a unit ground displacement ug=1. Finally, the damping matrix C=C(t) is obtained at each time instant from the modal properties of the structure according to the Rayleigh's model.
Table 2. Stress σ = σ (ε ) and tangent modulus E = E (ε ) of the cyclic law dσ = E dε of concrete.
∆ε > 0
∆ε < 0
,ε R ≤ ε ≤ ε3 σ R + E R (ε − ε R ) σ = Ax 3 + Bx 2 + Cx + D , ε 3 < ε ≤ ε 4 rε ,ε > ε4 r − 1 + ε r
P∈ℜ
,ε R ≤ ε ≤ ε 3 E R E = 3 Ax 2 + 2 Bx + C , ε 3 < ε ≤ ε 4 r r (r − 1)(1 − ε ) ,ε > ε 4 (r − 1 + ε r ) 2 A=
σ −σ3 E R + E4 +2 4 2 (ε 3 − ε 4 ) (ε 3 − ε 4 ) 3
σ −σ3 E + 2E4 B=− R −3 4 (ε 3 − ε 4 ) (ε 3 − ε 4 ) 2 σ 3 − σ R ε − ε R ER = 3 σ R ε R − ε cr
, ε cr ≤ ε R ≤ ε 3 , ε R < ε cr
ε −εR σ R 1 − ε6 − εR ε − ε6 σ = σ 3 ε3 − ε6 ε −εR σ R + (σ 3 − σ R ) ε − ε 3 R
P∉ℜ
σR ε R − ε 6 σ3 E = ε 3 − ε 6 σ 3 − σ R ε −ε R 3
, ε ≤ ε6 ε > ε 6 , ε R ≤ ε 6 ε > ε 6 , ε R > ε 6
C = E4
rU x ,ε 2 ≤ ε ≤ εU σ U 1 − rU − + 1 r x U σ = σ 5 + E 5sec (ε − ε 5 ) ,ε5 ≤ ε ≤ ε 2 ∗ σ cr {(1 − α ) exp − λ (ε − ε cr ) + α } , ε < ε 5 sec rU ( rU − 1)(1 − x rU ) ,ε 2 ≤ ε ≤ εU EU ( rU − 1 + x rU ) 2 ,ε5 ≤ ε ≤ ε 2 E = E 5sec ∗ ∗ − σ cr λ (1 − α ) exp[− λ (ε − ε cr )] , ε < ε 5
[
sec U
E
=
σU εU − ε 2
D =σ4
E1 = bcE0 x = ε −ε4
rU =
]
E
ϕE 0 = σ5 ε − ε 2 5
sec 5
x=
, ε ≤ ε6
σ = σ 5 + (σ U − σ 5 )1 −
ε > ε 6 , ε R ≤ ε 6 ε > ε 6 , ε R > ε 6
E = EUsec
ε − εU ε 2 − εU rU x rU − 1 + x rU
rU (rU − 1)(1 − x rU ) (rU − 1 + x rU ) 2
σU − σ 5 εU − ε 5
E1 = bcE0 rU =
, ε 5 < ε cr
b = max{ kσ U ; 1} c = min{ ε ( −0.5) ; 1} U
EU EU − EUsec
EUsec =
, ε 5 = ε cr
EU EU − EUsec
b = max{ k (σ U − σ 5 ); 1} c = min{ (ε − ε ) −0.5 ; 1} U 5 x=
ε − εU ε 5 − εU
Numerical Integration of the Incremental Equations of Motion The numerical solution of the non-linear incremental equations of motion is performed at given time steps ∆t by using the non-iterative formulation of the Newmark's time-integration method. However, due to the non-linear behaviour of the system, the secant matrices K=K(t) and C=C(t) are unknown. The dynamic equilibrium within each time step is then searched by subsequent approximations on the basis of the iterative Newton-Raphson technique.
y'
η
Lobatto
1
z'
-1
1
ζ
-1
y'
Legendre
η
x' Lobatto
ξ Legendre
Figure 4. Subdivision of the finite element volume in isoparametric sub-domains and locations of the Gauss integration points according to the Legendre and Lobatto rules.
MULTISCALE MEASURE OF STRUCTURAL DAMAGE
Structural damage is here viewed as a degradation of the mechanical properties which makes the system less able to withstand the applied actions. Damage models are usually based on state variables, or damage indicators, suitable to describe the damage state of the system. A direct measure of the damage is, instead, achieved through functions of such variables, called damage indices (CEB 1997). Damage Indicators A damage indicator d is usually identified with a meaningful parameter of the structural response. In concrete structures, damage is depending on several phenomena like cracking and crushing of the concrete, yielding of the reinforcement, spalling of the concrete cover, buckling of the compressed bars, slip between concrete and steel, etc. Since all these aspects are generally strongly related to the propagation of irreversible strains in the component materials, a minimum of two parameters representing the maximum strain level and the dissipated energy, respectively, are usually required for a satisfactory description of the damage evolution. A first damage indicator d1 is then identified with the maximum strain εmax = εmax(x′, y′, z′, t) in the materials: − ε ≥ 0 , concrete d1 ≡ ε max = max ε = max c (9) t t , steel εs
where, because of its low tensile strength, only the compressive strain is considered meaningful for the damage of concrete. In addition, a damage indicator d2 is chosen to be coincident with the strain energy Φcyc = Φcyc(x′, y′, z′, t) stored in the materials along the load path ℘: d 2 ≡ Φ cyc = σ dε (10)
∫
℘
Damage Indices A damage index D gives a direct measure of the damage level as a function of a set of damage indicators. The knowledge of such an index, usually defined within the range [0;1], allows to assess the distance of the actual structural configuration from each assigned limit state D = D . For a single damage indicator d, a relationship D = D(d) of wide generality can be introduced as follows (Powell & Allahabadi 1988): α
d −d− D = + (11) − d −d where d− and d+ represent the values of the variable d associated to the undamaged (D = 0) and completely damaged (D = 1) states, respectively, while α define the damage rate (Figure 5).
D 1 α1
D 0
d
−
d
d
+
d
Figure 5. Relationship between a damage index D and a damage indicator d.
For a set of q damage indicators d = [ d1 d2 … dq ]T, a relationship D = D(d) of wide generality can be then introduced as follows (Biondini 2000): αr
αr
q q d − d r− d r − d r− wr r+ = β = β r Drα r (12) r − + − r =1 r =1 r =1 dr − dr dr − dr where wr is the weight coefficient of the contribution Dr associated to the indicator dr, dr− and dr+ are the limit values of dr associated to the undamaged (Dr = 0) and completely damaged (Dr = 1) states, respectively, αr is the corresponding damage rate, and w0 = Σwr (r = 1,…, q). In particular, with reference to the indicators d = [ d1 d2 ]T = [ εmax Φcyc ]T previously introduced, a damage index of the materials DM = DM(x′, y′, z′, t) is defined as follows:
D=
1 w0
q
∑
∑
∑
α
α1
Φ cyc − Φ − 2 + β 2 + (13) − Φ − Φ This definition leads for α1 = α2 = 1, β1 = 0, β2 = β, and ε − = Φ − = 0 , to the widely accepted formulation proposed by Park and Ang (1985). However, beside considering the threshold values ε − = Φ− = 0 for the initial damage, the index of Park and Ang does not satisfy the following normalization condition: ε −ε− DM = β 1 max + − ε −ε
q
∑β
r
=1
(14)
r =1
Such inconsistency can be avoided by assuming β 1 = (1 − β M ) and β 2 = β M , or:
Φ cyc − Φ ε −ε− + βM + DM = (1 − β M ) max (15) + − Φ − Φ− ε −ε where βM = βM(x′, y′, z′, t) denotes a suitable material constant (βM ≅ β), and the threshold values of the −
indicators are assumed to be coincident with the elastic and the ultimate limits in the materials: ε− ε+ , concrete −ε 0 ε− = ε Φ − = σ dε Φ + = σ dε ε + = cu , steel 0 0 sy ε su
∫
∫
(16)
Multiscale Formulation of Damage The index DM fully describes the damage evolution in each point of the structure. However, due to its local nature, it does not seem handy for design purposes. A more synthetic global measure of damage may be derived at different scales from DM by a weighted average over given portions of the structure. By denoting with w=w(x′, y′, z′, t′) a suitable weight function, which can be effectively identified with the stored energy w = Φcyc (Wen 1986), it is useful to define a damage index of the cross-section Dx = Dx(x′, t):
Dx =
∫ wD dA = β D ∫ ∫ w dA M
A
A
A
x
M
dA
(17)
a damage index of the element Dk = Dk (t ) : Dk =
∫
Vk
wDM dV
∫
w dV
=
∫
Vk
β k DM dV
(18)
Vk
and a damage index of the structure D0 = D0 (t ) : m
D0 =
∑∫
Vk
k =1
wDM dV =
m
∑∫ k =1
w dV
m
∑∫ k =1
Vk
β 0 DM dV
(19)
Vk
The knowledge of both the time evolution and spatial distribution of such indices can be easily obtained from a finite element analysis and leads to an accurate measure and a comprehensive vision of the structural performance. APPLICATIONS Reinforced Concrete Column subjected to Cyclic Biaxial Bending and Axial Force In order to verify the capability of the proposed three-dimensional finite beam element in reproducing the cyclic response of reinforced concrete systems under complex loading histories, the results of a series of experimental tests carried out by Bousias et al. (1995) are considered. The experimentation consists of cyclic static tests on reinforced concrete columns subjected to a vertical load and horizontal imposed displacements. In the present application, the tests denoted with S1, S5, S7, and S9 only are considered. All the columns have a free height h = 1.49 m and a square cross-section with side dimension a = 250 mm (Figure 6.a). The reinforcement consists of 8∅16 mm longitudinal bars with concrete cover c = 15 mm, and stirrups ∅8 mm with spacing s = 70 mm. The steel material properties are: yielding strength fsy = 460 MPa; ultimate strength fsu = 710 MPa; ultimate strain εsu = 11%. The compression strength of concrete varies with the specimen: (S1) fc0=29.0 MPa; (S5) fc0=33.1 MPa; (S7) fc0=28.1 MPa; (S9) fc0=23.9 MPa. For concrete the following properties are also specified: Ec 0 = 9500 f c103 , f ct = 0.25 f c20 3 , εc0 = 2%, εcu = 4%. The components of the displacement at the top of the column and of the corresponding reaction force at its base are denoted with (ux,uy,uz) and (Fx,Fy,Fz), respectively, where x and y are the horizontal directions along the principal axes of the cross-section and z is the vertical direction along the axis of the column. The displacement loading histories ux– uy are shown in Figure 7. As recalled in such Figure, the tests S1, S5, and S7 were carried out with a constant axial load ν =N/(fc0 a2) = 0.12, while for the test S9 two levels of axial load, ν = 0.03 and ν = 0.15, were applied during the experiment. Moreover, in order to avoid second order effects on the reaction force, the axial load was applied in such a way that its line of action passed at each time instant through the center of gravity of the column base. The column is modeled with 4 finite beam elements, each of them with 7 Gauss-Lobatto sections. The cross-section is subdivided in 13 isoparametric sub-domains, each of them characterized by a different level of confinement (Figure 6.b) and by an integration scheme which varies from 2×2 to 5×5 Gauss-Legendre points (Figure 6.c), for a total of 93 sample points. Figures 8.a-b show the results of the analyses superimposed to those obtained from the experiments. In particular, the time-history of the vertical displacement uz=uz(t), the path of the horizontal reaction forces Fx-Fy, and the horizontal load-displacement diagrams Fx-ux and Fy-uy, are reproduced in such Figures. In all cases, the comparison between numerical and experimental results is in general very good, even if minor systematic deviations are noted in the initial branch of the first cycle of the load-displacement diagrams, as well as along the reloading branches in correspondence of the sign inversion of the forces, where the numerical hysteretic cycles tend to be a little wider than the experimental ones. Higher and not negligible deviations however occur during the last phases of the tests S5 and S9, which are characterized by a relevant strength degradation that is not detected by the numerical analyses. Since this is the only remarkable discrepancy among analyses and experiments, it seems reasonable to correlate the strength degradation process with failure mechanisms which the finite beam element is not able to reproduce, as for example bond-slip and pull-out phenomena (Filippou 1998). Shear failures should be instead avoided due to the slenderness of the column.
250
0 1 2
8φ16 st.φ8/70
(a) 250 mm (b) (c) Figure 6. Tested column. (a) Detail of the cross-section. (b) Subdivision in subdomains (0=no confinement; 1=low confinement; 2=high confinement). (c) Location of the Gauss points.
S1
ν=0.12
S5
ν=0.12
S7
S9
ν=0.15
ν=0.15 ν=0.03
ν=0.03 ν=0.12
Figure 7. Loading paths ux-uy of the cyclic tests S1, S5, S7, S9 (Bousias et al. 1995).
Despite of the discrepancy mentioned above, for which additional failure mechanisms such as bond-slip should be included in the finite element formulation, the results highlight the effectiveness of the finite beam element in reproducing the cyclic response of reinforced concrete systems under complex loading histories. Thus, such element can be considered as a powerful tool both in static and seismic analysis of reinforced concrete structures, especially if joined to a proper measure of damage. With this regards, Figure 9.a shows for the test S9 the time-history of the damage index D0=D0(t) of the whole structure, as well as the diagram along the column axis of the damage index Dx=Dx(x′,t) of the cross-sections at different time instants. Such indices are evaluated by assuming a damage parameter βM=0.10 for both concrete and steel. It can be noticed that the damage index Dx=Dx(x′,t) of the cross-section gives an effective description of the spatial distribution of damage, which, during time, obviously tends to localize at the bottom part of the column. At an higher level, the index D0=D0(t) gives instead a more synthetic measure of damage, which is directly related to the performance of the whole structural system. This is highlighted in Figure 9.b, which shows the time-history of the first vibration period T=T(t) of the column. Due to the evolution of damage, the vibration period T progressively increases during the test with step increments that, on average, are clearly related to the variation of the damage rate, represented by the slope of the curve in Figure 9.a.
S1
S5
Figure 8-a. Comparison of experimental (dashed lines) and numerical results (continuous lines): time history uz=uz(t), path of the reaction forces Fx-Fy, load-displacement diagrams Fx-ux and Fy-uy.
S7
S9
Figure 8-b. Comparison of experimental (dashed lines) and numerical results (continuous lines): time history uz=uz(t), path of the reaction forces Fx-Fy, load-displacement diagrams Fx-ux and Fy-uy.
Dx
(a)
(b)
Figure 9. (a) Time-history of the damage index D0=D0(t) of the structure, and diagrams of the damage index Dx=Dx(x′,t) of the cross-sections at different time instants. (b) Time-history of the first vibration period T = T(t).
Seismic Analysis of a Concrete Bridge Structure The concrete bridge shown in Figure 10 is considered. The bridge deck is a two-box girder having total length l = 200 m and monolithic connections with both the piers and the abutments. The cross-section of the deck is shown in Figure 11.a. The piers, having the same height h = 40 m, are subdivided into two parts. The lower one has a box cross-section while the upper part is composed by the two main edges of the box rigidly connected only at the top. The higher-flexibility of the upper zone of the piers allows for the horizontal displacements due to the time dependent effects and to the temperature-imposed deformations. Moreover, by varying the height h1 of the stiffer part, the seismic behavior of each pier, and then of the whole bridge, can be properly modified to optimize the structural performance. This was done in previous works where an optimal solution with h1 = 0.70h for the lateral piers and h1 = 0.40h for the central pier was selected within a design strategy of damage minimization (Biondini 2000, Biondini et al. 2000). The geometry of the box cross-section of the piers, as well as the reinforcement layout, are given in Figure 11.b. Such cross-section is modeled as shown in Figure 11.c. The basic material properties are: fc0 = 30 MPa, εc0 = 2%, εcu = 4%, Ec 0 = 9500 f c103 , and f ct = 0.25 f c20 3 for concrete; fsy = 460 MPa and εsu = 11% for reinforcing steel. A damage parameter βM = 0.10 is assumed for both concrete and steel. The weight density of the composite material is γ =ρ g = 25 kN/m3. The damping ratio is assumed to be ξ = 5%. Since the non-linear behavior of the piers is mainly of interest, for the deck a linear elastic behavior with a higher damping ratio ξ = 15% is assumed. Finally, the soil-structure interaction is accounted for by elastic springs having stiffness as listed in Table 3. The structural model is finally shown in Figure 12. The ground motion considered for the seismic analysis is described by an artificial accelerogram üg = üg(t) having duration of 25 sec and peak value of 0.40g. The vertical component of the ground motion is disregarded and the direction d=d(t) of the earthquake is defined by the horizontal angle θ = θ (t) formed with the bridge axis (Figure 12). In particular, the four seismic scenarios associated to the constant values θ = 0÷30÷60÷90° are investigated. The structural performance of the bridge with respect to the selected earthquakes can be appreciated from Figure 13, which shows the time-histories of the damage index D0 = D0(θ, t) of the whole structure. First, it can be noticed that the direction of the earthquake strongly influences the development process of damage. In fact, for θ = 0° damage tends to fully take place around the time instant t ≅ 11 sec, while for higher θ–values damage develops in wider time intervals, up to about ∆t ≈ 10 sec for θ = 90°. Second, the more demanding scenario is associated to θ = 90°, for which the maximum final damage is achieved. However, in all cases the level of global damage is quite similar and remains very low (D0,max = 0.03), denoting a good seismic performance of the whole structural system. An effective description of the spatial distribution of damage is also given in Figure 14, where the diagrams of the cross-sectional damage index Dx = Dx(x′,t) in the piers at equally spaced time intervals are
200 m 50
50
50
50
40 m
Figure 10. Schematic view and main dimensions of the concrete bridge. cm
(a)
(b)
(c)
Figure 11. (a) Geometrical dimensions of the deck cross-section. Cross-section of the bottom part of the piers: (b) geometrical dimensions and reinforcement layout; (c) finite element model.
z
x
4
0
h
y
0.70 h
y
1 z z
θ
0.40 h
0.70 h 2
3
x
d
Figure 12. Structural model of the bridge. Table 3. Elastic stiffness of the springs at the base of the structure.
Foundations Abutments
Horizontal [MN/m]
Vertical [MN/m]
Rotational x [MNm]
Rotational z [MNm]
Torsional [MNm]
3000 3000
15000 15000
300000 400000
400000 300000
200000 200000
Figure 13. Time-history of the structural damage index D0 for θ = 0÷30÷60÷90° (D0,max = 0.03).
presented. Such diagrams show that for θ = 90° the piers tend to behave like cantilever beams and the sectional damage distribution results quite regular. However, as the θ−angle decreases, the internal redundancy of the piers gradually develops and their behavior becomes progressively more complex, leading to less regular damage distributions. Anyway, the maximum level of damage remains still very low, even for the worst case θ = 0° (Dx,max = 0.054). Finally, additional and more detailed information about the local damage is presented in Figure 15, which shows the maps of the damage index of the materials DM = DM(x′,y′,z′,t) in the cross-section at the base of the middle pier at the end of the earthquakes. Such maps, which allow to fully appreciate the directionality effects of the seismic actions, highlight some peaks of damage localized in the unconfined concrete of the cover, especially for θ = 90° (DM,max = 0.180).
θ = 0°
θ = 30°
θ = 60°
θ = 90°
Figure 14. Diagrams of the cross-sectional damage index Dx for the left and central piers for θ = 0÷30÷60÷90° at different time instants (∆t = 2 sec; Dx,max = 0.054).
θ = 0° θ = 30° θ = 60° θ = 90° Figure 15. Maps of the material damage index DM for the cross-section at the base of the central pier for θ = 0÷30÷60÷90° at the end of earthquakes (t = 25 sec; DM,max = 0.180). CONCLUSIONS
The formulation of a three-dimensional reinforced concrete finite beam element which considers both mechanical non-linearity, associated with the cyclic constitutive properties of the materials, and geometrical non-linearity, due to the second order effects, has been proposed. The structural hysteretic behavior is reproduced at the material level by means of proper cyclic constitutive laws of concrete and steel, which take also some local phenomena of interaction between them into account. For concrete, the model includes cracking and crushing, tension stiffening, confinement passive action of the stirrups and spalling of the concrete cover. For reinforcing steel, the model accounts for yielding, kinematic-isotropic hardening, saturation and memory of the plastic strains, and buckling of the bars. Prestressing can be also easily included. It is worth noting that the presented finite element is different from the so-called fiber elements, since the numerical integration is performed by higher order rules. In fact, in fiber elements the concrete cross-section is subdivided in small square areas (the fibers) and the function to be integrated is evaluated in their center of gravity. Within each fiber, such scheme is then equivalent to a one-point Newton-Cotes integration rule. On the contrary, in the element here proposed the concrete cross-section is subdivided in isoparametric sub-domains having quadrilateral cross-sections. Each sub-domain is then replaced by a grid of points which location is chosen according to the Gauss-Legendre or the Gauss-Lobatto integration rule. Such scheme has two main advantages. First, the use of quadrilateral isoparametric sub-domains allows a simpler and more accurate modeling of the geometry of complex cross-sectional shapes. Second and most
important, for a given number of integration points the Gauss rules leads to a higher accuracy if compared with the Newton-Cotes scheme, the more as the number of integration points increases. The formulation has been also extended to endow the finite element with an effective model of damage evaluation. In particular, a suitable set of multiscale damage indices defined at the material level and, progressively, at the sectional level, at the element level, and at the structural level, has been introduced. Such a measure of structural performance is consistent with the philosophy of the modern seismic codes, where the design requirements are specified in terms of acceptable levels of structural damage. The finite element has been validated with reference to a series of experimental static tests on reinforced concrete columns subjected to cyclic biaxial bending and axial load. Despite of some discrepancies related to failure mechanisms, such as bond-slip, not considered in the proposed formulation, the successful comparison of numerical and experimental results proves the effectiveness of the finite element in reproducing the cyclic response of reinforced concrete systems under complex loading histories. This candidates such element as a powerful tool for both static and seismic non-linear analysis of reinforced concrete structures, especially if joined to a proper measure of damage, as proposed in the present work. This has been also highlighted with a final application to the seismic analysis of a concrete bridge, for which an accurate measure and a comprehensive vision of the structural performance is achieved. ACKNOWLEDGEMENTS
The author wishes to thank Prof. Stathis Bousias who provided the database of the experimental results. REFERENCES 1. Biondini, F., Strutture da ponte soggette ad azioni di tipo sismico. Modellazione ed ottimizzazione. PhD Dissertation, Department of Structural Engineering, Politecnico di Milano, 2000 (in Italian). 2. Biondini, F., Martinez y Cabrera, F., Parisi, M.A., Optimization of Bridge Structures under Seismic Actions. Proc. of 3rd Int. PhD Symposium in Civil Engineering, Vienna, October 5–7, 2000. 3. Bolong, Z., Mingshun, W., Kunlian, Z., A Study of Hysteretic Curve of Reinforced Concrete Member Under Cyclic Loading. Proc. of the 7th World Conf. on Earthquake Engineering (WCEE), September 8-13, Instanbul, 6, 509-517, 1980. 4. Bontempi, F., Malerba, P.G., Romano, L., Formulazione diretta secante dell’analisi non lineare di telai in C.A./C.A.P., Studi e Ricerche, Graduate School for Concrete Structures, Politecnico di Milano, 16, 351-386, 1995 (in Italian). 5. Bousias, S.N., Verzeletti, G., Fardis, M.N., Gutierrez, E., Load-Path Effect in Column Biaxial Bending with Axial Force. ASCE Journal of Engineering Mechanics, 121(5), 596-605, 1995. 6. CEB, Seismic Design of Reinforced Concrete Structures for Controlled Inelastic Response. Bulletin 236, 240, 1997. 7. Filippou, F., Simulation of Hysteretic Behavior of RC Columns, Proc. of Structural Engineers World Congress (SEWC), Paper T153-3, San Francisco, July 18-23, 1998. 8. Giuffrè, A., Pinto, P.E., Il comportamento del cemento armato per sollecitazioni cicliche di forte intensità. Giornale del Genio Civile, 5, 391-408, 1970 (in Italian). 9. Goldberg, J.E., Richard, R.M., Analysis of Nonlinear Structures. ASCE J. of the Struct. Division, 89(4), 333-351, 1963. 10. Malerba, P.G. (Ed.), Analisi limite e non lineare di strutture in cemento armato. CISM, Udine, 1998 (in Italian). 11. Mander, J.B., Priestley, M.J.N., Park, R., Theoretical Stress-Strain Model for Reinforced Concrete. ASCE Journal of Structural Engineering, 114(8), 1804-1826, 1988. 12. Menegotto, M., Pinto, P.E., Method of Analysis for Cyclically Loaded Reinforced Concrete Plane Frames Including Changes in Geometry and Non-Elastic Behavior of Elements Under Combined Normal Force and Bending. Resistance and Ultimate Deformability of Structures Acted on by Well-Defined Repeated Loads, IABSE Symposium, 15-22, 1973. 13. Monti, G., Nuti, C., Nonlinear Cyclic Behavior of Reinforcing Bars Including Buckling. ASCE Journal of Structural Engineering, 118(12), 3268-3284, 1992. 14. Park, Y.-J., Ang, A.H.-S., Mechanistic Seismic Damage Model for Reinforced Concrete. ASCE Journal of Structural Engineering, 111(4), 722-739, 1985. 15. Popovics, S., A Numerical Approach to the Complete Stress-Strain Curve of Concrete. Cement and Concrete Research, 3, 583-599, 1973. 16. Powell, G.H., Allahabadi, R., Seismic Damage Prediction by Deterministic Methods: Concepts and Procedures. Earthquake Engineering and Structural Dynamics, 16, 719-734, 1988. 17. Stevens, N.J., Uzumeri, S.M., Collins, M.P., Analytical Modelling of Reinforced Concrete Subjected to Monotonic and Reversed Loadings. Department of Civil Engineering, University of Toronto, 87(1), 1987. 18. Wen, Y.-K., Stochastic Response and Damage Analysis of Inelastic Structures. Probabilistic Engineering Mechanics, 1(1), 49-57, 1986.