A Tale of Three Markets: Comparing the Renewable Energy Experiences of California, Texas, and Germany Felix Mormann, Dan Reicher, & Victor Hanna* The Obama administration has repeatedly identified the large-scale build-out of clean, renewable energy infrastructure as a key priority of the United States. The President's calls for a cleaner energy economy are often accompanied by references to other industrialized countries such as Germany, hailed by many as a leader in renewable energy deployment. Indeed, the share of renewables in Germany's electricity generation mix is twice that of the United States, and the ambitious "Energiewende" commits the country to meeting 80% of its electricity needs with renewables by 2050. While some praise the German renewables experience as successful proofof concept, others are concerned with the impact of ramping up renewables on electricity rates, the stability of the electric grid, and the internationalcompetitiveness of local industry. The mixed response to Germany's commitment to solar, wind, and other renewables raises questions as to how much and what, if anything, the United States can learnfrom Germany's renewable energy experiment-and vice versa. This Article seeks to answer some of these questions by comparing the German renewables experience to that of California and Texas, two leaders
*Felix Mormann is Associate Professor at the University of Miami School of Law and Faculty Fellow at Stanford Law School's Steyer-Taylor Center for Energy Policy and Finance. Dan Reicher is Executive Director of Stanford's Steyer-Taylor Center for Energy Policy and Finance, Professor of Practice at Stanford Law School, and Lecturer at Stanford's Gradtiate School of Business. Victor Hanna is Associate in the Energy & Infrastructure Finance Group at Wilson, Sonsini, Goodrich & Rosati. The authors wish to thank Marc Oliver Bettzfige, Christina Elberg, Felix H6ffler, andJakob Peter of the University of Cologne for their collaborative support. The lead author would like to thank participants in the Austin Electricity Conference, the Energy Policy Research Conference, and the University of Miami School of Law's faculty colloquium for their thoughtful feedback and comments. Financial support fiom E.ON Climate & Renewables North America is gratefully acknowledged.
STANFORD ENVIRONMENTAL LA WJOURNAL
56
[Vol. 35:1
in renewable energy deployment in the United States and globally, albeit with very different policy approaches and political leadership. California and Texas have had significant success in large-scale renewables but not without their own challenges. Our comparison of the renewable energy paths taken by what amount to three large and highly distinct "countries" elucidates some of the most prominent (and controversial)themes in the transatlantic renewables debate, including electricity costs, policy design, output intermittency, grid stability, and soft costs. As the Parisclimate accord and the Environmental ProtectionAgency's Clean Power Plan await implementation, we offer comparative insights and identify best practicesto guide policymakers and regulators in the transition toward a cleaner, more sustainable energy economy. I. INTRO D U CTIO N ........................................................
1I.
.
..............
57
GEOGRAPHY, ECONOMY, RESOURCE QUALITY, AND COST
III.
CHARACTERISTICS ...................................................................... ELECTRICITY MARKET FUNDAMENTALS ....................................
61 65
IV.
SOLAR PV AND ONSHORE WIND DEPLOYMENT IN NUMBERS .....
67
A. B.
Deployment Progress to Date ........................................ Energy Economy Implications .................... 1. G rid stability ............................................................ 2. Electricity rates ......................................................... 3. Job creation ..............................................................
68 71 71 71 74
V . PO LICY D RIVERS ............................................................................ 76
A. B. C. D.
United States Federal Tax Support for Renewable Energy Deploym ent ........................................................ California's Renewable Energy Policy ........................... Texas' Renewable Energy Policy .................................... Germany's Renewable Energy Policy .............................
VI. COMPARATIVE INSIGHTS AND BEST PRACTICES .........................
Favorable Treatment of Soft-Cost Factors Translates to H ard Savings .................................................................. High Penetration Rates of Intermittent Renewables B. Need Not Affect Grid Stability ...................................... C. Regulatory Approaches and Market Solutions to Balancing Output Intermittency ......... ,........................ D. The Importance of Policy Nuance and Diversity for a Mixed Renewables Portfolio .......................................... Putting Electricity Costs in Perspective ......................... E. V II. CONCLUSION ..........................................................................
76 77 80 81 83
A.
84 86 88 90 92 97
2016]
A TALE OF THREE MARKETS
I. INTRODUCTION
The Obama administration has repeatedly identified the largescale build-out of clean, renewable energy infrastructure as a key priority of the United States.' The President's calls for a cleaner energy economy are often accompanied by references to other industrialized countries such as Germany, the world's fourth largest economy, 2 hailed by many as a leader in renewable energy deployment and proof of concept. Indeed, the share of renewables in Germany's electricity generation mix (28%) 3 is twice that of the United States (14%), 4 and the ambitious "Energiewende"5 commits the country to meeting 80% of its electricity needs with renewables by 2050.6 The German renewables experience, however, is not without its critics. Some praise the country's "healthy Feed-in Tariff" and the resulting "proliferation of solar systems" while applauding the German electrical grid as "very reliable and able to withstand high penetrations of variable generation." 7 Others consider it "clear that the transformation, if plausible, will be wrench-
1. See, e.g., President Barack Obama, State of the Union Address (Jan. 25, 2011), http://www.whitehouse.gov/the-press-office/2011/01/25/remarks-president-state-unionaddress (referencing "the promise of renewable energy"); President Barack Obama, State of the Union Address (Jan. 24, 2012), http://www.whitehouse.gov/the-pressoffice/2012/01/24/remarks-president-state-union-address ("I will not walk away from the promise of clean energy .... I will not cede the wind or solar or battery industry to China or Germany because we refuse to make the same commitment here."). GDP Ranking, WORLDBANK.ORG, The World Bank, 2. See http://data.worldbank.org/daa-catalog/GDP-ranking-table (last visited Dec. 31, 2015). 3. SeeJohn Pang et al., Gernany's Energewende, 152 No. 11 PUB. UTIL. FORT. 14, 15 (2014) (citing to German power market data for the first three quarters of 2014); see also AGORA ENERGIEWENDE, THE ENERGIEWENDE IN THE POWER SECTOR: STATE OF AFFAIRS
2014, at 12 (2015) (pegging the share of renewables in Germany's 2014 domestic electricity consumption at 27.3%). 4. See Kenneth Bossong, U.S. Renewable Electrical Generation Htits14.3 Percent, RENEWABLEENERGYWORLD.COM (Aug. 27, 2014), http://www.renewableenergyworld.com/ (citing to rea/news/article/2014/08/us-renewable-electrical-generation-hits-14-3-percent Energy Information Administration data for the first two quarters of 2014). 5. For an introduction to Germany's ambitious energy policy, sometimes translated as "energy transition," see FEDERAL MINISTRY OF ECONOMICS AND TECHNOLOGY, GERMANY'S NEW ENERGY POLICY (2012), http://www.bmwi.de/English/Redaktion/Pdf/ germanys-new-energy-policy. Year, 26 ELECTRICITYJ. 6. See, e.g., Dagmar Dehmer, The German Energiewende: The First 71, 71 (2013). 7. Pang etal., supra note 3, at 15.
58
STANFORD ENVIRONMENTAL LAWJOURNAL
[Vol. 35:1
ing" as "German families are being hit by rapidly increasing electricity rates" and "businesses are more and more worried that their energy costs will put them at a disadvantage to competitors in nations with lower energy costs." 9 The mixed response to Germany's commitment to solar, wind, and other renewables raises questions as to how much and what, if anything, the United States can learn from Germany's renewable energy experiment-and vice versa. This Article seeks to answer some of these questions by comparing the German renewables experience to that of California and Texas, ranked eighth and twelfth, respectively, among global economies. All three economic powerhouses have made great progress in the transition toward a more renewables-based, low-carbon energy economy. But each has done so following its own policy approach and operating in very different political and regulatory environments. Our comparison of the renewable energy paths taken by what amount to three large and highly distinct "countries" sheds important light on some of the most prominent (and controversial) themes in the transatlantic renewables debate, including electricity costs, policy design, output intermittency, grid stability, and soft costs. Our work helps put electricity costs and their complex relationship with the renewable energy build-out on both sides of the Atlantic in perspective. The New York Times, the Wall StreetJournal, and others have pointed to Germany's high electricity rates as proof that the country's renewables policy is not working.' 0 Our analysis confirms that Germany's retail rates for residential customers are two to three times as high as those in California or Texas." But we also find that industrial ratepayers in Germany, who are exempt from financing the country's feed-in tariffs for renewables, actually pay less for electricity than their counterparts in California and Texas. 12 Moreover, higher residential electricity rates in Ger8. Justin Gillis, Sun and Wind Aller Global Landscape,Leaving Utilities Behind, N.Y. TIMES (Sept. 14, 2014), http://www.nytimes.com/2014/09/14/science/eath/sun-and-windalter-german-landscape-leaving-utilities-behind.html? r= 1. 9. Melissa Eddy & Stanley Reed, (,enany s Lffo~rt at Clean Eneigy Proves Complex, N.Y. TIMES (Sept. 19, 2013), http://www.nvtimes.com/2013/09/19/world/europe/gernanyseffort-at-clean-energy-proves-conplex.html?pagewanted%3Dall&_r=0&pagewanted=print; see also Matthew Karnitschnig, Gernmanrs Expensive Gand~le on Renewable Feig,,WALL ST. J. (Aug. 26, 2014), http://www.wsj.com/artices/germanys-expesive-gamble-on-renewableenergy-1409106602. 10. See supra notes 8-9 and accompanying text. 11. lnfia Section IV.B.2. 12. Infra Section IV.B.2.
2016]
A TALE OF THREE MARKETS
many have helped encourage greater energy efficiency as envisioned by the German policymaker such that average monthly household electricity bills in Germany are only slightly higher than 3 those in California and are, in fact, lower than in Texas. 1 We also address common concerns that ramping up the share of weather-dependent, intermittent renewables like solar and wind inevitably jeopardizes the stability of the electric grid. Our data suggests the opposite. After all, Germany tripled the amount of electricity generated from solar and wind to a market share of 26% while actually reducing annual average outage times in its grid.1 4 California, too, actually managed to lower average service interruption times, while more than tripling the amount of electricity produced from solar PV and onshore wind to a joint market share of 8%.15 Only Texas experienced an increase in average outage times while ramping up its wind-generated electricity share six-fold to 10%.16 The impressive grid stability numbers of Germany and California should not be misconstrued as a sign that an electrical grid with a significant share of renewable energy is easy to operate. As we show, they are the result of targeted measures, ranging from regulatory mandates to market-based incentives. 17 Another intriguing, counter-intuitive insight from our analysis relates to the cost of generating electricity from renewables. Germany gets about as much annual sunshine as Alaska and little more than half as much as California and Texas.' 8 Yet, despite the country's relatively poor solar resource quality, German solar installations manage to generate electricity at an overall cost that is comparable to that of Texas and only slightly higher than California facilities. 19 Our analysis suggests that Germany makes up for its deficits in solar resource quality through favorable treatment of "soft costs" such as the cost of financing, permitting, installation, and grid access.20 Finally, our work underscores the importance of nuanced policy support in order to promote a diverse portfolio of renewable
13. 14. 15. 16. 17. 18. 19. 20.
h 'fra Section VI.E. InfraSectionsW.B.I.,VI.B. InfraSections V.B.I.,VI.B. Infra Sections IV.B. I., VI.B. Infra Section VI.C. hifra Section II. hfra Section II. hfra Section VI.A.
60
STANFORD ENVIRONMENTAL LA WJOURNAL
[Vol. 35:1
energy technologies. Germany and California have achieved significant deployment of both solar and wind generation assets each using a suite of technology-specific policy measures custom-tailored to the specific needs of either technology. 2' In contrast, Texas' reliance on a single, technology-neutral policy to create a market for all renewables has been highly successful in ramping up the share 22 of wind energy but has supported very little solar deployment. The following qualitative analysis builds on three case studies undertaken by Stanford University's Steyer-Taylor Center for Energy Policy and Finance and the University of Cologne's Institute of Energy Economics in Germany. Researchers from Cologne studied Germany while Stanford's team examined California and Texas. The choice of comparing Germany's national renewables experience to that of two states within the United States was prompted by the critical importance of state energy markets and policies for United States renewable energy deployment. Unlike Germany, the United States lacks a comprehensive federal policy for renewable energy beyond R&D expenditures and tax incentives that have waxed and waned in recent decades. Congressional deadlock, as evidenced by dozens of failed legislative proposals 23, has left it to the states to fill the gaps in federal renewables policy, with California and Texas leading the charge. In light of their dominant role in both states, the following analysis places special emphasis on the service territories of the California Independent System Operator (CAISO) and the Electric Reliability Council of Texas (ERCOT). From a technology perspective, this Article focuses on onshore wind and solar photovoltaic (PV) technologies as both have recently exhibited the highest growth rates among renewables and, due to their intermittency, present the greatest challenges for successful grid integration. Due to this narrow focus, our analysis does not Germany's of whether broader question the address the concurpower and of nuclear its phase-out Energiewende-with rent rise in the use of coal and lignite-offers an effective approach to reducing the country's overall greenhouse gas emissions. Similarly, the study does not consider carbon emissions reductions in California and Texas, where coal, natural gas, nuclear energy, and hydropower have complex trajectories. 21. I!fta Section VI.D. 22. hInfa Section VI.D. 23. See Lincoln L. Davies, Power Folrward: The A'igumeatfor a National RI'S, 42 CONN. L. REv. 1339 (2010).
2016]
A TALE OF THREE MARKETS
Case studies were assembled based on review of the pertinent academic literature as well as publicly available data, reports, and publications from regulatory agencies at the state and federal levels. To gather critical stakeholder input, Stanford's Steyer-Taylor Center for Energy Policy and Finance hosted a workshop in September 2014 that brought together senior policymakers, regulators, utility executives, analysts, investors, and academics from California, Texas, and Germany to discuss and compare the renewable energy experiences of all three jurisdictions. The accuracy and value of any cross-jurisdictional policy comparison depends on the extent to which the underlying analysis recognizes and accounts for policy-independent differences between jurisdictions. To this end, this Article begins with a brief survey of the diverse geography, economy, and renewable resource quality of California, Texas, and Germany (infra II.), followed by an overview of the electricity markets in the three jurisdictions (infra IX.). This background information sets the stage for a discussion of each jurisdiction's deployment experience to date (infra TV.) and the policy drivers behind it (infra V). A comparison of the deployment successes and challenges as well as the underlying policy choices across all three jurisdictions allows us to dispel popular myths and misconceptions, identify best practices, and offer insights for the sustainable and sustained build-out of renewable energy in the United States and elsewhere (infra VI.). In recognition of every jurisdiction's unique combination of resource, technology, market, and policy factors, we refrain from issuing universal policy recommendations. II. GEOGRAPHY, ECONOMY, RESOURCE QUALITY, AND COST CHARACTERISTICS
California is the most populous state in the United States, with a population of nearly 39 million, as of 2014, spread over an area of 155,779 square miles. 24 Home to a population of approximately 27 million, Texas is the second most populous state and covers the largest area of any state in the contiguous United States at 261,232 square miles. 25 Smaller in surface area than either California or Texas, Germany covers 137,903 square miles, yet is home to over Quickhacts, CENSUS.GOV, Calrn'tia 24. See U.S. Census Bureau, quickfacts.census.gov/qfd/states/06000.html (last visited Dec. 31, 2015). CENSUS.GOV, QuickFacts, Texas Bureau, Census U.S. 25. See quickfacts.census.gov/qfd/states/48000.html (last visited Dec. 31, 2015).
http:// http://
62
STANFORD ENVIRONMENTAL LA WJOURNAL
[Vol. 35:1
80 million people. 26 In terms of the size of their economies, Germany ranks fourth among nations globally with a 2014 GDP of $3.73 trillion. 27 California and Texas, if they were independent countries, would rank eighth (2014 GDP of $2.31 trillion) 28 and twelfth (2014 GDP of $1.65 trillion) 29 respectively.
now.,,jy
*
rpm~
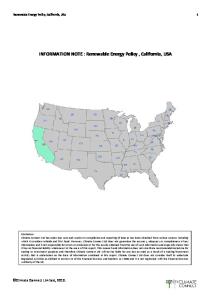
Figure 1: Map of Solar PV Resource Quality: United States and 30 Germany Based on average global annual solar irradiance on a horizon26. See Destatis Statistisches Bundesarnt, Slate & Swieltv-Pe/ulation, DESTATIS.DE, https://www.destatis.de/DE/Zah lenFakten /GesellschaftStaat/Bevoelkerung/Bevoelkerun gsstand/Tabellen/Zensus-Geschlecht Staatsangehoerigkeit'html (population) (last visited Dec. 31, 2015); THE WORLD BANK, Surace Area by (ountry, WORLDBANK.ORG, http://data.worldbank.org/indicator/AG.SRF.TOTL.K2 (surface area). http:// Bank, GDJP Ranking, WORLDBANK.ORG, World The 27. See data.worldbank.org/data-catalog/GDP-ranking-table (last visited Dec. 31, 2015). 28. See U.S. BUREAU OF ECON. ANALYSIS, Table 4. Current Dollar GDP By Slate, 20112014, http://www.bea.gov/ newsreleases/iregional/gdpstate/201 5/xls/gspO6l5.xlsx (last visited Dec. 31, 2015). State GDP data reflect advance statistics for calendar year 2014. 29. See U.S. Energy Info. Admin., Texas State Eneig) IProfile, EIA.GOV, http://www.eia.gov/state/print.cfin?sid=TX (last visited Dec. 31, 2015). 30. Adapted from KRISTEN ARDA 'NI & ROBERT MARGOLIS, NAT'L RENEWABLE ENERGY LAB., 2010 SOLAR TECHNOLOGIES MARKET REPORT 53 (2011), http://www.nrel.gov/ docs/fyl 2osti/51847.pdf.
A TALE OF THREE MARKETS
2016]
tal level, the mean solar resource qualities of California (178 kWh/ft2) and Texas (171 kWh/ft 2 ) 3 are significantly higher than that of Germany (98 kWh/ft2 ) .32 Figure 1 illustrates these differences in solar resource quality. Remarkably, solar PV installations in Germany have a levelized cost of electricity33 (LCOE) similar to those observed in California and Texas-despite the country's significantly poorer solar resource (see Figure 2).34 In fact, Germany's range of LCOE for solar PV (10.4-18.9 $cents/kWh) 35 was only slightly higher than that of the United States Southwest, which includes California (9.1-17.6 $cents/kWh), and marginally lower than that of Texas (10.4-19.5 $cents/kWh).3 6 At a time when solar panels, inverters, and other hardware trade at similar prices across the globe, Germany's sur-
31.
See
NAT'L
RENEWABLE
ENERGY
LAB.,
SOLAR
SUMMARIES
(2014),
http://
www.n rel.gov/gis/docs/SolarSummaries.xlsx. 32. See FRAUNHOFER ISE, RECENT FACTS ABOUT PHOTOVOLTAICS IN GERMANY 32 (2015), https://www.ise.fraunhofer.de/en/publications/veroeffentlichungen-pdf-dateienen/studien-und-konzeptpapiere/recent-factsabout-photovoltaics-in-germany.pdf 33. The LCOE metric represents the cost per kWh of electricity generated based on a power plant's capital costs, fuel costs, fixed and variable costs for operation and maintenance (O&M), and financing costs over the operational life of the plant. U.S. ENERGY INFO. ADMIN., LEVELIZED COST AND LEVELIZED AVOIDED COST OF NEW GENERATION RESOURCES IN THE ANNUAL ENERGY OUTLOOK 2015, at 1 (2015), http://www.eia.gov/ forecasts/aeo/pdf/electricity-generation.pdf. Notwithstanding occasional criticism of LCOE as an imperfect metric, it is a widely used metric among investors, developers, and other key stakeholders in the renewable energy marketplace. Id. at 1-2. 34. It should be noted that the surprising similarity of LCOE numbers may, in part, be the result of differing assumptions underlying the two cited studies. At the same time, differing assumptions, e.g., as to the cost of capital, may represent actual differences between regions. Importantly, both studies appear to adhere to the prevailing methodology for calculating LCOE, as described in greater detail at Nat'l Renewable Energy Lab., SAM Help: Levelized Cost of Energy (LCOE), NREL.GOV, https://www.nrel.gov/analysis/sam/help/ html-php/index.html?mtf_lcoe.htm (last visited Dec. 31, 2015). The spread of LCOE ranges in both studies reflects the inclusion of a variety of project sizes (small-scale to utility-scale), project sites, and other project-specific parameters. Impoitantly, both studies depict LCOE ranges before consideration of applicable tax benefits. 35. See CHRISTOPH KOST ET AL.,
FRAUNHOFER ISE,
STROMGESTE-UNGSKOSTEN
ERNEUERBARE ENERGIEN 3 (2013), http://www.ise.fraunhofer.de/de/veroeffendichun gen/veroeffentlichingen-pdf-dateien/studien-tnd-konzeptpapiere/stdie-stromgest ehungskosten-erneuerbare-energien.pdf/. To convert Euros to U.S. Dollars, we utilize a conversion rate of 0.783 for the year 2013. Internal Revenue Serv., Yearly Average Curiency IRS.Gov, Into U.S. Dollm, Translating Foreign ('urrem.y Exchange Rates http://www.irs.gov/Individuals/In ternationa-Taxpayers/Yearly-Average-Curren cyExchange-Rates (last visited Dec. 31, 2015). 36. LAZARD, LAZARD'S LEVELIZED COST OF ENERGY ANALYSIS: VERSION 7.0, at 7 (2013), http://galleiy.mailchimp.com/ce17780900c3d223633ecfa59/files/LazardLevel izedCost of Energy-y7.0.l.pdf.
64
[Vol. 35:1
STANFORD ENVIRONMENTAL LA WJOURNAL
prisingly competitive LCOE numbers point to other factors at play than hard costs alone (see infra Section V.1). In terms of onshore wind resource quality, California and Texas again beat Germany, albeit by a considerably smaller margin than for solar resource quality. At 80m above ground, average onshore wind speeds are highest in Texas (5-10 m/s), closely followed by California (4-10 m/s) and Germany (5-8 m/s). 37
Ca1liriag &
9.1
17.6
Texas 19.5
10.4
o02
10.41
Solar PV- LCOE [$cents/kWh]
18.9 20
38 Figure 2: Range of LCOE (2013): Solar PV
Compared to their relatively similar onshore wind resource endowment, the spread across the three jurisdictions widens somewhat for LCOE numbers with Texas (5.1-7.4 $cents/kWh) showing the lowest cost range followed by Germany (5.9-14.2 $cents/kWh) and the United States Southwest, including California (6.4-9.5 $cents/kWh) (see Figure 3).39 In light of globally de37. See U.S. Dep't of Energy, WNDExchange: California Wind Re.ource Map and Pote-ntial Wind Capacity, ENERGY.GOv, http://apps2.eere.energy.gov/wind/windexchange/ wind-resource.maps.asp?stateab=ca (last visited Dec. 31, 2015) (California); U.S. Dep't of Energy, WINDExchange: Texas Wind Resource Map and Potential Wind (;aacity, ENERGY.GOV, http://apps2.eere.energy.gov/wind/windexchange/wind-esouice-maps.asp?stateab=tx (last visited Dec. 31, 2015) (Texas); KOST ET AL., supra note 35, at 13 (Germany).
38. At the time of writing, 2014 solar PV LCOE numbers were not yet available for Germany. An apples-to-apples comparison, therefore, requires the use of 2013 numbers for Figure 2. As expected, solar PV LCOE numbers continued to decline through 2014 in the U.S. Southwest, including California (7.9-16.8 $cents/kWh), and in Texas (9.0-18.6 $cents/kWh). See LAZARD, LAZARD'S LEVELIZED COST OF ENERGY ANALYSIS-VERSION 8.0, at 8 (2014), http://www.lazard.com/media/1777/levelized cost-ofen-er,-7..version_ 80.pdf. 39. See KOST ET AL., snpra note 35, at 3 (Germany); LAZARD, supra note 36, at 7 (California and Texas). For conversion from Euros to U.S. Dollars, see Internal Revenue Serv., su/ira note 35.
2016]
A TALE OF THREE MARKETS
clining hardware prices and related advances in all three jurisdictions, 2013 LCOE numbers no longer accurately reflect today's cost of generating electricity from solar PV and onshore wind. With more recent LCOE data not yet available for Germany, however, 2013 numbers offer the most up-to-date basis for an apples-toapples LCOE comparison among all three examined jurisdictions.
6.4
5.11
&U
I eman 1 14.2 16
Onshore Wind - LCOE [$cents/kWh]
0
Figure 3: Range of LCOE (2013): Onshore Wind III.
40
ELECTRICITY MARKET FUNDAMENTALS
Since the 1990s, electricity markets in California, Texas, and Germany have experienced differing degrees of liberalization. In response to the European Commission's directive 96/92/EC, Germany unbundled its electricity market to separate generation from transmission and distribution assets. 4 1 Today, four Transmission System Operators (TSOs) and over 800 Distribution System Operators (DSOs) manage and operate Germany's electricity grid under the supervision of the Federal Network Agency. 42 Around 40. At the time of writing, 2014 onshore wind LCOE numbers were not yet available for Germany. An apples-to-apples comparison, therefore, requires the use of 2013 numbers. As expected, onshore wind LCOE numbers continued to decline through 2014 in the Southwest (5.5-8.1 Scents/kWh) and in Texas (4.3-6.1 Scents/kWh). LAZARD, supra note 38, at 8. 41. See TORSTEN BRANDT, LIBERALISATION, PRIVATISATION AND REGULATION IN THE
GERMAN ELECTRICITY SECTOR 2 (2006), www.boeckler.de/pdf/wsi-pj-piq-sekstrom.pdf. Even though directive 96/92/EC required merely "legal unbundling," two out of today's four TSOs opted for the more restrictive "ownership unbundling." See AGORA ENERG1WIENDE,
REPORT
ON
THE
GERMAN
POWER
SYSTEM
8
(2015),
http://
www.agora-energiewende.de/fileadmi n/downloads/publikationen/CountryProfiles/ Agora CP Germanyweb.pdf. 42.
See BUNDESNETZAGENTUR,
MONITORINGREPORT
2013, at 25 (2014),
http://
66
STANFORD ENVIRONMENTAL LA WJOURNAL
[Vol. 35:1
the same time as Germany's unbundling, the Public Utility Commission of Texas (PUCT) used its rulemaking authority to turn ERCOT into the United States' first unbundled transmission and, eventually, distribution network, serving 90% of Texas load. 43 In the wake of the Federal Energy Regulatory Commission's (FERC) Order Number 888, California also unbundled most of the state's transmission assets in 1998 to create CAISO, which manages and operates 80% of California's transmission grid.4 4 Unlike in Germany and Texas, however, California's distribution networks continue 45 to be owned and operated by the state's utilities. California, Texas, and Germany all operate wholesale market exchanges for spot and forward electricity trades4 6 but reliance on these exchanges is minimal. In CAISO, 97% of electricity is traded47 in bilateral transactions outside of the state's market exchanges. Similarly, 94-96% of ERCOT's load is served based on bilateral, over-the-counter trades outside of market exchanges with trades www.bindesnetzagentur.de/SharedlDocs/Downloads/EN/BNetzA/PressSection/ ReportsPnblications/2013/MonitoringReport2013.pdf?_blob=pUblicationFile&v= 10. 43. See David Spence & Darren Bush, Why Does ERCOT Have Only One Reg lator?, in ELECTRICITY RESTRUCTURING: THE TEXAS STORY 9, 11 (L. Lynne Kiesling & Andrew N.
Kleit eds., 2009). In 1996, the PUCT exercised its rulemaking authority to turn ERCOT into the first independent system operator in the U.S., giving ERCOT the responsibility to oversee Texas' wholesale market and to ensure the efficient use of the state's transmission network. Id. at 14. See also ERCOT, QUICK FACTS 1 (2014) [hereinafter ERCOT Quick Facts], http://www.ercot.com /con tent/news/ppresen tations/2015/ERCOTQtickFacts_ 1615.pdf.
44. See Lorenzo Kristov & Stephen Keehn, From the Brink of Abyss to a Green, Clean, and Smart Future: The Evolution f Californias lectricity Market, in EVOLUTION OF GLOBAL ELECTRICITY MARKETS: NEW PARADIGMS, NEW CHALLENGES, NEW APPROACHES 297, 299
(Fereidoon P. Sioshansi ed., 2013); see alio Cal. Indep. Sys. Operator, Undeistandingthe ISO, CAISO.cOM, https://www.caiso.com/about/Pages/OurBusiness/UnderstandingthelSO/ The-ISO-grid.aspx. 45. See Cal. Energy Comm'n, Gdhf!nrnia MaJar Electric Tansmnissia. Lines, CA.Gov, http://wA.energy.ca.gov/maps/infrastructure/transmissionlines.html (last visited Dec. 31, 2015). 46. See FED. MINISTRY FOR ECON. AFFAIRS & ENERGY, Zweiter Monitoring-Bericht: "Energie der Zukunft" [Second Monitoring Rlort: "Eneig, of the lutue"] 53 (2014), http://wvw.bmwi.de/BMWi/Redaktion/PDF/Publikationen/zweite-monito-ing-bericht(Germaenergie-der-ztiktinft,prope rty=pdf,bereich=bmwi2012,spiache=de,rwb=true.pdf ny); FED. ENERGY REG. COMM'N, ENERGY PRIMER: A HANDBOOK OF ENERGY MARKET BASICS
79 (2012), http://www.ferc.gov/market-oversight/guide/energy-primer.pdf (California); Steven L. Puller, Competitive Petforrnance of the ERCOT Wholesale Market, in ELECTRICITY RESTRUCTURING: THE TEXAS STORY 138, 140 (L. Lynne Kiesling & Andrew N. Kleit eds., 2009) (Texas). 47. See CAL. INDEP. SYS. OPERATOR, 2013 ANNUAL REPORT ON MARKET ISSUES & http://www.caiso.com/Documents/2013AnntialReport(2014), 61 PERFORMANCE Marketlssue-Performance.pdf.
2016]
A TALE OF THREE MARKETS
ranging from one-day deals to multi-year, long-term transactions. 48 Closely behind, 93% of Germany's electricity is traded in bilateral, over-the-counter transactions. 49 ERCOT's service territory is divided into four bidding zones and CAISO into three bidding zones, while Germany consists of a single unified bidding zone. 50 Both CAISO and ERCOT have begun moving toward "locational marginal pricing" to better account for and ultimately remedy bottlenecks in their electrical grids.5" Retail electricity rates are still subject to cost-of-service regulation by the California Public Utilities Commission (CPUC). 52 In contrast, Texas and Germany have both introduced competition among retail providers of electricity, 53 albeit with vastly differing effects on consumer retail choice. More than 90% of ERCOT's retail electricity customers have switched providers, compared to 54 fewer than 10% of retail customers switching in Germany. IV. SOLAR PV AND ONSHORE WIND DEPLOYMENT IN NUMBERS
Over the past three years, California, Texas, and Germany have all celebrated milestones in terms of market penetration of solar PV and onshore wind. CAISO logged a maximum instantaneous generation share of solar PV and onshore wind accounting for 5 26% of system-wide load one Saturday afternoon in April 2014.1 48. See Puller,supra note 46, at 138-39. 49.
See FED. MINISTRY FOR ECON. AFFAIRS & ENERGY, supra note 46, at 53.
50. See FED.
ENERGY REG. COMM'N, TEXAS ELECTRIC MARKET: OVERVIEW AND FOCAL
http://www.ferc.gov/market-oversight/mkt-electric/texas/201 I/ POINTS 1 (2011), 08-2011-elec-tx-archive.pdf (Texas); FED. ENERGY REG. COMM'N, sunna note 46, at 79 (California); FED. MINISTRY FOR ECON. AFFAIRS & ENERGY, supfra note 46, at 97 (Germany).
51. SeePress Release, ERCOT, ERCOT Launches Improved Wholesale Market Design (Dec. 1, 2010), http://www.ercot.com/news/press releases/show/349 (Texas); Locational Marginal Pricing, CAL. PUB. UTIL. COMM'N, http://www.cpuc.ca.gov/PUC/energy/ wholesale/Olacawholesale/MRTU/01!mp.htm (last visited Dec. 31, 2015) (California). 52. PUBLIC
See CAL. PUB. UTIL. COMM'N, REGULATORY RESPONSIBILITIES OF THE CALIFORNIA http://www.cpucca.gov/NR/rdonlyres/ 1 (2014), UTILITIES COMMISSION
7EA9B970-6827-4C89-9D2C-38DD8DE50428/0/CPUCRegulatoryResponsibilities04l4.pdf. 53. See Spence & Bush, supra note 43, at 14 (Texas); BUNDESNETZAGENTUR, supra note 42, at 14 (Germany); G. Brunekreeft & D. Bauknecht, Eneigy Policy and Investme.l in Ihe German Power Market Electricity, in ELECTRICITY MARKET REFORM: AN INTERNATIONAL PERSPECTIVE 240-41 (Fereidoon P. Sioshansi & Wolfgang Pfaffenberger eds., 2006) (Germany). 54. See ERCOT Quick Facts, srulra note 43, at I (Texas); BUNDESNETZAGENTUR, su/pra note 42, at 14 (Germany). 55. Stanford calculations based on CAISO generation data. It should be noted that CAISO generation data do not include output from distributed solar PV capacity located "behind the meter." See discussion irfra Section IV.A.
68
STANFORD ENVIRONMENTAL LA WJOURNAL
[Vol. 35:1
One morning in March of the same year, ERCOT covered a record 38% of its system-wide load with wind-generated electricity. 56 Leading the pack, Germany's instantaneous generation share from solar PV and onshore wind peaked at 71% on a particularly sunny and windy afternoon in June of 2013.57 More than mere snapshots, these numbers speak to both the considerable deployment progress to date (infra A.) and the diverse implications of the largescale build-out of solar PV and onshore wind power assets for the energy economies of California, Texas, and Germany (infra B.). A. Deployment Progressto Date At the end of 2014, California was home to 6.4 GW of onshore wind generation capacity and 4.6 GW of solar PV capacity, accounting for 8.1% and 5.9%, respectively, of the state's total electricity generation capacity of 79 GW. 58 In 2014, onshore wind contributed 12,908 GWh (6.5%) and solar PV contributed 8,741 GWh (4.4%) to California's total in-state generation of 198,000 GWh (see Figure 4) .59
7
*
6
2
12,020
-4,000 I
0
14,000
I
_ I
I
2001 2002 2003 2004 2005 2006 2007 2008 2009 2010 2011 U WindCapacity [GW] Solar Capacity [GW] - Wind Generation [GWh]
,12,000 000 2012 2013 2014 Solar Generation [GWh]
-
Source Sryer TaylorCenz'e awoProadedbyCPUC
Figure 4: Solar PV and Onshore Wind Capacity and Generation: California
56. See ERCOT News Release, Wind Generation On//pul in ERCOT 7rIs 10,000 MW, Breaks Recd, Mar.28, 2014, http://www.ercot.com/news/press~releases/show/2661 1. 57. University of Cologne calculations based on Germany power market data, https://wwv.energy-charts.de/pow.erde.htm. 58. S5ee CAL. ENERGY COMM'N, 2014 QFER FILINGS (2015) [hereinafter 2014 QFER FILINGS], on file with atithors; see also Cal. Solar Statistics, Cal~inrnia Solar Stalislics, https://www.californiasolarstatistics.ca.gov/reports/nonthly-stats/ (last visited Dec. 31, 2015). 59. See 2014 QFER FILINGS, sUirua note 58.
2016]
A TALE OF THREE MARKETS
Data regarding electricity generation is not readily available for approximately 0.3 GW of California's solar PV capacity, which is made up of distributed solar facilities that are customer-owned and located "behind the meter." Overall, natural gas continued to dominate California's electricity generation mix in 2014, account60 ing for 61% of all generation. In Texas, ERCOT had 12.5 GW of onshore wind capacity and less than 0.4 GW of solar PV capacity in 2014, accounting for 14.5% and 0.5%, respectively, of ERCOT's total electricity generation capacity of 86.2 GW.61 Texas wind generators contributed 36,000 GWh (10.6%) to ERCOT's 2014 aggregate in-state electricity generation of 340,000 GWh (see Figure 5) .62 The tiny build-out of Texas solar PV capacity likely reflects several policy and market factors discussed below. 63 Overall, ERCOT generates most of its electricity from natural gas (41%) and coal (36%).64 GW
h
12
40,000
10
35,090 30,000 .
25.000
S120,000 15,000
4
10,000 0
2002
2003
2004
2005
2006
2007
E Wind Capacity [GW]
2008
2009
2010
2011
2012
2013
2014
5,000 0
-Wind Generation [Wh]
Source: Stelyr-rTbor CenterCato Prorded by ERCOT
Figure 5: Onshore Wind Capacity and Generation: ERCOT At the end of 2014, Germany's installed wind capacity totaled
60. Id. 61. See ERCOT, HISTORICAL CAPACITY BY FUEL TYPE (MW) (2015), on file with authors (listing solar among "other" generation sources accounting for an overall capacity of 0.4 GW). 62. See ERCOT, 2014 DEMAND AND ENERGY REPORT (2014) [hereinafter ERCOT 2014 http://www.ercot.com/content/news/presentations/ Denand and Energy Report], 2015/ERCOT2014D&E.xls. 63. See discussion infra Section V.C. 64. See ERCOT 2014 Demand and Energy Repart, supra note 62.
STANFORD ENVIRONMENTAL LA WJOURNAL
70
[Vol. 35:1
40.5 GW, while solar PV capacity amounted to 38.2 GW. 65 Unlike California and Texas, Germany's wind power portfolio includes a growing number of offshore wind installations, delivering 1,300 GWh in 2014.66 In terms of generation, onshore wind generators delivered nearly 55,000 GWh (8.9%) and solar PV provided 35,000 GWh (5.7%) of Germany's total 2014 electricity output of 614,000 GWh. 67 The substantial difference in generation (GWh) between wind and solar in Germany, despite almost identical capacity numbers (GW), reflects the relatively low quality of the German solar resource, which has been likened to that of Alaska. 68 Overall, the single largest source of German electricity generation is lignite (25%), followed by coal (18%) and nuclear (16%).69 GWh
GW 45 ,
60 00
[ ,0
40, -50,000
351 25!
30,000
20! 151
20,000
101 5 1 20X0
0,0 2001 2002 2003 2004
N Wind Capacity [GW]
2005 2006 2007 2008
Solar Capacity [GW]
-
2009 2010 2011
Wind Generation [GWhl
20i2 2013 2014 Solar Generation [GWh]
Sou'ce E & &EyerTalor CterD= PrMed tr 4BM/ &AGE
Figure 6: Solar PV and Onshore Wind Capacity and Generation: Germany
65. See FED. MINISTRY FOR ECON. AFFAIRS & ENERGY, TOTAL OUTPUT OF ENERGY DATA-DATA COLLECTION OF THE BMWI, http://bmiwi.de/BMWi/Redaktion/Binaer/
energie-daten-gesamt,property=blob,bereich=bnwi2Ol2,sprachle=de,rwb=tr ue.xls (last visited Dec. 31, 2015). 66. See AG Energiebilanzen e.V., Stromezeguogag nach E'neigietriigern 1990-2014, AChttp://www.ag-energiebilanzen.de/index.php?articleid= ENERGIEBILANZEN.DE, 29&fileName=20151112 brd-stromerzeugungl990-2014.pdf (last visited Dec. 31, 2015). Generation figures for 2014 are preliminary and partly estimated. 67. Id. 68. See Brad Plumer, Germany lHas Five Times As Much Solar Power As the U.S.-Despite (Feb. 8, 2013), SuMn, WASH. POST Alaska Levels of h ttp://www.washingtonpost.com/blogs/won kblog/wp/2013/02/08/ger-many-has-fivetimes-as-i uch-solar-power-as-the-u-s-despite-alaska-levels-of-sun/; see also supra Figure 1. 69. SeeAG Energiebilanzen e.V., supra note 66.
2016]
A TALE OF THREE MARKETS
B. Energy Economy Implications The large-scale build-out of solar PV and onshore wind generation affects local energy economies in a variety of ways. The most prominent and, in some cases, most controversial implications relate to electrical grid stability (infra 1.), electricity rates (infra 2.), and job creation (infra 3.). 1. Grid stability. The electrical grid's stability is commonly measured by the System Average Interruption Duration Index (SAIDI), which denotes the average service interruption time to consumers in the low- and medium-voltage grid as a result of causes other than "major events." 70 For 2013, California's three large investor-owned utilities (IOUs) reported an average SAIDI of 90 minutes, 7' while Texas utilities posted an average SAIDI of 128 minutes. 72 Germany, meanwhile, reported a SAIDI of just over 15 minutes in 2013, the latest year for which figures are available, 73 despite having the highest capacity and generation shares of intermittent solar PV and onshore wind power of all three jurisdictions (see Figure 7). Together, these numbers cast doubt on frequently raised concerns that high penetration levels of intermittent renewables inevitably threaten the stability of the electrical grid, as discussed in further detail below.74
2. Electricity rates. 70. It should be noted that the definition of "major events" varies slightly across jurisdictions. All three jurisdictions exclude earthquakes, major storms, and similar natural disasters from their SAIDI reporting but differ slightly in the threshold requirements for such "major events." See Cal. Pub. Util. Comm'n, Commission Order Instituting Investigation Into the Rates, Charges, Service and Practices of Pacific Gas & Electric Company, Decision No. 96-09-045, Appendix A (Sept. 4, 1996), http://docs.cpuc.ca.gov/ published//FINALDECISION/5285.htm (California); 16 TEX. ADMIN. CODE § 25.52(C) (2) (D) (2012) (Texas); BUNDESNETZAGENTUR, sufrra note 42, at 41 (Germany). 71.
See CAL. PUB. UTIL. COMM'N,
ELECTRIC SYSTEM RELIABILITY ANNUAL REPORTS
(2013), http://www.cpnc.ca.gov/PUC/energy/ElectricSR/Reliability/annualreports/ 2013.htm (data for Pacific Gas & Electric Co., Southern California Edison, and San Diego Gas & Electric Co.). 72.
See PUB. UTIL. COMM'N OF TEX., ANNUAL SERVICE QUALITY REPORT (2013),
http://www.puc.texas.gov/industry/electric/reports/sqr/default.aspx service interruption times of participating Texas utilities). 73.
See
BUNDESNETZAGENTUR,
MONITORING
REPORT
2014,
(based on average at
51
(2014),
http://www.bundesnetzagentur.de/SharedDocs/Downloads/EN/BNetzA/ PressSection/ReportsPublications/2014/MonitoringReport_ 2014.pdfjsessionid=A749P08 5E748FA741173BC7F6AD8D I64? _blob=publicationFile&v-2. 74. See discussion infraSection VI.B.
72
STANFORD ENVIRONMENTAL LA WJOURNAL
[Vol. 35:1
In California, the 2014 average wholesale price 75 of electricity in CAISO's day-ahead market was 4.7 $cents/kWh. 76 Residential customers paid on average 16.3 $cents/kWh, while industrial customers were charged average rates of 12.3 $cents/kWh for electric77
ity.
Minutes 160 140 120
100 8o 60 40 20 0
2006 2007 2008 2009 2010 2011 2012 2013 California Texas -Germany '-
Source: EWI; Dota Provided by CPUC, PUCT & BNetzA
Figure 7: SAIDI: California, Texas, and Germany In Texas, 2014 wholesale prices for electricity averaged 3.8 $cents/kWh on ERCOT's day-ahead markets. 78 At the retail level, residential customers were charged average rates of 11.8 $cents/kWh while industrial customers paid on average 6.2
75. This Article follows the Federal Power Act's definition of wholesale electricity as the "sale of electric energy to any person for resale" as distinguished from the retail sale of electric energy to end users. See 16 U.S.C. § 824(d) (2012). 76. Stanford calculations based on CAISO day-ahead market pricing data provided by SNL Financial through November 3,2014 (on file with authors). . 77. See U.S. Energy Info. Admin., Electricity Data Browse, EIA.GOV, http://www.eia.gov/electricity/data/browser/ (last visited Dec. 31, 2015) (select "5.6 Average retail price of electricity" from the pull-down menu for pre-generated reports; then select the "Annual" tab and scroll down to California). 78. Stanford calculations based on ERCOT day-ahead market pricing data. See ELEC. RELIABILITY COUNCIL OF TEX., HISTORICAL DAM LOAD ZONE AND HUB PRICES (2014), http://mis.ercot.com/misapp/GetReports.do?reportTypeld=13060&repo-tTitle= Historical%20DAM%2OLoad%2OZone%20and%20Hub%20Prices&sh owHTMLView= &mimicKey.
2016]
A TALE OF THREE MARKETS
$cents/kWh.7 9 The average wholesale price of electricity traded on Germany's day-ahead markets was 3.3 €cents/kWh (4.2 $cents/kWh) in
2014.80 Meanwhile, retail rates charged to residential consumers, including levies to finance Germany's renewable energy support scheme, averaged 29.1 €cents/kWh (37.2 $cents/kWh), while nonexempt industrial customers paid 15.3 Ccents/kWh (19.5 $cents/kWh) on average. 8 1 In contrast, electricity-intensive German industrial customers, such as large-scale chemical, steel, and
paper industries, that have been exempted from renewable energy levies, paid approximate average electricity rates of only 4.4 Ccents/kWh (5.6 $cents/kWh) (see Figure 8).82 When viewed in their proper context, as discussed below, these numbers speak less
to the cost of Germany's Energiewende than to broader, macroeconomic differences between the energy markets of Europe and the United States. They also reflect deliberate pricing choices made by
German policymakers with serious implications for rates, especially 83 in the residential context.
79. See U.S. Energy Info. Admin., supra note 77. 80. Stanford and Institute of Energy Economics at the University of Cologne calculations based on European Energy Exchange day-ahead market pricing data. See EUR. http://www.eex.com/en/marketENERGY EXCH., AUCTION-EEX SPOT (2015), data/power/spot-mnarket/auction#!/2015/05/26. To convert Euros to U.S. Dollars, we utilize a conversion rate of 0.784 for the year 2014. See Internal Revenue Serv., supra note 35. 81. See BUNDESVERBAND DER ENERGIE UND WASSERWIRTSCHAF-r, ERNEUERBARE ENERGIEN
UND
DAS
EEG:
ZAHLEN,
FAKTEN,
GRAFIKEN
48
(2015),
https://www.bdew.de/internet.nsf/id/2015051 1-o-energie-info-erneuerbare-energienund-das-eeg-zahlen-fakten-grafiken-2015-de/$file/Energie-InfoErneuerbareEnergien_ tndjdasEEG_2015_11.05.2015_final.pdf. 82. i. at 56. 83. See discussion infra Section VI.E.
74
STANFORD ENVIRONMENTAL LA WJOURNAL
[Vol. 35:1
40
30 .. . ..
.... . . .
S25
2
10[ 0 Wholesate
Residentia. ECaleornia
Soufe S"ry,-TaylorCmter; Dao Pt
ieas aed y EA Sat
Industrna LiGermany ianoal.ERO , &EPEX Spol
Figure 8: 2014 Wholesale, Residential Retail, Industrial Retail 84 Rates: California, Texas, and Germany 3. Job creation. Proponents of the large-scale build-out of solar PV, onshore wind, and other renewables like to point to the positive employment impacts of renewable energy deployment. Indeed, a recent study suggests that solar PV has the potential to supporras many as 1.42 full-time job-years per GWh of generation, while wind can provide up to 0.26 full-time job-years per GWh.8 5 By comparison, coal and natural gas are both estimated to provide about 0.1 fulltime job-years per GWh of generation.8 6 Relative to investment dollars, another study estimates that solar PV and onshore wind power create 9.5 and 9.8 full-time jobs, respectively, per $1 million of investment.8 7 For the same money, oil and natural gas are expected to deliver 3.7 jobs, while coal is expected to support 4.9 full-time 88 jobs. While the numbers above are based on theoretical modeling, the empirical evidence-albeit reported, in part, by interested 84. Industrial electricity rates for Germany are for electricity-intensive, exempt industry customers.
85. See Max Wei et al., Putting lunewables and lEneg Effic/iency to Wnk: low Mavy Jobs Can the Clean Enei , lndusiry Generale in the US?, 38 ENERGY POL'Y 919, 922 (2010). 86. Id. 87. See ROBERT POLLIN ET AL., CTR. FOR AM. PROGRESS, THE ECONOMIC BENEFITS OF INVESTING IN CLEAN ENERGY: HOW THE ECONOMIC STIMULUS PROGRAM AND NEW LEGISLATION CAN BOOST U.S. ECONOMIC GROWTH AND EMPLOYMENT 28 (2009), http://www.peri.umass.edu/fileadinin/pdf/otheri-publication-types/green-economics/ economic benefits/economicbenefits.PDF. 88. Id.
2016]
A TALE OF THREE MARKETS
parties-supports the positive employment effects induced by solar PV and onshore wind deployment. According to the Solar Foundation's Solar Census Report, California leads the United States in solar jobs, with nearly 55,000 workers reported for 2014 across the solar PV, solar heating, and concentrated solar power industries. 89 The American Wind Energy Association, meanwhile, estimates that wind energy, directly and indirectly, supported 23,000 Californiajobs in 2014. 90 Reflecting Texas' strong onshore wind industry, the American Wind Energy Association estimates that wind energy employed between 17,000 and 18,000 Texans directly and indirectly during 2014. 91 The Solar Foundation reports nearly 7,000 Texans working for the solar industry in 2014.92 Despite Texas' modest solar PV deployment numbers to date, most of these jobs appear to be sup93 ported by the solar PV industry. With 2014 job data yet to be released, Germany's Ministry for Economic Affairs and Energy estimates 56,000 Germans were employed by the solar PV industry in 2013. 94 The onshore wind industry, meanwhile, is estimated to have supported 119,000 domestic jobs (see Figures 9 & 10). 95
89. See THE SOLAR FOUND., CALIFORNIA SOLAR JOB CENSUS 2014, at 8 (2015), www.tsfcensus.org; see also Brandon Baker, Which Slates Have the Most SolarJobs?, ECOWATCH (Feb. 11, 2014, 12:42 PM), http://ecowatch.com/2014/02/11/states-solar-jobs/. It should be noted that the solar census numbers include workers in the solar PV, concentrated solar power, and solar heating sectors. For an overview of these and other solar energy technologies, see DAN ARVlZUE ET AL., INTERGOVERNMENTAL PANEL ON CLIMATE CHANGE, SPECIAL REPORT ON RENEWABLE ENERGY SOURCES AND CLIMATE CHANGE MITIGATION 333-
59 (IPCC 2011). 90. See AM. WIND ENERGY ASSN'N, CALIFORNIA WIND ENERGY 1 (2015), http://awea.files.cms-plus.com/FileDownloads/pdfs/California.pdf. 1 (2015), 91. See AM. WIND ENERGY ASSN'N, TEXAS WIND ENERGY http://awea.files.cms-plus.com/FileDownloads/pdfs/Texas.pdf. 92. See THE SOLAR FOUND., TEXAS SOLAR JOB CENSUS 2014, at 7 (2015), http://www.thesolarfoundation .org/wp-content/uploads/2015/02/Texas-Solar-JobsCensus-2014.pdf; see also Baker, supra note 89. 93. See THE SOLAR FOUND., supra note 92, at 11-14. 94. See FED. MINISTRY FOR ECON. AFFAIRS & ENERGY, GROSS EMPLOYMENT FROM RENEWABLE ENERGY IN GERMANY IN 2013, at 7 (2014), http://www.binwi.de/English/ Redaktion/Pdf/berich t-zu r-bruttobeschaeftigung-durch-e rneuerbare-energien-jah r2013,property=pdf,bereich=bmwi20l2,sprache=en,rwb=true.pdf. 95. Id.
76
STANFORD ENVIRONMENTAL LAWJOURNAL
500.02 01 160.11110
[Vol. 35:1
-
40,40.0 10,00O0 -
20,000
U
California 12014)
N Texas 120141
] Germany 1o2131
"2C14 job dot for Germany rye' reeosedao the time ofwriting
Figures 9 & 10: Solar PV and Onshore Wind Jobs: California, Texas, and Germany V. POLICY DRIVERS
California, Texas, and Germany have achieved their respective deployment numbers for solar PV and onshore wind power through a diverse mix of policies. The following sections survey the primary policy drivers in the three jurisdictions (infra B.-D.). In the case of California and Texas, state-level policies are complemented by federal policies to promote the nationwide build-out of renewable energy infrastructure (infra A.). A. United States FederalTax Supportfor Renewable Energy Deployment Renewable energy deployment in both California and Texas relies heavily on federal tax incentives, such as tax credits and accelerated depreciation rates. Sections 48 and 25D of the Internal Revenue Code (IRC) award eligible solar PV assets investment tax credits (ITC) worth 30% of qualifying capital expenditures. 96 Under section45 IRC, eligible onshore wind power assets earn an inflation-indexed production tax credit (PTC) for power produced and sold to the grid during the first 10 years of a facility's operation. 97 The PTC was worth 2.3 $cents/kWh at the end of 2014.98
96. See 26 U.S.C. §§ 25D(a) (1), 48(a) (2) (A) (2012). 97. See 26 U.S.C. §§ 45(a), (c)(1)(A), (d) (2012). 98. See Credit for Renewable Electricity Production, Refined Coal Production, and Indian Coal Production, and Publication of Inflation Adjustment Factors and Reference Prices for Calendar Year 2013, 78 Fed. Reg. 20,177 (Apr. 3, 2013) (showing the latest inflation adjustment as of April 2013 in accordance with various sections of the Internal Revenue Code; there have been no inflation adjustments since).
2016]
A TALE OF THREE MARKETS
Federal tax credit support for solar, wind, and other renewables has been subject to frequent modifications, extensions, occasional lapses, and eventual renewals. 99 Most recently, the wind PTC was allowed to expire at the end of 2014 after a retroactive extension in December of that same year.10 0 In December of 2015, the Consolidated Appropriations Act of 2016 retroactively extended the wind PTC through 2019 with a phase-down in annual 20% increments starting in 2017.101 The Act also extended the solar ITC for residential and commercial installations through 2021 with the credit scheduled to phase down to 26% in 2020 and 22% in 2021.102 At the beginning of 2022 the solar ITC will drop to 10% 03 for commercial facilities and will expire for residential facilities. 1 Project eligibility for both PTC and ITC requires that construction began within the aforementioned timeframes. 10 4 Besides tax credits, both solar and wind energy assets benefit from accelerated depreciation rates as five-year properties under the Modified Accelerated Cost Recovery System (MACRS), 10 5 allowing taxpayers to deduct the entire depreciation allowance of their renewable power asset in only five years rather than over the more than twenty years of the asset's useful life under default depreciation schedules. 116 B. California'sRenewable Energy Policy
Since 2003, California has used a Renewable Portfolio Standard (RPS) to promote the build-out of solar PV, onshore wind, and other renewables. An RPS requires 10 7 electric utility companies to 99. See generally PHILIP BROWN & MOLLY F. SHERLOCK, CONG. RESEARCH SERV., ARRA SECTION 1603 GRANTS IN LIEU OF TAX CREDITS FOR RENEWABLE ENERGY: OVERVIEW, ANALYSIS, AND POLICY OPTIONS (2011), http://assets.opencrs.com/rpts/ R41635_201102 08.pdf.
100. See Tax Increase Prevention Act of 2014, Pub. L. No. 113-295, 128 Stat. 4010 (2014). 101. See Consolidated Appropriations Act of 2016, Pub. L. No. 114-113, Division P, Title III, § 301 (2015). 102. See id. §§ 303, 304. 103. Id. 104. See 26 U.S.C. § 45(d) (1) (2012); Consolidated Appropriations Act of 2016, Pub. L. No. 114-113, Division P, Title III, §§ 303, 304 (2015). 105. See26 U.S.C. §§ 168(e) (3) (B) (vi) (I), 48(a) (3) (A) (2012). 106. See, e.g., PAUL SCHWABE et al., NAT'L RENEWABLE ENERGY LAB., MOBILIZING PUBLIC MARKETS TO FINANCE RENEWABLE ENERGY PROJECTS:
INSIGHTS FROM EXPERT
STAKEHOLDERS 4 (2012) (discussing the twenty or more years of useful life of wind turbines and solar PV equipment, often backed by corresponding manufacturer warranties). 107. Some jurisdictions, including five states within the United States, have adopted merely voluntary renewable energy goals. See Davies, supra note 23, at 1386.
78
STANFORD ENVIRONMENTAL LA WJOURNAL
[Vol. 35:1
source a certain share of the electricity they sell to end-users from solar, wind, and other renewable sources of energy. 08 Utilities prove compliance with these requirements through Renewable Energy Credits (RECs). 10 9 Eligible power plant operators receive one such REC for every megawatt hour (MWh) of electricity generated from renewable resources."10 Independent power producers can sell these RECs to utilities in order to earn a premium on top of their income from power sales in the wholesale electricity market. As an alternative to buying RECs, utilities can also invest in their own renewable power generation assets to earn RECs for the electricity they produce. Whether utilities choose to earn their own RECs or purchase them from others, they eventually pass the associated costs on to their ratepayers."' The current version of California's RPS gradually increases the annual percentage of electricity to be sourced from renewables so that by December 31, 2020, 33% of the state's retail sales of electricity must come from renewable resources other than large hydropower facilities. 1 2 California 3 has made significant progress toward meeting the 2020 target. 11 In January 2015, California Governor Jerry Brown announced a new renewables target of 50% by 2030.114 In February 2015, a bill was introduced in the California Assembly to, among other things, extend the 50% target to publicly owned electric utilities. 1 5 In October 2015, Governor Brown signed into law the Clean Energy and Pollution Reduction Act of 2015 that codifies the new, revised RPS mandate of 50% electricity from renewables by 2030 and tasks the
108. For details, see Reinhard Haas et al., A IstoricalRemiew ofJ'romotion Strategiesfor Electricity from Renewable Energy Sources in EU] Countries, 15 RENEWABLE AND SUSTAINABLE ENERGY REV. 1003, 1011-12 (2011); MIGUEL MENDONcA ET AL., POWERING THE GREEN
ECONOMY-THE FEED-IN TARIFF HANDBOOK 150 (2009). 109. MENDONCA ETAL., supra note 108, at 155. 110. See Davies, supra note 23, at 1378 (reporting that some states award RECs for every kilowatt hour (kWh) of renewable electricity generation). 111. See id. at 1345 (noting that RPSs do not change the utilities' ratemaking and cost recovery procedures). 112. See CAL. PUB. RES. CODE § 25740 (West 2016). 113.
See generally Outlook for Utility-Scale Renewiables i'nCalifor171ia-R-lS, (UP!UIC, Utility
Forecasts, Utility Procurements, PPA Prices, CHADBOURNE (April 2014), http://www.chadbourne.com/Outlook-for-UtilityScale-Renewables-Califoirnia-projectfinance/. 114. See Jeff St. John, California Goverun.]emy Brown Calls for 50% Renewtables by 2030, GREENTECH MEDIA (Jan. 5, 2015), http://www.greentechinedia.com/articles/ read/calif.gov.-jeri-'y-brown-calls-for-50-renewables-by-2030. 115. SeeA.B. 645, 2015-16 Leg., Reg. Sess. (Cal. 2015).
2016]
A TALE OF THREE MARKETS
CPUC with its implementation. 116 The CPUC has current authority 17 to implement this target for the state's IOUs."
California uses four other noteworthy policy tools to help achieve its RPS targets. First, a market-based reverse-auction mechanism (RAM) aims to drive the development of 1,300 MW of system-side, distributed-generation projects 3-20 MW in capacity through power purchase agreements with California's three largest IOUs.1 18 Second, a feed-in tariff (FIT) allows smaller renewable power generators up to 3 MW in capacity to execute a standard offer contract to sell their output to local utilities for a period of ten, fifteen, or twenty years." t9 FITs are two-pronged policy instruments for the promotion of renewables' large-scale deployment.120 The "feed-in" element guarantees renewable electricity generators the right to connect to the power grid. The "tariff" element requires local utilities to purchase the power that these generators feed into the grid at above-market rates for an extended period of time.121 Utilities then pass the excess, above-market cost of their tariff paymerits on to their ratepayers, usually in the form of a levy or other surcharge. California's current FIT is capped at 750 MW with rates based on a renewable market adjusting tariff (ReMAT) mechanism designed to adjust the FIT price for periods according to market interest in order to either stimulate or curb demand. 122 Third, the California Solar Initiative (CSI) seeks to promote 1,940 MW of behind-the-meter, distributed solar PV capacity by offering incentives to customers of IOUs or public utilities with more than 75,000 customers. 23 Fourth and finally, California requires its utilities to of116. SeeS.B. 350, 2015-16 Leg., Reg. Sess. (Cal. 2015). 117. See CAL. PUB. UTIL. CODE § 399.15 (b) (3) (West 2016). 118. See Andrea Chambers & Trevor Stiles, Report of the Renewable Energy Cdmmittee, 33 ENERGY L.J. 333, 339 (2012). 119. SeeCAL. PUB. UTIL. CODE § 399.20(d),(1) (West 2016). 120. See Wilson H. Rickerson et al., If the Shoe FITs: Using Feed-in Taiffs to Meet U.S. Renewable Electricity Targets, 20 ELECrRIcIIY.J. 73, 73-74 (2007). For a detailed description of the various feed-in tariff design elements, see MENDONCA ET AL., supfra note 108, at 1538. 121. The duration of this purchase obligation ranges from eight years in Spain to fifteen years in France to twenty years in Germany. See Dominique Finon, Pros and Cons of Alternative Policies Aired at h'omoting Renewables, in 12 FIB PAPERS 110 (2007), http://www.eib.org/attachments/efs/eibpapers/eibpapers-2007_vl2_nO2_en.pdf. 122. Id. 123. See Cal. Pub. Util. Comm'n, About the Calin'nia Solar Initiative, CA.GOv, http://www.cpuc.ca.gov/PUC/energy/Solar/About theCaliforniaSolarInitiative.htm (last visited Dec. 31, 2015); U.S. Energy Info. Admin., Electricity-Feed-In Tarfiffs and Similar Prograniu, EIA.Gov, http://www.eia.gov/electricity/policies/providerprograms.cfm (last
80
STANFORD ENVIRONMENTAL LA WJOURNAL
[Vol. 35:1
fer net energy metering (NEM) for electricity customers with onsite generators of up to 1 MW from solar PV, onshore wind, and other renewable energy technologies with an overall program cap at 5% of aggregate customer peak demand. 124 In acknowledgment of the NEM program's significant progress, the California legislature has directed the CPUC to prepare a successor program to take effect on July 1, 2017, or upon reaching the 5% program cap, 25 whichever comes first. 1 C. Texas'Renewable Energy Policy Texas has also used an RPS to promote the build-out of renewable power generation capacity. Since its inception in 1999,126 Texas' RPS program has been expanded 12 7 to require that the state attain 5.88 GW of installed generating capacity from RE technologies byJanuary 1, 2015 and to set a target of 10 GW by January 1, 2025, with the non-binding goal that 500 MW of RPS-eligible capacity installed after September 1, 2005 come from resources other than wind. 128 Strong wind deployment has allowed Texas to exceed both 129 the 2015 mandate and the 2025 target well ahead of schedule, but deployment of non-wind capacity has lagged. Non-wind sources, like solar, typically have a higher market price in Texas and the voluntary goal set for them has not otherwise driven de30 ployment. In order to ensure sufficient transmission infrastructure to deliver new renewable power capacity from remote, resource-rich parts of Texas to the state's load centers, the state legislature directed the PUCT to identify Competitive Renewable Energy Zones (CREZs) with favorable resource conditions and plan for transmission capacity to deliver renewable electricity generated in CREZs visited Dec. 31, 2015). 124. See CAL. PUB. UTIL. CODE §§ 2827-2827.10 (West 2016). 125. See A.B. 327, 2013-14 Sess. (Cal. 2013); see al.o Cal. Pub. Util. Comm'n, Proposed Decision of ALJ Simon, Rulernaking 14-07-002, http://docs.cpuc.ca.gov/ PublishedDocs/Efile/G000/M156/K443/156443378.PDF (proposed decision in NEM successor tariff proceeding). 126. See S.B. 7, 76th Leg., Reg. Sess. (Tex. 1999). 127. SeeS.B. 20, 79th Leg., 1st Spec. Sess. (Tex. 2005). 128. SeeTEX. UTIL. CODE § 39.904(a) (2014); 25 TEX. ADMIN. CODE § 25.173(a)(1) (2009). 129. See Database of State Incentives for Renewables & Efficiency, Renewable Generation Iequirement, http://programs.dsireusa.org/system/pi-ogram/detail/182 (last visited Dec. 31, 2015). 130. See discussion infta Section VI.D.
2016]
A TALE OF THREE MARKETS
to customers in the most beneficial and cost-effective manner. 131 Development of transmission capacity was accelerated by easing the regulatory burden on transmission developers. For instance, the legislature allowed the PUCT to disregard two key factors-the adequacy of existing service and the need for additional servicewhen considering an application for a certificate of public convenience and necessity for a transmission project intended to connect a CREZ to Texas load centers. 32 CREZ projects have added nearly 3,600 miles of transmission lines to accommodate up to 18,500 3 The CREZ MW of wind power at a total cost of nearly $7 billion. 13 program has been credited as instrumental in reducing wind energy curtailment in Texas from 17% in 2009 to 0.5% in 2014.134 D. Germany's Renewable Energy Policy Germany has provided continuous FIT support for solar PV, onshore wind, and other renewables since the Stromeinspeise-Gesetz (Electricity Feed-in Law) of 1990.135 With feed-in rates for solar and wind originally pegged at 90% of retail electricity rates, Germany's first FIT delivered only limited renewable energy deployment.13 6 It was not until the Erneuerbare-Energien-Gesetz (Renewable Energy Sources Law) of 2000 decoupled feed-in rates for renewables from retail rates that Germany's renewable energy boom began. Since 2000, Germany's FIT rates have been calculated based on the respective generation costs of eligible renewable energy technologies, aiming to provide developers and investors with return rates of approximately 8% over the twenty years of guaranteed tariff 9
4
131. SeeTEX. UTIL. CODE § 39. 0 (g)(1)-(2) (2014); ELEC. RELIABILITY COUNCIL OF TEX. (ERCOT), PANHANDLE RENEWABLE ENERGY ZONE (PREZ) STUDY REPORT 2 (2014),
http://www.ercot.com/content/news/presentations/2014/Panhandle%20Renewable% 20Energy%20Zone%20Sttdy%2OReport.pdf. 132. SeeTEX. UTIL. CODE §§ 39.904(h), 37.056(c) (1)-(2) (2014). 133. See RYAN WISER & MARK BOLINGER, U.S. DEP'T OF ENERGY, 2014 WIND TECHNOLOGIES MARKET REPORT 66 (2015), http://energy.gov/sites/prod/files/
2015/08/f25/2014-Wind-Technologies-Market-Report-8.7.pdf (noting that the total cost of CREZ projects was $2 billion higher than first estimated, in part because over 600 miles of additional transmission lines were needed in response to requests for routing changes from landowners). 134. Id. at 37-38; see also JURGEN WEISS & BRUCE TSUCHIDA, THE BRATTLE GRP., INTEGRATING RENEWABLE ENERGY INTO THE ELECTRICITY GRID: CASE STUDIES SHOWING How SYSTEM OPERATORS ARE MAINTAINING RELIABILITY 13 (2015).
135. For a historical overview of renewable energy support in Germany, see HAAS ET AL., supra note 108, at 1018. 136. Id. at 1019.
82
STANFORD ENVIRONMENTAL LA WJOURNAL
[Vol. 35:1
payments. 137 All FIT rates have built-in, technology-specific annual
"degression rates" that reduce the tariff by a set percentage every year in an attempt to anticipate and account for technology learning and cost improvements. In addition, the German parliament has amended the Renewable Energy Sources Law on several occasions to reduce FIT rates beyond their standard annual degression rates to keep up with greater-than-expected reductions in the price of solar panels and other hardware. 3 8 Other noteworthy modifications include incentives for renewable power generators to sell their electricity in the open market instead of under the FIT, 39 the transition to dynamic tariff degression rates that automatically adjust upward or downward according to the tariffs deployment success, 140 and the introduction of a cap for FIT support for solar PV 41 at 52,000 MW of installed capacity. Unlike California and Texas, Germany does not use an RPS to help promote the large-scale deployment of renewable energy but, instead, uses aspirational targets for the share of renewables in the German electricity mix. To date, all of these targets have been met well ahead of schedule, as the goal of 12.5% by 2010, set in 2004, was achieved three years early, in 2007, while the goal of 20% by 2020 was reached nine years early, in 2011.142 It remains to be seen whether the same trend will hold true for the Energiezwende's ex-
tremely ambitious goal of meeting 80% of Germany's electricity demand with renewables by 2050.
137. See MENDONCA ET AL., su/na note 108, at 21. 138. See Lincoln L. Davies & Kirsten Allen, Feed-in 7Tari&/s in Turmoil, 116 W. VA. L. REV. 937, 948 (2013) (discussing the Renewable Energies Laws of 2004, 2009, 2010, 2011, and 2012). 139. See id. at 953, 956 (discussing the Renewable Energies Laws of 2009 and 2011). 140. I. 141. See id. at 959 (discussing the Renewable Energies Law of 2012). 142. Id. at 960.
A TALE OF THREE MARKETS
2016] jurisdiction US. Federal
California
Texas
Policy Driver
Mandate/ Goal/ Cap
Investment tax credit (solar) - Residential - Commercial
Phases down to 22% by 1/1/2021 Expires 1/1/2022 Drops to 10% 1/1/2022
Production tax credit (wind)
Phases down to 40% by 1/1/2019 Expires 1/1/2020
Accelerated depredation
Permanent
Renewable portfolio standard
50% by 2030 mandate
Reverse auction mechanism
1.299 MW cap
Feed-in tariff
750 MW cap
California solar Initiative
1,940 MW by 2016 goal
Net energy metering
5% of peak load cap
Renewable portfolio standard
5,000 MW by 2015 mandate 10.000 MW by 2025 goal 500 MW non-wind goal
Competitive renewable energy zones
Germany
Feed-in tariffs
80% by 2050 goal 52,000 MW solar cap
Table 1: Primary Policy Drivers: California, Texas, and Germany VI. COMPARATIVE INSIGHTS AND BEST PRACTICES
Our analysis of publicly available market data for California, Texas, and Germany, review of the pertinent literature, and input from expert stakeholders have produced a range of comparative insights. We here focus on some of the most prominent and controversial themes of the renewable energy debate, including the critical role of soft costs (infra A.), the relationship between intermittent renewables and grid stability (infra B.), competing approaches to balancing intermittency (infra C.), the importance of policy diversity for a mixed portfolio of renewables (infra D.), and the implications of electricity price differentials among regions (infra E.). In the process, we contextualize, challenge, and refute some of the criticisms and misconceptions related to the largescale deployment of solar PV, onshore wind, and other renewables-on both sides of the Atlantic.
84
STANFORD ENVIRONMENTAL LAWJOURNAL
[Vol. 35:1
A. Favorable Treatment of Soft-Cost Factors Translates to Hard Savings Germany's LCOE numbers1 43 for solar PV pose a puzzling question: How can a country with significantly poorer renewable resource endowment post similar, if not better, LCOE values than California and Texas, which both feature solar radiation levels almost twice as high as Germany's? Or, as one expert put it: "Germany happens to be the wrong place for solar, but they did it." 144 How do German solar developers manage to produce electricity at similar cost levels to their California and Texas counterparts despite having little more than half the sunshine? At a glance, the United States-China solar trade dispute and the tariffs imposed on Chinese solar panels since 2012 suggest themselves as a possible explanation for the surprising similarity in LCOE numbers on both sides of the Atlantic. 145 Closer scrutiny, however, urges caution so as not to overemphasize the effect of these tariffs on the transatlantic LCOE comparison for the following reasons: First, the European Union quickly followed the United States example and began imposing its own tariffs on Chinese solar panels midway through 2013, eventually followed by an agreement between both setting minimum prices for Chinese solar panel imports. 146 Second, only 31% of solar panels installed in the United States in 2013 were imported from China. 147 Third, and 143. See discussion supra note 35 and accompanying text. 144. See Notes from Expert Stakeholder Workshop Held at Stanford (Sept. 22, 2014, (on file with authors) [hereinafter Stanfird Expet Slakeholder Workshop Notes]. In order to facilitate the most candid conversation possible, the workshop followed the Chatham House rule, whereby participants are free to use the information received, but neither the identity nor the affiliation of the speaker(s), nor that of any other participant, may be revealed. See Chatham House, ChathamiHouse Rule, http://www.chathamhouse.org/about/ chatham-house-rule (last visited Dec. 31, 2015). 145. For an overview of the U.S.-Chinese trade conflict and the various tariffs imposed on imported Chinese solar panels, see Nick Lawton, A Trade War Over Cheap Chinese Solar Panels: ProtectingAmeran -ingenuity or Needlessly Rai'ing Price, GREEN ENERGY INST. AT LEWIS & CLARK L. SCH., http://greenenergyinstitute.blogspot.com.es/2015/01/ o entetaili'ng Duly a-trade-war-over-cheap-chinese-solar.html; see also United Stats-Cn Measures on Certain Products /rom China, WORLD TRADE ORG. (Jan. 16, 2015), https:// www.wto.org/english/tratop_e/dispu_e/cases-e/ds437_e.h tm. 146. See Gabriele Steinhauser & Art Patnaude, EU Resohes Solar-Panel Tiade Dispute with China, WALL STREET J. (JULY 28, 2012, 3:48 PM), http://ww.wsj.com/articles/ SB10001424127887324170004578633961968361242. 147. See Mike Munsell, New Tari/Is on Chinese Solar Modules Will Raive (IS Ptices by 14%, GREEN TECH MEDIA (June 20, 2014), http://www.greentechmedia.com/articles/ read/New-Tariffs-on-Chinese-Solar-Modules-Will-Raise-US-Price-by-14. It should be noted that it is unclear whether reported LCOE numbers for Germany incorporate the impact of E.U. tariffs on the prices of Chinese panels. See KOST ET AL., supra note 35, at 19 (referenc-
2016]
A TALE OF THREE MARKETS
most importantly, continuous cost improvements in manufacturing across the globe have reduced the share of solar panelsregardless of their origin-in overall system costs to well below 50%. 148 With the cost of solar panels and other hardware accounting for an ever smaller share of overall system costs, the surprising similarity in solar PV LCOE values among California, Texas, and Germany points toward "soft costs," such as the cost of financing, permitting, installation, and grid access, as critical drivers of the observed LCOE numbers. Recent analysis suggests that favorable treatment of these and other soft-cost factors has allowed the renewable energy policies of some countries to deliver up to four times the average deployment of other countries, despite offering only half the financial incentives. 149 The same dynamics would help explain why Germany's LCOE numbers for solar PV are similar to those of California and Texas-despite the country's considerably poorer solar resource quality. Thus, financing costs for solar PV projects in Germany are reported to range from 4.4% to 4.8%150 compared to 9.6% in the United States.'15 And the transatlantic gap in cost of capital grows even wider when factoring in the current United States reliance on federal tax incentives to promote the build-out of solar, wind and other renewables. The need for hefty tax bills in order to benefit from these tax breaks limits the pool of eligible investors to about two dozen banks and other highly profitable firms who can use a developer's tax benefits to offset tax liabilities from other sources. 52 These "tax equity investors" use their exclusivity to exact high rates of return for their investment in renewable energy, 53 reportedly raising the cost of financing the international trade dispute over Chinese solar panels). 148. KOST ETAL.,supra note 35, at 19. 149.
See Felix Mormann, Enhancing the InvestorAppeal of Renerable Energy, 42 ENVTL. L.
681, 703 (2012) [hereinafter Enhancing the Investor Afpeal of Renevable Energy] (analyzing International Energy Agency deployment data for thirty-five countries worldwide to find that the top three FIT countries, including Germany, achieved four times the onshore wind deployment of the top three RPS countries, while offering half as much financial support to developers). 150. See KOST Er AL., supra note 35, at 11 (reporting average capital costs of 4.4% for small-scale and 4.8% for medium- and large-scale solar PV projects). 151. See LAZARD, supra note 36, at 2. 152. See BIPARTISAN POL'Y CTR., REASSESSING RENEWABLE ENERGY SUBSIDIES-ISSUE
BRIEF 10 (2011), http://bipartisanpolicy.org/wp-content/uploads/sites/default/files/ BPCRE%201ssue%2OBrief_3-22.pdf. 153. For a detailed discussion of the inefficiencies associated with federal tax credit support for renewables, see Felix Mormann, Beyond Tax Credits: Smarter Tax Policy for a
86
STANFORD ENVIRONMENTAL LA WJOURNAL
[Vol. 35:1
ing by up to 800 basis points compared to commercial debt and adding up to $40 per MWh to the cost of generating renewable electricity. 154 These financing charges alone could raise the production costs for renewable electricity above the average wholesale rates of states like Texas ($38 per MWh). 155 In contrast, direct financial support for renewables through Germany's FIT has invited well over one hundred institutional and thousands of retail investors to help finance the build-out of solar PV, onshore wind, and other renewables, offering a compelling explanation for the signif56 icantly lower financing charges observed in Germany. 1 The United States solar industry, meanwhile, has criticized cost increases of up to $2,500 for residential solar PV systems due to balkanized, often outdated local zoning and permitting processes.157 A recent study offers empirical support for the industry's criticism, finding that permitting, installation, and other soft costs, excluding financing, add up to 23% to the overall cost of residential solar PV systems.158 Not surprisingly, the United States solar industry praises Germany for virtually eliminating permitting for basic residential solar installations helping drive installed costs down by up to 40% compared to the United States. 159 One expert stakeholder suggested that this cost advantage may also be the result of Germany's higher population density and the country's more qualified workforce, allowing German installers to "hit three houses in a row with much less time spent on German roofs than U.S. roofs." 160
Cleaner, Mare Democratic Enwog Future, 31 YALEJ. REG. 303, 323 (2014) [hereinafter Beyond Tax Credits].
154. See BIPARTISAN POL'Y CTR., suffra note 152, at 11 n.18. Others report more moderate increases in the average costs of capital for tax equity-financed renewable power projects, seeLAZARD, sou/o note 36, at 3 (pegging the cost of tax equity at 12% and overall pro-
ject capital costs at 10.8%). 155. See discussion supa Section IV.B.2. 156. See Beyond Tax Credits,sunra note 153, at 326. 157. See, e.g., SUNRUN, THE IMPACT OF LOCAL PERMITTING ON THE COST OF SOLAR POWER 1, 3 (2011), http://my.solarroadmap.com/nserfiles/Permit-Pi-ocess-Time.pdf. 158. See KRISTEN ADANI ET AL., NAT'L RENEWABLE ENERGY LAB. & LAWRENCE BERKELEY NAT'L LAB., BENCHMARKING NON-HARDWARE BALANCE OF SYSTEM (SOFT) COSTS FOR U.S. SOLAR PHOTOVOLTAIC SYSTEMS USING A DATA-DRIVEN ANALYSIS FROM PV
INSTALLER SURVEY RESULTS 18 (2012), www.nrel.gov/docs/fy13osti/56806.pdf. 159. See, e.g., SUNRUN, suii/ ra note 157, at 1, 3. 160. See Stalford Expert Slakeholder Workshp Notes, supa note 144.
20161
A TALE OF THREE MARKETS
B. High PenetrationRates of Intermittent Renewables Need Not Affect Grid Stability Critics of the large-scale build-out of solar and wind power in Germany and elsewhere often claim that the intermittent output profiles of these renewable resources jeopardize the stability and reliability of the electrical grid. According to one commentator, "[w] hen renewables supply 20 to 30 percent of all electricity, many utility-energy engineers predict, the system will no longer be able to balance supply and demand." 16' A look at Germany's SAIDI numbers casts serious doubt on such warnings. From 2006 to 2013, Germany tripled the amount of electricity generated from solar and wind to a joint market share of 26%,162 while managing to reduce average annual outage times in its grid from an already impressive 22 minutes to just 15 minutes. 163 California, too, actually managed to lower average annual outage times in its grid between 2006 and 2013 from over 100 minutes to under 90 minutes, while more than tripling the amount of electricity produced from solar PV and onshore wind to ajoint market share of 8%.164 Texas, on the other hand, experienced a 39% increase in average outage times, from 92 minutes in 2006 to 128 minutes in 2013, as ERCOT ramped up its wind-generated electricity six-fold to a market share of 10%.165 In the words of one expert stakeholder: "There's a perception that if we go to higher renewables the grid might collapse. The German grid shows that's not the case." 166 California's grid does, too-at least for now. And Texas, with a massive increase in wind generation, seems to have reasonably managed outage risk to date. Several recent studies confirm our observation that greater penetration of intermittent renewables may require greater grid management efforts but need not 67 come at the expense of grid stability. 1 161. See Charles C. Mann, Wiat If We Never Run Out of Oil?, THE ATLANTIC (Apr. 24, 2013, 9:58 PM), http://www.theatlantic.com/magazine/archive/2013/05/what-if-wenever-run-out-of-oil/309294/?single-page=true. 162. See Dehmer, supra note 6, at 73. 163. See discussion supra Sections V.A., Iv.B. 1. 164. Id. 165. Id. 166. See Staford Expert Stakeholder Workshop Notes, supra note 144. 167. See, e.g., JORGEN WEISS & BRUCE TSUCHIDA, THE BRATTLE GRP., INTEGRATING RENEWABLE ENERGY INTO THE ELECTRICITY GRID: CASE STUDIES SHOWING How SYSTEM OPERATORS ARE MAINTAINING RELIABILITY 30 (2015) ("IlSOs and utilities can deploy a
large and increasing portfolio of options to accommodate large and growing shares of re-
88
STANFORD ENVIRONMENTAL LA WJOURNAL
[Vol. 35:1l
C. Regulatory Approaches and Market Solutions to Balancing Output Intermittency Germany's impressive grid stability statistics should not be misconstrued as a sign that an electrical grid with a significant share of renewable energy is easy to operate. Indeed, Tennet TSO, Germany's second-largest grid operator, reports a near fivefold increase in its requests to plant operators to adjust their output to maintain grid stability from 209 requests in 2010 to 1,009 requests in 2013.168 Analysts have long acknowledged the need for fast-ramping, easyto-dispatch power to keep the grid in balance when power production from solar, wind, and other non-dispatchable, intermittent renewable generation suddenly drops off. 169 We here use the term "intermittency" to refer to output fluctuations both as the result of cloud coverage, wind lulls, or similar short-term meteorological conditions, and as the growing challenge posed by diurnal cycles where large amounts of solar power capacity go offline at sunset as iland require replacement with fast-ramping back-up capacity, 70 lustrated by California's highly publicized "duck chart." 1 Both California and Germany have recently witnessed innovative approaches to managing the intermittency of non-dispatchable renewables. In late 2013, the CPUC used its rulemaking authority under Assembly Bill 2514 to require California's IOUs to procure a newable generation while maintining high levels of reliability");JTRGEN WEISS ET AL., THE BRATTLE GRP., EPA'S CLEAN POWER PLAN AND RELIABILITY: ASSESSING NERC'S INITIAL
RELIABILITY REVIEW 39 (2015), http://info.aee.net/hs-fs/hub/211732/file-2486162659pdf/PDF/EPAs-Clean-Powe-Plan-Reliability-Brattle.pdlf ("concerns related to integration challenges caused by the growth of renewables are exaggerated"); GE ENERGY MGMT., PJM RENEWABLE
INTEGRATION
EXECUTIVE
STUDY:
SUMMARY
REPORT
6-7
(2014),
http://www.pjm.com/-/media/conittees-gr-oups/subcommittees/iis/postings/ pris-executive-summary.ashx ("the PJM system, with adequate transmission expansion and additional regulating reserves, will not have any significant issues operating with tip to 30% of its energy provided by wind and solar generation"); DEBRA LEW & GREG BRINKMAN, NAT'L RENEWABLE ENERGY LAB., THE WESTERN WIND AND SOLAR INTEGRATION STUDY
PHASE 2: EXECUTIVE SUMMARY 10 (2013), http://www.ni-el.gov/docs/fy]3osti/58798.pdf (noting that the variability and uncertainty challenges presented to grid operators by solar and wind energy can be mitigated). 168. See Julia Mengewein, German Utilities Bail Out Eectric G(id at Winds Mery, (July 30, 2014), http://www.bloomberg.com/news/print/2014-07-24/ BLOOMBERG german-u tilities-bail-out-electric-grid-at-wind-s-mercy.h tml. 169. See, e.g., Corinna Klessmann et al., Pros and Cons of Exposing Renewables to Electricity Market Risks-A Comparison of the Market Integration Aprroaches in Germany, Spain, and the UK, 36 ENERGY POL'Y 3646 (2008). 170. See, e.g., CAL. INDEP. SYS. OPERATOR, WHAT THE DUCK CURVE TELLS US ABOUT MANAGING
A
GREEN
GRID
3
(2013),
FlexibleResourcesHelpRenewablesFastFacts. pdf.
http://wvw.caiso.com/Documents/
2016]
A TALE OF THREE MARKETS
total of 1,325 MW of grid-level energy storage by 2020.171 Other electricity providers were required to procure storage capacity worth 1% of their annual peak load.172 The first of its kind in the United States, California's energy storage bill is a building block in the state's transition to renewable energy. 73 In contrast to California's initial regulatory mandate, Germany has relied on its electricity markets to help balance the intermittent output of the country's growing fleet of solar and wind power generators. As the share of intermittent renewables continues to increase, Germany's balancing market has become ever more important, to the point where generators today can earn well over $15,000 for providing a single MW of fast-ramping balancing capacity for one hour in the weekly balancing market auctions. 174 With the balancing market several orders of magnitude more lucrative than the wholesale electricity market, 175 many have sought to enter or increase their presence, including Germany's incumbent utilities and, remarkably, some renewable energy entrepreneurs. 176 Perhaps the most notable, Next Kraftwerke, has combined 570 MW of solar, wind, hydro, and biomass-powered cogeneration capacity to create a virtual power plant that bids, among others, over 170 MW of fastramping, partly instantaneous backup capacity into the German balancing market. 177 In the same vein, incumbent utilities have begun to retrofit their coal-fired power plants to allow for faster ramping in response to load changes. 78 Entrepreneurial innovation and greater competition among suppliers offer an explanation as to why the aggregate cost of Germany's grid management measures has gone down by 25% from 2009 to 2012179-despite the dramatic increase in balancing interventions from grid opera171. See Cal. Pub. Util. Cornm'n, Decision Adopting Energy Storage Procurement Framework and Design Program 2, Rulemaking 10-12-007 (Oct. 17, 2013), http://docs.cpuc.ca.gov/PublishedDocs/Published/GOOO/MO78/K929/78929853.pdf. 172. Id. 173. See Press Release, State of Cal. Dept. of Justice, Office of the Attorney Gen., Brown Lauds Passage of the Nation's First Energy Storage Bill (Sept. 29, 2010), http:// oag.ca.gov/news/ press-releases/brown-lauds-passage-nations-fiirst-energy-storage-bilI. 174. See Mengewein, supra note 168. 175. See discussion supiaSection W.B.2. 176. See Mengewein, supra note 168. 177. See Craig Morris, German Virtual Power Plant Provider Goes Nationwide, RENEWABLES INT'L Uuly 7, 2013), http://www.renewablesin ternational.net/ gennan-virtual-power-plant-provider-goes-nationwide/150/537/68680. 178. See Mengewein, supra note 168. 179. See FED. MINISTRY FOR ECON. AFFAIRS &ENERGY, sulyra note 46, at 61, Figure 8.4.
90
STANFORD ENVIRONMENTAL LA WJOURNAL
[Vol. 35:1
tors. Germany's innovative and cost-effective grid management practices have helped maintain the country's high standards of grid stability-exceeding that of California or Texas-while integrating ever-higher shares of intermittent renewables. D. The Importance of Policy Nuance and Diversityfor a Mixed Renewables Portfolio The energy policy literature has long argued that a mixed portfolio of various renewable energy technologies requires diverse and tailored policy support to address the specific needs of solar PV, onshore wind, and other renewables. 80 Mindful of the considerable differences in maturity and cost across renewable energy technologies, the International Energy Agency calls on policymakers "to tailor policies and incentives to bring forward the specific technologies required rather than using a technology-neutral approach."1 81 The current analysis, albeit limited to a subset of two technologies-solar PV and onshore wind-provides empirical support for these claims. California and Germany have achieved significant deployment of both solar PV and onshore wind, despite critical differences between the two technologies, including LCOE numbers that have been over 50% higher for solar PV than for onshore wind. 182 California has managed to promote the simultaneous build-out of both technologies through a suite of diverse policy instruments. The state's RPS does not distinguish between power generated from solar, wind, or any other renewable resource, awarding one REC each per MWh of electricity generated from eligible renewables. 8 3 Such a technology- and scale-neutral policy instrument is likely to create a market primarily, if not exclusively, for the current least180.
See, e.g.,
INT'L ENERGY AGENCY,
DEPLOYING RENEWABLES-PRINCIPLES
FOR
EFFEcrvE POLICIES 23 (2008), http://www.iea.org/publications/freepublications/ publication/deployingrenewables2008.pdf (highlighting the need for diverse, tailored policy support "to exploit the significant potential of the large basket of renewable energy technologies over time"); see also Felix Mormann, Requiremnits for a Renewables Rvolfttion, 38 ECOLOGY L. Q. 903, 938 (2011) (highlighting the importance of a diversified portfolio of renewable energy technologies from an energy security perspective). 181.
INT'L ENERGY AGENCY, DEPLOYING RENEWABLES-BEST AND FUTURE POLICY
PRACTICE 100 (2011), https://www.iea.org/publications/freepiblications/publication/ DeployingRenewables2011 .pdf. 182. See discussion su/noa Section III. 183. See CAL. ENERGY COMM'N, RENEWABLES PORTFOLIO STANDARD ELIGIBILITY GUIDEBOOK 124 (7th ed. 2013), http://w.energy.ca.gov/2013publications/CEC-3002013-005/CEC-300-2013-005-ED7-CMF-REV.pdf.
2016]
A TALE OF THREE MARKETS
cost renewable energy technology at utility-scale. 184 Mindful of these dynamics, California has flanked its RPS with a suite of more tailored, complementary policies. Some of these are aimed at specific technologies and applications, such as the CSI promoting behindthe-meter deployment of solar PV, while others offer support for small-scale (NEM, FIT) or medium-scale (RAM) generators across a range of renewable energy technologies. 8 5 The result of this policy potpourri is a diverse portfolio of renewables in California's electricity mix, including but not limited to solar PV and onshore wind. 186 At a glance, Germany may appear to employ a less tailored policy approach than California to promote renewables. After all, most reports on German renewable energy policy, including our own, 187 seem to reduce the country's approach to a single policythe feed-in tariff. In reality, it would be more appropriate to use the plural term "feed-in tariffs" as Germany's Renewable Energy Sources Law establishes some thirty different FITs custom-tailored to address the needs of over ten distinct renewable energy technologies and applications while also accounting for differences in size, location, etc. 18 8 With such policy nuance and diversity it is hardly surprising that Germany's Energiewende has managed to promote the simultaneous build-out of solar PV and onshore wind, 1 89 among other renewables. Compared to both California and Germany, Texas uses a relatively straightforward, less nuanced policy approach to promote solar PV and onshore wind. The Texas RPS is, at its core, as technology-neutral as the California RPS, calling for the deployment of 10,000 MW of any renewable power generation capacity by 2020.190 In keeping with the literature's tenet that technology-neutral policies tend to promote primarily the least-cost technologies, 9 1 the Texas RPS, supported by the CREZ program that has stimulated 184. SeeMormann, supra note 180, at 937. 185. See discussion supra Section V.B. 186. See discussion supra Section W.A. 187. See discussion supra Section V.D. 188. See Erneuerbare-Energien-Gesetz [EEG] [Renewable Energies Act] (July 21, 2014), §§ 40-51 (Ger.), http://www.gesetze-im-internet.de/bundesrecht/eeg_2014/gesaint.pdf. 189. See discussion supra Section V.A. 190. See discussion supra Section V.C. 191. See Mormann, spra note 180 at 937; see NICHOLAS STERN, THE ECONOMICS OF CLIMATE CHANGE: THE STERN REVIEW 358 (2007).
92
STANFORD ENVIRONMENTAL LA WJOURNAL
[Vol. 35:1
significant transmission development, has been highly successful at promoting onshore wind but has driven very little deployment of more costly solar PV capacity. 92 In 2005, the Texas legislature amended the state RPS to include a goal of 500 MW of renewable generation capacity other than wind, offering a credit multiplier of 193 2 RECs for every MWh of electricity from non-wind renewables. Even so, solar PV deployment has continued to lag suggesting that this non-binding goal of 500 MW has been insufficient to create the necessary market pull. It is likely that the credit multiplier may still not have offered enough financial support to cover solar PV's LCOE in Texas. The few places in Texas with significant solar PV deployment have used tailored policies, such as Austin's value-ofsolar tariff and NEM program 194 or San Antonio's solar rebate program. 195 In light of the similarly strong solar resources in California and Texas, these observations suggest that the slower, statewide build-out of solar PV in Texas compared to California (and even resource-poor Germany) may well be the result of insufficiently diverse and tailored policy support. E. PuttingElectricity Costs in Perspective Perhaps the single most frequent point of criticism regarding the German Energiewende relates to its impact on electricity prices. 196 Indeed, German residential customers pay more than twice as much for their electricity as California residents and three times as much as their Texan counterparts. 197 These impressive price differentials only tell half the story, however, and warrant clarification and contextualization in multiple respects. First, only a modest portion of the 20-plus $cents/kWh difference between Germany's residential retail electricity prices and
192. See discussion supra Section W.A. 193. Seediscussion s/ira Section V.C. 194. See Database of State Incentives for Renewables & Efficiency, Austin Enei,-Net Me/tuing, DSIRE, Ittp://programs.dsireusa.org/system/progiain/detail/327 (last visited Dec. 31, 2015). 195. See Database of State Incentives for Renewables & Efficiency, Texas CPS lnergoSolar PV Rebate Progmam, DSIRE, http://prograins.dsireusa.org/systein/prograrn/detail/ 2794 (last visited Dec. 31, 2015). For a recent account of San Antonio's solar PV deployment success, see Bill Loveless, San Antonio Takes Different Tack on Solar Enet', USA TODAY (Feb. 16, 2015, 4:26 PM), http://www.usatoday.com/story/money/colurnnist/2015/ 02/15/loveless-solar-power-san-antonio/23384349/. 196. See, e.g., Eddy & Reed, suna note 9. 197. See discussion supra Section IV.B.2.
2016]
A TALE OF THREE MARKETS
those in California and Texas is due to costs imposed by the German commitment to renewables. In 2014, the levy to finance the above-market rates paid to renewable generators under Germany's FIT accounted for 8.0 $cents/kWh or 21% of average residential retail rates. 198 As such, the FIT levy was only the fourth largest driver of residential power pricing, behind energy procurement costs (25%), applicable taxes (23%) and grid-related charges (23%) (see Figure 11).199 Germany's energy procurement costs are driven, in large part, by higher natural gas prices in Europe, where cheaper United States gas is not available. From 2005 to 2012, prices for natural gas at the main trading hub in Germany increased by more than 85% from 5.88 $/MBTU to 10.93 $/MBTU before leveling off at 9.11 $/MBTU by 2014.200 In contrast, prices at the United States benchmark Henry Hub decreased from 2005 to 2012 by nearly 70% from 8.79 $/MBTU to 2.76 $/MBTU before rebounding to 4.35 $/MBTU by 2014 as significant new American production of natural gas occurred with the advent of large-scale hydrau20 1 lic fracturing of shale formations. Second, a significant portion of Germany's FIT levy stems from "legacy costs" incurred in the early stages of the country's renewable energy build-out when the tariff for solar PV, for example, exceeded 60 $cents/kWh in 2005.202 And with a FIT duration of twenty years, 20 3 these costs will be with German ratepayers for many years to come.
198. See BUNDESVERBAND DER ENERGIE UND WASSERWIRTSCHAFT, supra note 81, at 48. 199. Id. 200. See BRITISH PETROLEUM, BP STATISTICAL REVIEW OF WORLD ENERGY 27 (2015), https://www.bp.coin/content/dam/bp/pdf/eergy-economics/statistical-review-2015/
bp-statistical-review-of-world-energy-2015-full-report.pdf. 201. Id.; see also CARA MARCY & ALEXANDER METELITSA, EUROPEAN RESIDENTIAL ELECTRICITY PRICES INCREASING FASTER THAN PRICES IN UNITED STATES (2014),
http://www.eia.gov/todayinenergy/detai.cfm?id=18851. 202.
See INT'L ENERGYAGENCY, sulra note 180, at 128.
203. See supra note 137 and accompanying text.
STANFORD ENVIRONMENTAL LA WJOURNAL
94
[Vol. 35:1
Feed-in Tariff Levy
21%
Other
Grid Charges
8%
23% TaxWs
23%
Procurement Costs
25%
Source: Steyer- Taylor Center, Doto Provided by BDEW
Figure 11: Drivers of Germany's 2014 Residential Electricity Rates One expert stakeholder reminded us at our Stanford workshop that these plummeting prices were, in part, the result of German deployment bringing down the cost of solar worldwide. 20 4 After all, Germany's strong policy support is credited with driving global demand for solar PV equipment that supported the build-out of the vast Chinese manufacturing capacities whose resulting oversupply helped drive down solar PV prices. 20 5 Another stakeholder went even further stating that "wle owe a debt of gratitude to 06 Germany to help get those economies of scale up for solar." 2 Third, the German parliament deliberately chose to impose most of the financial burden caused by its FIT on residential, rather than industrial ratepayers, in order to preserve the country's international competitiveness. To this end, the Renewable Energy Sources Law exempts well over 2,000 electricity-intensive industrial customers from part, if not all, of the FIT levy. 20 7 Despite using 204. See S/a ford Exxperi Stakeholder Warkshop Notes, supr-a note 144. 205. See, e.g., Michael Lind, The Solar nero Bubble Bursts: lV7y Germay s Solar Miracle Failed, THE BREAKTHROUGH (Mar. 25, 2013), http://thebreakthrough.org/index.php/ voices/mnichael-Iind/the-solar-energy-bubble-busts. 206. See Stanford Expert Stakeholder Worksh,) Notes, supra note 144. 207.
See BDEW, ERNEUERBARE ENERGIEN UND DAS EEG: ZAHLEN, FAKTEN, GRAFIKEN
51 (2014), https://www.bdew.de/internet.nsf/id/bdew-pblikation-erneuerbae-energien-
2016]
A TALE OF THREE MARKETS
25% of Germany's electricity, these exempt companies pay only 2% of the overall cost of the FIT levy. 208 The international competitiveness of exempt industrial ratepayers is further aided by the impact of renewables on the German wholesale market's "merit order," which determines the order of dispatch for power plants, usually going from least to most expensive. 20 9 Financed through market-independent FIT payments and enjoying statutory dispatch priority, the growing share of renewable power generators continues to push older, higher-cost power producers out of the market, thereby helping to reduce wholesale electricity prices by over 50% from 2008 to 2013.210 Together, these dynamics offer an explanation of why exempt industrial customers in Germany pay significantly lower electricity rates than their California counterparts and 21 slightly less than industrial ratepayers in Texas. ' Fourth, the significant increase in retail electricity prices for residential customers that has accompanied the Energiewende was a conscious policy choice in order to send powerful price signals to incentivize energy efficiency. 212 Germany's National Action Plan on
Energy Efficiency seeks to reduce primary energy consumption 20% by 2020 and 50% by 2050, compared to 2008 levels. 213 Following a gradual decline in recent years, German households consume under 260 kWh per month on average 214 -less than half as und-das-eeg-zahlen-fakten-grafiken-2014-de/$file/Energie-InfoErneuerbare% 20Energien %20ind%20das%20EEG%202014-korr%2027.02.2014_final.pdf. 208. Id. 209. See HANS POSER ET AL., FINADVIGE, DEVELOPMENT AND INTEGRATION OF RENEWABLE
ENERGY:
LESSONS
LEARNED
FROM
GERMANY
37
(2014),
("[T]he offer http://www.finadvice.ch/files/germanyilessonslearned-final_071014.pdf curve of a power market is determined by the marginal costs in ascending order of the available power sources. This is the so-called merit order."); see also Emily Hammond & David Spence, The Regulatory Contract in the Marketplace, 69 VAND. L. REV. (forthcoming 2016) ("when the grid operator dispatches power from individual electric generating facilities to the grid, it does so on a least-cost basis"). 210.
See POSER ET AL., supra note 209, at 3-4, 37-38; see also AGORA ENERGIEWENDE,
suffa note 41, at 22. 211. See discussion supra Section IV.B.2. 212. See Pang et al., sura note 3, at 16. 213. See Fed. Ministry for Econ. Affairs & Energy, NationalAction Plan on Energy Ifficiency (NAPE): Making M(re out of Energy, BMWI.DE, http://www.bmwi.de/EN/Topics/ Energy/Energy-Efficiency/nape.htInl (last visited Dec. 31, 2015). 214. See BUNDESVERBAND DER ENERGIE UND WASSERWIRTSCHAFT, ENERGIE-INFO: https://www.bdew.de/internet.nsf/id/ STROMVERBRAUCH IM HAUSHALT 6 (2013), 6FE5E98B43647E00C1257COF003314E5/$file/708-2_Beiblatt-zu%20BDEWChaits%20Stromverbrauch%20im%20Haushalt 2013-10-23.pdf (reporting a gradual decline in residential electricity consumption from 2005 onward).
96
STANFORD ENVIRONMENTAL LA WJOURNAL
[Vol. 35:1
much as the average California household (560 kWh/month) and well below a quarter of the electricity consumed by the average Texas household (1,170 kWh/month). 2 15 Based on 2014 electricity prices, 216 these consumption numbers translate to average monthly household electricity bills of approximately $100 for Germany, $90 in California, and $130 in Texas. It appears, therefore, as though the price signals embedded in Germany's rising electricity ,rates are having the intended effect of promoting energy efficiency while also helping to keep residential electricity bills affordable. Cost*
$50
U California
U Texas
Z Germany
*Based on 2014 real)electricity rates and historic monthly average consumption data.
Figure 12: Average Monthly Household Electricity Bills Fifth, any comparison of the impact of renewable energy policy on electricity rates in the United States and Germany should keep in mind that a principal driver of United States renewables deployment-federal tax incentives-is funded not by ratepayers in the handful of states where renewable energy development has been substantial, but, instead, by a much larger set of taxpayers coast to coast. While not as high as Germany's FIT levy, assigning 215.
See NAT'L ASSOC.
OF HOME
BUILDERS,
2013 AVERAGE MONTHLY
BILL-
RESIDENTLAL (2015), http://eyeonhousing.org/wp-content/uploads/2015/03/2013Average-Monthly-BiIl-Residential-Electric I.pdf. 216. See discussion sulna Section 1V.B.2.
2016]
A TALE OF THREE MARKETS
the cost of federal tax credits and accelerated depreciation rates to those United States ratepayers with significant renewable energy shares in their electricity mix would lead to a noticeable increase in their electricity rates (although this is not a change we recommend). The above clarifications do not seek to deny the fact that electricity prices in Germany are significantly higher than in the United States, nor that the price differential is, in part, the result of costly mistakes made by German policymakers, such as when they failed to adjust the FIT downward along with tumbling hardware prices in 2010. But understanding some underlying dynamics reminds us that Germany's FIT levy is but one factor among many that make up Germany's cost differential with California and Texas, many of which reflect careful-and some not so carefulpolicy choices. In the words of one expert stakeholder reflecting on the Germany situation: "At a high level, in spite of program design that could've been done better, [there is] a lot more good 2 17 than bad in that story." VII. CONCLUSION
The preceding analysis compares the solar PV and onshore wind deployment experiences and policy approaches of California, Texas, and Germany to gain insights into what has worked welland what hasn't. In the process, we contextualized and clarified some of the most prominent (and controversial) themes in the transatlantic renewables debate, including soft costs, grid stability, intermittency, policy tailoring, and electricity costs. While our analysis confirms that Germany's retail rates for residential customers are two to three times as high as those in California or Texas,21 8 we also find that industrial ratepayers in Germany, who are exempt from financing the country's feed-in tariffs for renewables, actually pay less for electricity than their counterparts in California and Texas, allowing the country's energyintensive industries to remain internationally competitive. 219 Moreover, higher residential electricity rates in Germany have helped encourage greater energy efficiency as envisioned by the German policymaker such that average monthly household elec-
217. See StanfordExpert, Stakeholder Work/hop Notes, sulra note 144. 218. Supra Section IV.B.2. 219. Supra Section IV.B.2.
98
STANFORD ENVIRONMENTAL LA WJOURNAL
[Vol. 35:1
tricity bills in Germany are only slightly higher than those in Cali220 fornia and, in fact, lower than in Texas. We rebut common concerns that ramping up the share of weather-dependent, intermittent renewables like solar and wind inevitably jeopardizes the stability of the electric grid. Germany and California have both managed to lower average service interruption times in their electricity grids while tripling the amount of electricity generated from solar and wind. 221 We caution, however, that the impressive grid stability numbers of Germany and California should not be misconstrued as a sign that an electrical grid with a significant share of renewable energy is easy to operate. Rather, we suggest that they are the result of targeted measures, rang222 ing from regulatory mandates to market-based incentives. We offer an explanation for how German solar installations manage to generate electricity at an overall cost similar to that of California and Texas-despite receiving only half as much annual sunshine as its United States counterparts. 223 Our analysis suggests that Germany makes up for its deficits in solar resource quality through favorable treatment of "soft costs," such as the cost of fi224 ' nancing, permitting, installation, and grid access. Finally, our work underscores the importance of nuanced policy support in order to promote a diverse portfolio of renewable energy technologies. Germany and California have achieved significant deployment of both solar and wind generation assets each using a suite of technology-specific policy measures custom-tailored to the specific needs of either technology. 225 In contrast, Texas' reliance on a single, technology-neutral policy to create a market for renewables in general has been highly successful in ramping up the share of wind energy but has supported very little solar de226 ployment. Notwithstanding the visibility and importance of these themes, they represent but a modest subset of the kaleidoscope of factors to consider for successful deployment and integration of solar PV, 220. Supra Section VI.E. 221. Supra Sections W.B.I., VI.B. Only Texas has witnessed an increase in its average system interruption times while ramping up the share of intermittent wind power in its electricity mix six-fold. Id. 222. Supra Section VI.C. 223. Supra Section III. 224. S upra Section VIA. 225. Suna Section VI.D. 226. Id.
20161
A TALE OF THREE MARKETS
99
onshore wind, and other renewables. We hope that our work will inspire future research to include other jurisdictions, technologies, and policy issues, such as the critical question of the Energiewende's overall impact on Germany's greenhouse gas emissions. And we hope that this research will find its way into thoughtful policymaking, regulation, and market mechanisms on both sides of the Atlantic.