JMK, VOL. 16, NO. 2, SEPTEMBER 2014, 131–140 ISSN 1411-1438 print / ISSN 2338-8234 online
DOI: 10.9744/jmk.16.2.131–140
A STUDY OF THE INNOVATION POWER OF SMEs IN SEMARANG Ibnu Widiyanto Economics and Business Faculty of Diponegoro University Jl. Erlangga Tengah 17, Semarang 50275 Email:
[email protected]
Abstract The objective of this study was to analyze the reasons why a business could sustain its life. The approaches used were industrial based approach and micro business unit approach. The sampling method was purposive sampling combined by convenience sampling technique.The amount of samples were 100. The method of analysis used were nonparametric statistics and regression analysis. The study found that the innovation power of SMEs in Semarang was quite small (around 5%). This finding was expected to benefit business actors in Indonesia, namely to help increase innovation power so that their businesses could survive and continue to exist. Keywords: Innovation Power, Competitive Advantage, SMEs
Abstrak Studi ini bertujuan untuk menganalisis mengapa ada bisnis yang sukses dan mengapa ada yang gagal dalam mempertahankan kelangsungan hidupnya. Pendekatan yang digunakan ialah pendekatan industrial dan pendekatan unit bisnis mikro. Teknik pengambilan sampel adalah purposive sampling dikombinasikan dengan convenience sampling. Jumlah sampel adalah 100. Metode analisis terdiri dari statistik non-parametrik dan analisis regresi. Studi ini menemukan bahwa daya inovasi UKM di Semarang cukup kecil yaitu sekitar 5%. Temuan studi ini diharapkan bermanfaat bagi pelaku bisnis di Indonesia, agar mampu meningkatkan daya inovasinya sehingga mampu bertahan dan melanjutkan kehidupan bisnisnya. Kata Kunci: Daya Inovasi, Keunggulan Bersaing, UKM
The low innovation power of Indonesian industries causes the ingredient of Indonesian industrial growth is short termed and does not have sufficient power to maintain competitive advantages in the future. This explains why Indonesian businesses do not have high spillover effect so far. The chief aim of this study is to examine the extent of the innovation power of the industries in Semarang. From this study we expect to obtain comprehensive information of the source of the survival of businesses which hopefully may be utilized in the formulation of business policies and business developments in Indonesia.
INTRODUCTION Some businesses flourish well and other businesses fail. Often, this phenomenon cannot be explained comprehensively. Some experts state that there is another factor, namely the productivity factor, not the input factor which causes a business, or even a country, to be able to catch up with more advanced businesses or countries. The power to catch up can be defined as how far technological changes (innovations) can be utilized in order to catch up with other businesses or countries. Young (1995) finds that the average growth of the innovation power of industrial countries before year 1900 were 3% (France), 3.7 % (Germany), and 4.1% (Japan). In regard to macro economics, Young (1995) proposes that the average growth of the innovation power in Hongkong, Taiwan, and South Korea is more than 1%. Unfortunately, the innovation power of Indonesian industries is less than 1% (Widiyanto, 2004). This means that Indonesian industries still largely depend on the growth of input factor, not of innovation factor.
THEORETICAL BASE Innovation as the Source of Business’ Growth Although many discussions and studies have been performed about it, the “real” source of business’ growth still remains a question to be answered. Until now experts are not yet able to 131
132 JURNAL MANAJEMEN DAN KEWIRAUSAHAAN, VOL.16, NO. 2, SEPTEMBER 2014: 131–140
identify factors which influence the level and growth of industry other than capital and labor factors (Widiyanto, 2004). Besides, there are also differrences concerning cross section and time series observations (Gollin, 2002). The studies of Young (1995), Harberger (1998), and Prescott (1998) once again show the need of theories which can identify and at the same time characterize the influence of the residual growth. Unfortunately, many studies do not care much about finding new theories, but prefer to analyse the historical patterns of industry’s growth and output, or to calculate productivity growth1. Similarly, this study is also designed not to develop a new theory but to present empirical proofs of growth source in a developing country. The problem why some businesses succeed and other businesses fail has also been presented by Penrose (1959). It turns out that the key factor of successful businesses lies in their ability to handle and develop technological changes. With good handling of technological changes, businesses can dig their competitive advantages more comprehensively and more deeply. In this context, Grant (1991) adds that coordination of resources (technology, capital, and labor) comprise a very important activity (for a business) in establishing its capabilities. These capabilities then become the source of continuing competitive advantages. Sanchez & Heene (2004) propose that digging up and understanding organizational source is a necessary condition for a business’ success in this competitive environment. Therefore, the management should take care of the organizational process of finding and developing resources which are specific, not easily imitated, and useful for managing and developing the business’ value. In this resource based view, competence has economic relationship with the exchange value of a resource, and is not only identical with benefits. In this case, a complete observation of a business’ resources, and how to arrange and coordinate them with other resources are necessary to build the business’ competitive advantages (Sanchez & Heene, 2004). From the discussion above we find the connecting link between the methods of measurement of growth source, as has been proposed by among others, Young (1995) and Gollin (2002), and re1
Productivity as an indicator of a business’ performance is often formulated in the form of input divided by output. However, as indicator of the performance of industry the formulation cannot be simply applied since there are differences in the measurement units of each industry.
source based view approach proposed by Grant (1991) and Sanchez & Heene (2004), namely that in the long run technological changes can become the source of competitive advantages. Market oriented technological changes will of course raise the value of product development. Munfaat (2003) states in order to raise the quality of product development process, it is necessary to have good cross functional (cross departmental) interactions and a good product development team. These two factors are necessary because technological changes which end in product development will not succeed when there is no good communication between departments and the product development team does not understand the development of the market. Innovation and Competition Competitions among businesses in Indonesia are increasing all the time. This happens not only because of the increase of the number of local companies which produce similar products but also because of the overflow of foreign products as the consequence of global trade freedom in domestic market. The key factor in winning the competitions lies in a business’ ability to manage and at the same time to establish competitive advantages by giving added values to its customers (Narver & Slater, 1991). Han et al. (1998) propose that the chief source of competitive advantages is the innovation power owned by the management. A management with a high innovation power will always create differentiating attributes in their products. The market orientation of the management is also claimed as a source of competitive advantages (Kohli & Jaworski, 1990). Market orientation itself also involves the management’s innovation power. Thus, although market orientation often involves external factors (factors from outside the business), innovation is still an important factor to be considered in analyzing a business’ survival. Therefore, innovation management becomes an important strategy for the management in overcoming the ever increasing competitions in industry, and innovation needs to be seriously and carefully examined and developed. Product innovation and system innovation are steps which bring specific consequences, which are different from other steps taken by a business. For example, product innovation can be defined as the advancement in product attributes which differentiate the product from previous products or products of competitors. It needs to be supported by the innovation power owned by a business, which involves cost, time and risk (Hurley & Hult, 1998).
Widiyanto: A Study of the Innovation Power of SMEs in Semarang
Innovation is often defined as the implementation of a new idea which relates to result and process. However Zaltman et al. (1973) and Amabile et al. (1996) stated that innovation is a successful new implication of a relatively new creative idea in an organization. Booz (1982), Olson et al. (1995), Lukas & Ferrell (2000) emphazise on innovations which relate to product attributes. While Song & Parry (1997) and Cooper & Kleinschimidt (2000) relate innovation to a change of system, and Gatignon & Xuereb (1997) propose that innovation can be measured from product attributes and change of process which give added value to products. Thus, innovation can be product innovation which relates to technical matters, or process innovation which relates to system, whether administrative system or management system. All these innovations always relate to a business’ innovation power. Therefore, innovation measurement becomes a strategic step to gain more comprehensive information about the source of a business’ survival or growth. Unfortunately, until now studies on the extent of innovation or productivity in developing countries, specifically Indonesia, are performed in limited conditions. The studies can not be comprehensive because of the limitations of data such as data of capital stock, and the limitations of estimation techniques as a consequence of limited data. We can see the relevance of productivity and capital stock in Equation (1 and 4). Besides, the monetary crisis in the end of the 1990s also caused significant economic distortions. The Benefit of Innovation Studies on management, either strategic management or marketing management often discuss continuing competitive advantages. The potentials of the competitive advantages are used to explain how a business’ performance may be established and improved in the long run (Ferdinand, 2003). Businesses are established and developed with three goals, namely to gain profit, to gain continual profit, and to survive. In order to achieve these goals, businesses can be managed by utilizing resource-based view and capabilities concept (Oliver, 1997), with the help of techonological changes, as proposed by Grant (1991) and Sanchez & Heene (2004). While Aaker (1989) emphasizes that assets and skills are the chief factors for maintaining competitive advantages. Ferdinand (2003) compiles the above opinions in his statement which says that the essence of competitive strategy can be defined as a company’s process in establishing and developing various strategic resources which have potentials to bring competitive advantages.
133
Competitive advantage can have two functions: as an instrument to create performance, and also to neutrallize competitors’ assets and competitive competences. Barney (1991 and 1997) gives four criteria of the attributes in competitive advantage, namely value, rareness, imperfect imitability, and imperfect substitutability which are inherent to a business. Value indicates the the value that should benefit the business. Rareness constitutes the buisness’ ability to make its existence rare or differrent, in the sense that the business is able to produce resources and competences that are different from those of competitors. The resources and competences should be difficult to imitate or if imitated is imperfectly imitated (imperfect imitability). Imperfect substitutability affirms that the business’ resources and competences can not be substituted. A business’ growth (output) is the result of various influences. There are significant differences among data, time, and location of studies. Each data type, time and location always gives different results. This is normal since every data is not presented in the same way. Sometimes a data needs to be refined before it can be used for estimation. When a business’ growth is not based on technological changes (innovation), the business will not have continuing competitive advantages since it does not have high innovation power. Mollona (1998) gives four requirements for resources in order to establish continuing competitive advantages, namely: 1. Heterogenous: the business’ resources should be specific and different from other businesses. 2. Imperfect factor market: the specific resources are owned only by the business, and competitors who want to obtain them should pay a lot. 3. Imperfectly imitable and substitutable: competitors can not easily imitate or substitute the resources. 4. Imperfect mobility: the resources are always faithful to the business (do not easily leave the business). These four requirements show that technological change is not the only source of a business’ competitive advantage. If a business develops a technology to create a very specific product (so specific that is is not owned by other businesses), it also needs labors with specific skills to operate the technology. If the employee’s skill cannot be utilized outside the business, the employee will feel reluctant to leave the business. The leading factor of this resource based view is the technological change performed by the business. Several studies (among others İşcan, 1998) try to relate productivity with international market. There are many findings (İşcan, 1998; Sjöholm, 1997)
134 JURNAL MANAJEMEN DAN KEWIRAUSAHAAN, VOL.16, NO. 2, SEPTEMBER 2014: 131–140
which support the view that productivity will raise economies of scale and product quality which in turn will support trade freedom. Thus, the chief goal of trade freedom is improving production techniques and production capacity of internationally oriented domestic businesses, by providing better quality products and or by maintaining low production cost, so that domestic businesses may gain higher economies of scale and bigger use of capacity. This will make domestic businesses more efficient and able to reduce production cost because of the increase in the amount of production, which helps domestic businesses to have competitive advantages in quality and cost. However, Krugman (1986) states that the positive influence of trade freedom such as competitive advantages which result from innovations and extensive production scale more often happen in advanced countries than in developing countries. The reason is because the governmental policies of advanced countries are more supportive in spreading technological changes than in developing countries. For example, the policy of the Indonesian government to give gasoline and electric subsidy to industrial sector. This policy will result in allocative inefficiency, which prevents Indonesian industries from knowing the “real efficiency”. And the technical efficiency can even be eliminated because of this allocative inefficiency.2 Kim (1997) suggests that government become a facilitator who is always willing to study. By adopting the Korean industry, Kim states that the government’s policies should be related to technological advancement rather than to fiscal policies only (like gasoline subsidy) which only raises government’s popularity. Kim continues by stating that governmenttal policies should include: 1. Transfer of foreign technology. 2. Spreading imported technology. 3. Advancing local resources and developments in order to improve imported technology and to advance Indonesian technology. The policy is purposively designed to catch up with the industries of advanced countries. A business’ success in managing and developing technological changes, supported by governmental policies which approve technological changes is expected to improve the business’ performance which in turn may create spillover effect to other industries. This effect is expected to increase people’s income and welfare. The success of the management of is closely related to the formulation of the business’ strategies and the execution of the strategies. There are many differ2
The subsidy will cause welfare loss or deadweight loss.
ent types of strategies, but this study tries to present innovation development strategies which suit the situation of SMEs. The strategies are imaging strategy, learning strategy, and relational marketing strategy. These three strategies are considered suitable for developing SME businesses which generally encounter difficulties in management and marketing. RESEARCH METHOD Innovation Power Measurement Regardless of the unavailability of a reliable concept of innovation power measurement, this study tries to make a radical approach towards innovation power measurement by borrowing theories and approaches from experts such as Feder & Merhav (1993) and Easterly & Levine (2001). Our approach is through macroeconomic approach from the model of Harrod-Domar in 1940s, followed by Solow (1957 and 1962), by introducing productivity measurement concept or which is better known as total productivity product (TFP). Lee (1991) states that the methods of productivity measurement evolve from single factor measurement (for example, capital only, as performed by Harrod-Domar) to multi factor measurement (for example, capital and labor). Widiyanto (2004) borrows the concept developed by Feder & Merhav (1993) and then introduced innovation power concept which utilizes capital stock and human capital measurement, and also sectoral effects such as random effects and fixed effects. Studies on measurement also evolve from the static approach (see Berndt & Christensen, 1973) to the dynamic approach (see Easterly & Levine, 2001). In order to understand it more clearly, we should observe the following business production function p (F) equation: Q = F (K, L, t) (1) which is continuous and homogenous in degree 1, Q = business’ output K = capital L = labor t = shift in production bases The total derivative of the function is obtained by observing t time, so that we find: dQ F dt K
dK F dt L
dL F dt t
dt dt
(2)
Then we divide the whole equation by Q and insert K and L into the equation; F 1 dQ 1 K F dK dL L F Q dt Q K K dt dt L L t
dt dt
(3)
Widiyanto: A Study of the Innovation Power of SMEs in Semarang
After that we set the equation with the assumption of perfect competition, so that wages and interest rates is the same as marginal products K and L (marginal product of labor [MPL] and of capital [MPC], if
F F w and i L K
with w as wage rate and i as interest rate. Then we insert error terms and give subscript to time t, so that gQt = gTFP + K gKt +L gLt + t (4)3 gQ = output growth gK = capital stock growth gL = labor growth gTFP = technological changes (innovation power) K = contribution of capital towards output L = contribution of labor towards output. = error terms Equation (4) is a standard equation of output growth and productivity. In general there are two methods of measuring productivity. The first is by utilizing econometric estimation which needs an explicit specification of production function (for example, Caballero & Lyons, 1992; İşcan, 1998, and Widiyanto, 2004). The second is by subtracting output growth with weighted growth of input factor (for example, Young, 1995, Gollin, 2002, and Widiyanto, 2004). The second method is often called the growth accounting method. This study employs equation (4) with regression approach to find gTFP variable which is known as productivity (Caballero & Lyons, 1992; Romer, 2000; Gollin, 2002; Widiyanto, 2004). This gTFP variable is more extensively known as innovation power. gTFP variable is expected to be non-negative since it implies how far a technological change positively influences economic growth. If the variable is negative, it indicates that the company’s growth arises from input factor, and the company needs to improve marketing performance. Data Collecting The data collecting methods employed in this study are industrial based research method and micro business unit based research. These approaches used the data which is collected with non-probability sampling design because of the extensive research population. The population of this study is micro and medium businesses located in Semarang and around Semarang, which have been established for minimally three years. The business’ age is necessary in order to
examine its assets and obligations more comprehendsively. A business with an age of less than three years is considered as not yet experiencing significant changes. This formulation is also for adjusting to the data availability in a business’ report. The research object is taken only from Semarang and its surrounddings because of the limitation of time, fund, and human resources. If the research object is extended to all Indonesia it is feared that the study will not finish in time according to schedule, and the cost will increase largely since Indonesian geography is so broad and separated into so many islands. Although the research object is only located in Semarang and its surroundings, the conditions of businesses in Indonesia do not differ significantly. Almost all the problems faced by the businesses are similar, namely slow growth and tight competition. The sampling technique used in this study is purposive sampling combined with convenience sampling. According to Widiyanto (2008), the sampling formulation for non-probability sampling method is n = Z2/ 4e2 with sampling error (e) and Z value in selected confidence level is determined. This study fixes a sampling error of 10% and a confidence level of 5%, so that we obtain n = 96.04 which is rounded off to 97. The total sample of this study amounts to 100 respondents consisting of SMEs’ owners or managers. To obtain the necessary data we make questionnaires which are distributed to respondents. According to the model we use, this study is not based on the perception of respondents. The data that is used for analysis is company data so that the answer to the questionnaire can be categorized as interval scale or ratio, not as primary data with perceptional characteristics.4 Technical Analysis This study combines two methods of analysis, namely descriptive method and regression analysis. Descriptive method is needed to describe respondent’s profile which is done by performing cross tabulation and frequency tabulation. While the regression analysis with ordinary least squares technique is used to operate equation 4. RESULT OF THE STUDY AND DISCUSSION General description of respondents The greater part of the respondents consists of male respondents (78%), while the greater age group ranges between 44.1–51 years (32%). The average age of the respondents is 45.62 years with the 4
3
This equation is usually developed to measure the innovation power of industry. See Young (1995) and Widiyanto (2004).
135
The questionnaire does not ask the respondent’s opinion but data of the respondent’s business such as number of employees, number of assets, etc.
136 JURNAL MANAJEMEN DAN KEWIRAUSAHAAN, VOL.16, NO. 2, SEPTEMBER 2014: 131–140
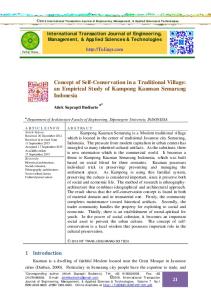
ages, there is a possibility that the businesses being surveyed are family businesses. This is confirmed by the age of most respondents (which are less than 37 years). Each of the respondents’ businesses employs from two to 19 labors with the median of four labors for each business. From the study we find that 48% of respondents’ businesses have three to four labors. Result of Regression Test From bibliographical studies and field surveys, we find that the businesses chiefly face problems of capitalization, marketing development, and product quality development. These problems are made worse by the low innovation power that can be employed by the businesses in order to sustain their lives. By applying equation 4, we can present the result of data pictograph and regression test as follows: Histogram Dependent Variable: gQ 30
Frequency
youngest 30 years and the oldest 66 years. Table 1 presents the cross tabulation between respondents’ age and sex. Table 1 shows that the majority of female respondents are between 44.1–51 years and the majority of male respondents are between 37.1–44 years. This means that the SMEs’ owners or managers are of productive age. Table 2 presents cross tabulation of respondents’ education and sex. From Table 2 we find that most of the respondents (70%) have higher than Senior Highschool education. This indicates that most SMEs’ owners or managers in Semarang have adequate education. However, a greater part of the female owners or managers are of Junior Highschool education, which is different from the male owners or managers which are mostly of Senior Highschool (or higher) education (more than 74%). The average age of the respondents’ businesses is 15.7 years with the minimal age of three years (as determined by the sample requirement), and the maximal age of 40 years. Table 3 gives the data of the businesses’ ages. Table 1. Cross Tabulation of Age and Sex Age Category 30–37 37.1–44 44.1–51 51.1–58 58.1–66 Total
Male 14 24 20 12 8 78
Sex Female 2 4 12 2 2 22
Total
20
10
Std. Dev = .99 Mean = 0.00
16 28 32 14 10 100
N = 100.00
0 -1.50
-1.00
-1.25
-.50 -.75
0.00 -.25
.50 .25
1.00 .75
1.50 1.25
2.00 1.75
2.25
Regression Standardized Residual
Normal P-P Plot of Regression Standardized Residual
Scatterplot Dependent Variable:gQ
Dependent Variable: gQ
3
1.00
Junior Highschool Senior Highschool Academy University Total
Sex Male 20 32 12 14 78
Female 10 6 2 4 22
Total 30 38 14 18 100
Table 3. Business’ Age Business’ Age 3–12 12.1–21 21.1–30 30.1–40 Total
Frequency 36 36 24 4 100
Percentage 36 36 24 4 100
Table 3 shows that the businesses taken as samples are relatively young businesses since their ages are less than 21 years. If this result is crossed with the data of Table 1 about the owners’ or managers’
Regression Standardized Predicted Value
Education
Expected Cum Prob
2
Table 2. Cross Tabulation of Education and Sex
.75
.50
.25
0.00 0.00
.25
.50
.75
1.00
1
0 -1 -2 -3
-2
-1
0
1
2
3
Observed Cum Prob Regression Standardized
Figure 1. Data Pictograph
From the data pictograph in Figure 1 we can conclude that normality and heteroskedaticity problems do not appear significantly in this study. The data being regressed still has the normal curve and is evenly spread. It means that the data being regressed is normal and homoskedastic. With the F value of 16,609 significant at 1%, it can be concluded that the model developed in this study is suitable and significant. Thus, the model has a good estimating and predicting ability, therefore we can make partial regression interpretation. The regression result of equation 4 is presented in Table 4.
Widiyanto: A Study of the Innovation Power of SMEs in Semarang
137
Table 4. The Regression Result of Equation 45 Model (Constant) gL gK
Unstandardized Coefficients Standardized Coefficients B Std. Error Beta 5.817 1.957 0.130 0.063 0.181 0.598 0.117 0.450
The regression result indicates that the model does not experience multicolinearity problem because the VIF value is below 10. The extent of the innovation power is seen from the constant value of regression result which is 5.817 with a significance of 1%. This means that SMEs’ owners or managers in Semarang have the innovation power of 5.8% only. Thus, the innovation power of SMEs’ owners or managers in Semarang is small. It is quite small when compared to advanced countries. Advanced countries generally have the innovation power of more than 10% (Young, 1995). Consequently, the output of SMEs in Semarang (can be read as Indonesia) relies more on input factor which is short termed, compared to the growth in advanced countries (Romer, 2000; Widiyanto, 2004). Statistically, SMEs in Semarang rely greatly on capital availability. The effect of capital on output is 0.45%, significant at 1%; while the contribution of labor is only 0.181%, significant at 5%. This implies that SMEs in Semarang depend very much on capital availability. In order to promote growth (output), the role of financial institution should be increased since capital comprises one of the chief sources of growth. This gives an explanation why people loaning institutions (BPR or People Loaning Bank, Koperasi Simpan Pinjam or Credit Unions, Baitul Maal wat Tanwil, and many others) flourish well in Indonesia. While the small role of labor as a source of growth indicates that the available labors are not yet able to quicken business’ growth. This situation occurs because the variable of this model is the amount of labor employed in each business. In order to improve the businesses’ performances in the future, it is necessary to take care of labors’ competences. This finding agrees with the findings of Zaltman et al. (1973), Aaker (1989), Song & Parry (1997), Harberger (1998) and Widiyanto (2004). CONCLUSIONS AND SUGGESTIONS Conclusions Management innovation is an innovation in organizational processes. In regard to this we need to take care of opportunities and processes in the development of 5
The notation is adjusted to equation 4 where gQ = Sales, gK = Capital Stock, and gL = Human capital. Following the Solow residual theory, the constant value is defined as innovation power.
t
Sig.
2.973 2.053 5.104
0.004 0.043 0.000
Collinearity Statistics Tolerance VIF 0.986 0.986
1.014 1.014
good business ideas which relate to production process, capitalization, marketing program, and marketing coverage. The developments of good business ideas are expected to raise the innovation power of SMEs in Semarang. SMEs’ owners or managers who have relatively high education form the basic capital for the success of transfer of knowledge and of the development of good business ideas. SMEs in Semarang have high potentials to be promoted to grow continuingly. Business growth which only relies on the growth of input factors (capital and labor) will only give short term basic ingredients to SMEs. It is necessary to promote long term growth since the innovation power of the SMEs in Semarang is quite small, namely around 5.8%. In order to raise innovation power we need to take steps to improve knowledge and to increase experience in managing business. Innovations of non production factors are expected to be taken into account in determining strategies. However, the success of the strategies always depends on the management’s strength of will, endurance, and skills, in adapting to environmental changes and in facing competitions. Several strategies that can be developed are imaging strategy, learning strategy, and relational marketing strategy. With the help of systematic strategies of innovation development, it is expected that SMEs in Semarang will be better known and will be better equipped in facing competitions. Future Research Agenda This study measures the extent of the innovation power of SMEs in Semarang, however there are still other issues of innovation power which need further studies in the future. Concerning future studies we would like to give the following suggestions: (1) to enrich labor measurement by utilizing human capital indicators such as employees’ education and employees’ skill, (2) to focus on similar type of industry so that the extent of the innovation power is more concentrated, and (3) to expand the area to be studied in order to identify the differences between the areas. Studies in the form of panel data research needs to be developed in order to make inventories and to diagnose SMEs problems in the ever increasing competition.
138 JURNAL MANAJEMEN DAN KEWIRAUSAHAAN, VOL.16, NO. 2, SEPTEMBER 2014: 131–140
REFERENCES Aaker, D. A. 1989. Managing Assets and Skills: The Key to a Sustainable Competitive Advantage. California Management Review, 31(2): 91–106. Amabile, T. M., Conti, R., Coon, H., Lazenby, J., & Herron, M. 1996. Assessing the Work Environment for Creativity. Academy of Management Journal, 39(5): 1154–1184. Barney, J. 1991. Firm Resources and Sustained Competitive Advantage. Journal of Management, 17(1): 99–120. ______. 1997. Gaining and Sustaining Competitive Advantage. Reading, MA: Addison-Wesley. Berndt, E. R. & Christensen, L. R. 1973. The Internal Structure of Functional Relationships: Separability, Substitution and Aggregation. Review of Economic Studies, 40: 403–410. Booz, A. 1982. New Product Management for the 1980’s. New York: Booz, Allen & Hamilton, Inc. Caballero, R. J. & Richard, K. L. 1992. External Effects in US Procyclical Productivity. Journal of Monetary Economics, 29(2): 209–225. Cooper, R. G. & Kleinschimidt, E. J. 2000. New Product Performance: What Distinguishes theStar Products. Australian Journal of Management, 25(1): 17–45. Easterly, W. & Levine, R. 2001. It’s Not Factor Accumulation: Stylized Facts and Growth Models. The World Bank Economic Review, 15: 177– 219. Feder, M. & Merhav, N. 1993. Relations between Entropy and Error Probability. Information Theory, Proceedings in IEEE International Symposium, January 1 –22, 1993.. Ferdinand, A. 2003. Sustainable Competitive Advantage: Sebuah Eksplorasi Model Konseptual. Semarang: Badan Penerbit Universitas Diponegoro Gatignon, H. & Xuereb, J. 1997. Strategic Orientation of the Firm and New Product Performance. Journal of Marketing Research, 34(1): 77–90. Gollin, D. 2002. Getting Income Shares Right. Journal of Political Economy, 110 (2): 458–474. Grant, R. M. 1991. The Resource-Based Theory of Competitive Advantage: Implications for Strategy Formulation. California Management Review, 33(3): 114–135. Han, J., Kim, N., & Srivastava, R. 1998. Market Orientation and Organizational Performance: Is Innovation the Missing Link? Journal of Marketing, 62(4): 30–45.
Harberger, A. C. 1988. A Vision of the Growth Process. American Economic Review, 88(1): 1–32. Hurley, R. R. & Hult, T. M. G. 1998. Innovation, Market Orientation, and Organizational Learning: An Integration and Empirical Examination. Journal of Marketing, 62(4): 42–54. İşcan, T. 1998. The Terms of Trande, Productivity Growth and the Current Account. Journal of Monetary Economics, 45(3): 587–611. Kim, L. S. 1997. Imitation to Innovation: The Dynamics of Korea’s Technological Learning. Harvard: Harvard Business School Press. Kohli, A. & Jaworski, B. 1990. Market Orientation: The Construct, Research Propositions and Managerial Implications. Journal of Marketing, 54(2): 1–18. Krugman, P. R. 1986. Strategic Trade Policy and the New International Economics. Cambridge, MA: MIT Press. Lee, J. K. 1991. Modelling and Measuring Technical Change and Productivity Growth. Ph.D. Dissertation. USA: University ofIllinois. Lukas, B. A. & Ferrell, O. C.2000. The Effect of Market Orientation on Product Innovation. Journal of the Academy of Marketing Science, 28(2): 239–247. Mollona, E. 1998. Resource Accumulation Systems, Corporate Competence Evolution and Emergent Strategic Behaviour: A Feedback Approach. London: University of London. Munfaat, I. 2003. Membangun Keunggulan Produk. Jurnal Sains Pemasaran Indonesia, 2(3): 219– 232. Narver, J. & Slater, S. 1991. The Effect of a Market Orientation on Business Profitability. Journal of Marketing, 54: 20–35. Oliver, C. 1997. Sustainable Competitive Advantage: Combining Institutional and Resource-Based Views. Strategic Management Journal, 18(9): 697–713. Olson, E. M., Walker, O. C. Jr., & Ruekert, R. W. 1995. Organizing for Effective New Product Development: The Moderating Role of Product Innovativeness. Journal of Marketing, 59(1): 48– 62. Penrose, E. T. 1959. The Theory of the Growth of the Firm. Oxford: Basil Blacwell. Prescott, E. C. 1998. Needed: A Theory of Total Factor Productivity. International Economic Review, 39(3): 525–551. Romer, D. 2000. Keynesian Macroeconomics without the LM Curve. Journal of Economics Perspectives, 14(2): 149–169.
Widiyanto: A Study of the Innovation Power of SMEs in Semarang
Sanchez, R. & Heene, A. 2004. The New Strategic Management: Organization, Competition, and Competence. New York: John Wiley & Sons. Sjöholm, F. 1997. Exports, Imports, and Productivity: Results from Indonesian Stablishment Data. The European Institute of Japanese Studies, 27(4): 705–715. Solow, R. M. 1957. Technical Change and the Aggregate Production Function. Review of Economics and Statistics, 39(3): 312–320. _______. 1962. Substitution and Fxed Proportions in the Theory of Capital. Review of Economic Studies, 29: 207–218.
139
Song, X. M. & Parry, M. E. 1997. The Determinants of Japanese New Product Successes. Journal of Marketing Research, 34(1): 64–76. Widiyanto, I. 2004. Essays on Growth, Productivy and the Oil Industry in Indonesia. Ph.D. Disertation. Canada: Dalhousie University. _______. 2008. Pointers Metodologi Penelitian. Semarang: BP Undip Semarang. Young, A. 1995. Tyranny of Numbers: Confronting the Statistical Realities for the East Asian Growth Experience. The Quarterly Journal of Economics, 110(3): 641–680. Zaltman, G., Duncan, R., & Holbeck, J. 1973. Innovations and Organizations. New York: Wiley.