Journal of Business Cases and Applications Volume 11 – July, 2014
A spreadsheet based derivation of the probability distribution from a random sample Jerzy Letkowski Western New England University ABSTRACT Spreadsheet programs are frequently used as an alternative to professional statistical packages. Many statistical problems can be quickly and accurately solved in a spreadsheet. All major summary measures, probability functions, tables, charts, etc., are well supported by the contemporary spreadsheet programs. Nonetheless, there are some tasks that require special attention and care in order to ensure proper outcomes. This paper presents a complete case for generating empirical frequency distributions for continuous-numeric data, using a Microsoft Excel compatible spreadsheet program. It shows how to best align the theory and spreadsheetbased practice with respect to production of frequencydistributions. This alignment is implemented by testing the goodness of fit of the empirical frequency distribution to the theoretical probability distribution. A brief survey and analysis of spreadsheet methods, used to generate of frequency distributions, is also provided. Keywords: statistics, frequency distribution, probability distribution, data types, spreadsheet, test
Copyright statement: Authors retain the copyright to the manuscripts published in AABRI journals. Please see the AABRI Copyright Policy at http://www.aabri.com/copyright.html. A spreadsheet based, Page 1
Journal of Business Cases and Applications Volume 11 – July, 2014 LEARNING OBJECTIVES Generally, in business, the purpose of identifying a probability distribution is to improve awareness of an uncertain decision situation. The probability distribution is the most convenient and powerful source of information about some characteristic (variable) of the uncertain situation. In order for students, taking Business Statistics courses, to be able to produce such information they should: know how to capture a sample in a spreadsheet; be aware of different options and issues related to generating frequency distributions; learn how to implement typical spreadsheet procedures for generating frequency distributions; understand strengths and weaknesses of different spreadsheet procedures; be able to select a matching probability distribution based on intuitive (visual) assessment of the [empirical] frequency distributions; and learn how to perform a Goodness-of-Fit test, involving the frequency distribution and the selected probability distribution. This paper is an attempt to satisfy these objectives. THEORETICAL BACKGROUND Most of the modern introductory Statistics textbooks start exploring statistics with datacentric topics, for example (Anderson at al., 2012, Black 2012, Donnelly, 2012, Larose, 2010, Levine, et al., 2011, Pelosi at al., 2003, Triola, 2007). Students first learn about the purpose of statistics, including both descriptive statistics and inferential statistics. Next they become familiar with data scope and types. In particular, in terms of the scope, they learn in general about the difference and relationship between a sample and population. Regarding the data types, the students become familiar with properties of and differences between qualitative data and quantitative data. At this stage, even so statistics deals with random data, there are few, if any, references to the probability or to the probability distributions of the data. Arguably, in the context of statistics, any random data set is best described by its probability distribution. Any information that can be derived directly from a data set (for example, from a sample) can also be derived from the probability distribution. However, probability related topics are usually covered in later chapters, after the students have learned about how to treat data empirically. Undoubtedly, there is a very strong connection between Statistics and Probability. One could say that Statistics is a playground for Probability or that Probability is a soul for Statistics. Like in other disciplines (such as Physics) there are many good reasons for acquiring at least a rudimentary understanding of the theory before attempting to study applications. Nonetheless, the contemporary textbooks go the other way around. It is out of the scope of this paper to argue which way is better. Suffice to say, failing to observe basic rules of the theory (Probability) may result in errors or imperfections when developing statistical applications. Many textbooks, covering introduction to Statistics, provide detail instructions about how to construct frequency distributions, using both tabular and graphical representations (Anderson at al., 2012 p. 49-52, Black 2012, p.20-22, Donnelly, 2012, p.30-34, Larose, 2010, p.47-50, Levine, et al., 2011, p.26-30, Pelosi at al., 2003, p.64-67, Triola, 2007, p.). In the same time, students do not necessarily learn from these instructions about the important connections between the frequency distribution derived from a sample and the [usually unknown] probability distribution, representing the population from which the sample was selected. Much like sample statistics x, p are used to estimate population parameters µ, p, respectively, one can use cumulative frequency distribution, Fs(x), to estimate cumulative
A spreadsheet based, Page 2
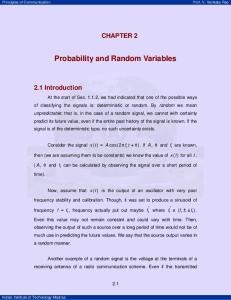
Journal of Business Cases and Applications Volume 11 – July, 2014 probability distribution, F(x) as shown in Figure 1. Thus, it is imperative to ensure consistency of the procedure used to determine function Fs(x) with the formal definition of function F(x): F(x) = P(X ≤ x), (i) where X is a continuous, numeric, random variable, representing the population. Now, consider a sample, Xs, of size n, selected randomly from the population, X: Xs = {x1, x2, …, xn}, Xs X (ii) Since function F(x) defines the probability of random variable X taking on any value less than or equal to x, function Fs(x) must have the same interpretation with respect to the sample, Xs: Fs(x) = #Xs(x)/n, (iii) X s x X s xi X s x xi x where #Xs(x) is the cardinality of set Xs(x) which is a subset of sample Xs such that for every number xi in Xs(x), xi ≤ x. A spreadsheet formula to implement (iii) uses standard functions CountIf() and Count(): Fs(x) =CountIf(Xs, "