RussianJournalof Electrochemistry,Vol.36, No. H, 2000,pp. 1203-1208.FromElektrokhimiya,Vol.36, No. II, 2000,pp. 1358-1364. OriginalEnglishTextCopyright9 2000by Di Quarto,Romano,Santamaria,Piazza.Sunseri.
A Semiempirical Correlation between the Optical Band Gap of Hydroxides and the Electronegativity of Their Constituentsl F. Di Quarto, M. C. Romano, M. Santamaria, S. Piazza, and C. Sunseri Dipartimento di Ingegneria Chimica dei Processi e dei Materiali, Universita di Palermo, Viale delle Scienze, 90128 Palermo, Italy Received January 27, 2000
Abstract--In analogy with previous results on anhydrous oxides, a correlation is proposed between the optical band gap of hydroxides and the electronegativities of their constituents. Based on the experimental results on passive hydrated layers on metals obtained in our laboratory and the literature data, it is found that the hydroxide band gap varies with the square of the difference between the electronegativities of the metallic cation and the hydroxyl group. Like in the case of anhydrous oxides, two different interpolation lines have been found for sp-metal and d-metal hydroxides, respectively. The proposed correlations predict semiconducting or insulating behavior even for the most electronegative metals, at variance with the case of oxides of noble metals, for which the observed metallic behavior is foreseen. INTRODUCTION In previous papers [1-3] we have highlighted that the use of photocurrent spectroscopy (PCS) for a physicochemical characterization of passive films on metals presents several advantages with respect to both ex situ and other in situ optical methods. In fact, PCS technique is not demanding in terms of surface finishing and does not require a high light intensity. These features imply that the use of PCS minimizes the risk of modifications of very thin passive films and allows one to monitor in situ surface changes in long-lasting corrosion processes also in presence of heavily attacked metal surfaces. Apart from the intrinsic limitation that only photoactive (semiconducting or insulating) corrosion layers can be scrutinized, the lack of theoretical models correlating the composition and structure of passive films to their photoelectrochemical behavior limits a widespread use of PCS in corrosion studies. In recent works [4-6] we have shown that it is possible to make a more quantitative use of PCS in order to characterize corrosion films grown on metals. Such a quantitative approach is based on a semiempirical correlation between the value of optical band gap of semiconducting or insulating oxides, MO., and the Pauling electronegativities of metal and oxyge~ [7]. The following general relationship between the optical band gap of crystalline oxides and the difference of electronegativity of their constituents was suggested in: Eg =2{Ei(XM_Xo)2+_~y[(DM_M+yDo_o)_R]
}, (1)
t Dedicated to the ninetieth anniversary of Ya.M. Kolotyrkin's birth. This article was submitted by the authors in English.
where, according to Phillips [8], Ei is the extra-ionic energy unit orbitally dependent, assumed "to vary with hybridization configuration, i.e. with different atomic coordinates in different crystal structures." For ionic compounds, i.e. alkaline halides, a value of Ei = 1 eV per atom pair is assumed, whilst a different value is expected for hybridized bonds involving d-orbitals. XM and Xo are the electronegativities of metal and oxygen, respectively. The stoichiometric coefficient y is obtained from the oxide formula MO., DM M and Do-o are the bond energies of dlatomlc molecules m the gas phase, and R represents a repulsive term [7]. By plotting the experimental band gap values vs. the square of the difference between the electronegativities of metal cation and oxygen, two different interpolating lines were obtained for sp-metal and transitional dmetal oxides, with few exceptions for both type of oxides. The best fitting equations for the two cases were 9
9
Eg (eV) = 1.35(XM -
.
Xo)
:-
2 -
--
1.49
9
(2a)
for d-metal oxides, and Eg ( e V ) = 2.17(XM-Xo)2-2.71
(2b)
for sp-metal oxides. We mention that as for the d-metal oxides only the point relative to NiO lays neatly on the sp-metal oxides interpolating line, whilst three non-transitional metal oxides (PbO, In203, T1203) are better interpolated by the d-metal oxides fitting line. Intriguingly, the d-/spmetal oxides dividing line passes along the diagonal Zn, In, Pb/Ga, Sn, Bi with some of sp-metals (In, Tl, Pb) of higher atomic number showing a d-like behavior in terms of average bond strength. As for the electronegativity values, the Pauling scale of electronegativity integrated with the Gordy-Thomas
1023-1935/00/3611-1203525.00 9 2000 MAIK "Nauka/Interperiodica"
1204
Di Q U A R T O et al.
values [9] was used in all calculations with the exception of TI(III), for which the value given by AIIred [10] has been preferred. It is noteworthy that the electronegativity values of the elements calculated according to the best fitting straight lines differ from the Pauling values by no more than 0.05, which is about equal to their uncertainty [11]. In the same paper [7] it was also suggested that correlations (2) could be extended to ternary oxides, A,,BhOo, containing only d,d-metal oxides or sp,spmetal oxides by substituting to the metal electronegativity XM the arithmetic mean for the cationic group Xc defined as follows:
bX B , a+b
aX A + X c =
(3)
where a and b are stoichiometric coefficients of the cations in the ternary oxide, and XA and XB their electronegativities. In the case of mixed oxides containing both sp- and d-metal cations Eq. (2a) seems to hold, provided that the difference in the electronegativity values between the metallic cations is less than 0.5 [7]. Very recent studies have confirmed the validity of such an extension to bulk ternary oxides and passive films containing d,d-metal cations [4-6]. Further studies are now in progress for testing the model more extensively. In order to explain the photoelectrochemical behavior of passive films and corrosion layers grown under conditions where the formation of hydrated oxides and/or hydroxides is possible, we suggested that a correlation similar to that reported in Eqs. (2) could hold for hydroxide and oxy-hydroxide phases. At that time only few data pertaining to hydroxide films were at our disposal, hampering our intention to test quantitatively this suggestion. In this work, we report some new and older experimental data on the photoelectrochemical behavior of passive films which allow us to verify the correlation between the optical band gap of hydroxide films and the difference between the electronegativities of the metallic cation and the OH group, analogous to Eqs. (2). CORRELATION BETWEEN Eo AND (AX) 2 FOR HYDROXIDES; By analogy with the procedure followed for mixed oxides, in [7] we suggested that for the OH group an average electronegativity value, X_a,,can be defined by using the arithmetic mean between the values pertaining to oxygen and hydrogen. Accordingly, a value of ~ , = 2.85 will be assumed in the following for the OH group in agreement with recent values suggested by others [ 12]. We have tested both sp- and d-metal passive films for which optical band gap (E~gpt) values have been attributed by us to hydroxide (or hydrated oxide)
phases on the basis of a photoelectrochemical study. The hydroxides used for obtaining the final correlation are those of metals for which the anhydrous phase has been also investigated photoelectrochemicaily by us or for which the band gap value reported in the literature is quite different from that attributed to the possible hydrated phase. Although in some cases the direct evidence of the formation of a hydroxide on the surface of the investigated metals is still missing, we are confident that the results of this work will lend further support to our hypothesis.
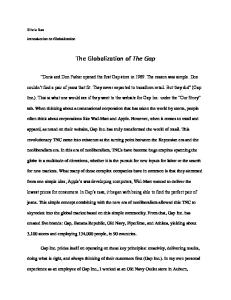
Hydroxides of sp-Metals (AI, Mg, Sn, Ni) In previous papers [l 3-16] we have reported on the existence of anodic photocurrent on pure (99.99%) aluminum anodized up to about 10 V in quasi-neutral aqueous solutions containing inorganic salts. The anodic photocurrent was recorded in these solutions only if the Al surface was previously submitted to a mechanical treatment. In the case of an electropolishe:l surface, no anodic photocurrent was observed unless the anodization process occurred in organic salt-containing solutions [14, 16]. In order to explain such a finding we suggested, in the case of mechanically treated electrodes, the formation of hydrated phases having Eopt --g values lower than that estimated for the Al203 crystalline film (6.3 eV [17]). For aluminum electrodes submitted to a razor blade scraping and anodized in inorganic solutions, the formation of an AI(OH)3 surface layer, having an ~opt _~ value of about 3.0 eV, on top of the passive film was inferred [16]. The growth of an amorphous alumina film (t~-AI203), having an optical mobility gap of about 6.3 eV, occurs in the case of electropolished aluminum metal anodized in inorganic as well as in organic salt-containing solutions. In these last solutions the incorporation of organic species, originating a density of electronic states into the mobility gap of amorphous alumina, was suggested as the source of the photocurrent response under illumination with photons having energy much less than the optical mobility gap of o~-AI203 [14]. In Fig. 1, we report the photocurrent spectrum of a corrosion layer formed on tin (purity 99.999%; Goodfellow, Cambridge) after anodizing up to 1.4 V (HgO) at a l-mV/s scan rate in a 1 M NaOH solution. An optical band gap of 2.35 eV was determined for such a corrosion layer by assuming indirect optical transitions (see inset in the figure). By taking into account that an EOpt equal 3.50 eV is reported for anhydrous SnO2 films and that such an optical gap has been measured for passive films grown in neutral and acidic solutions under suitable conditions [18], we concluded, according to results reported in the literature, that the lower band gap measured for the corrosion layers formed in strongly alkaline solution must be attributed to the formation of a hydrated layer having a composition close
RUSSIAN JOURNAL OF ELECTROCHEMISTRY
Vol. 36
No. I !
2000
A SEMIEMPIRICAL CORRELATION to Sn(OH)4. Optical gap values intermediate between 3.5 and 2.35 eV have been attributed by us to the formation of oxy-hydroxides phases, SnO2_ mOH2m, having a variable hydration degree m. Such an interpretation is analogous to that initially suggested on the basis of a photoelectrochemical study of passive films grown on chromium metal in different electrolytes and successively confirmed with other in situ techniques (see below). Figure 2 displays the anodic photocurrent spectrum and the optical band gap determination of a corrosion film grown on an Mg electrode (purity: 99.9%) in a I M NaOH solution. No appreciable variation of the ~opt --g value was observed by changing the metal surface treatment (scraping or chemical etching in acid solution after the initial polishing with metallurgical papers). From the anodic spectrum of Fig. 2, an optical band gap of about 4.30 eV was obtained, whilst a slightly lower EOpt value (around 4.15 eV) was obtained for chemig cally etched surfaces. In the following, an average value of 4.25 + 0.1 eV will be assumed for the optical band gap of passive films grown on Mg in strongly alkaline solutions. By taking into account that optical band gap values ranging between 7.8 and 8.7 eV are reported in the literature for anhydrous MgO [7], it is reasonable to attribute the measured value of 4.25 eV to a hydrated oxide of composition close to Mg(OH) 2, in agreement also with the thermodynamic expectations of the Pourbaix diagram [ 19]. In Table 1 we report the optical band gap, the Pauling electronegativity of the metal, and the square of the electronegativity difference (Xi -Xan) between the different sp-metal cations and the OH group. From the data, it is possible to derive the following empirical correlation between the E~ft values of hydroxide films grown on sp-metals and~the square of the electronegativity difference: Eg = 1.21(X i - Xort) 2 + 0.90.
(4)
With respect to the analogous correlation obtained for sp-metal oxides Eq. (2a) the most relevant difference comes out from the second term of the right side, suggesting that sp-metal hydroxides always present a finite optical band gap, on the order of 1.70 eV for the most electronegative sp-metals. It is worth noting that, from Eq. (4), an optical band gap of about 2.25 eV is derived for Ni(OH)2 in very good agreement with the value estimated by assuming indirect optical transitions from the photocurrent spectra reported in the literature for passive films on Ni (E~gpt = 2.20 eV, [20]) and for ~-Ni(OH)2 deposited cathodically (E~gpt = 2.30 eV [21]). These findings confirm once more that, in the proposed correlations, Ni(II) oxide and hydroxide conform to the sp-metal behavior. RUSSIAN JOURNAL OF ELECTROCHEMISTRY
Vol. 36
1205
Photocurrent, nA 75
5000~.E~ ~
4 25 ~
~
0
I
200
300
hv, eV
I
400
I
500 Wavelength, nm
Fig. 1. Photocurrent spectrum, corrected for the photon emission of the light source, recorded in 1 M NaOH for an Sn electrode anodized at 10 mV/s up to 1.4 V (HgO); inset: determination of the optical band gap assuming indirect optical transitions.
Hydroxides of d-Metals (Cr, Zr, Y) The formation, on pure (99.99%) chromium metal, of passive films having chemical composition close to Cr(OH) 3 with a corresponding optical band gap of 2.40 + 0.05 eV has been inferred by us some years ago [22]. Such a suggestion [22, 23], initially confirmed by an EXAFS study [24], has also been confirmed by ex situ STM and XPS measurements [25, 26], and more recently by in situ XANES experiments [27]. Based on these findings, in the following, we attribute opt the Eo value of 2.40 eV measured for the passive films on chrommm to the Cr(OH) 3 phase. As for the passive films grown on Zr metal, we have reported [28] the formation of a duplex ZrO2/Zr(OH) 4 layer on a Zr electrode, with a thin external hydroxide surface layer having an optical band gap value of 2.75 + 0.1 eV and an internal ZrO2 oxide layer having a forbidden gap equal to 4.60 + 0.1 eV. This last value is in agreement both with the literature data pertaining to the theoretical band gap value (4.51 eV) of monoclinic ZrO 2 oxide [28] and the -fi~,opt value estimated by using -g Eq. (2a), which foresees a band gap of about 4.45 eV for crystalline anhydrous oxide. The small difference between the optical band gap values of the passive films and the crystalline phase (-