A RISK PREMIUM MODEL OF THE YEN-DOLLAR AND DM-DOLLAR EXCHANGE RATES Mitsuhiro Fukao
CONTENTS
Introduction
.................................
I. Movements of real yen-dollar and DM-dollar exchange rates . . . . . II. 111.
80 80
.......................... 85 Detailed specifications and estimation results . . . . . . . . . . . . . 90
Risk premium model
Conclusions
.................................
Bibliography
...............................
99 104
The author is a member of the Monetary and Fiscal Policy Division of the Economics and Statistics Department. Valuable research assistance has been provided by lsabelle Wanner. The author is also grateful to Jeffrey Shafer and Andrew Dean for helpful comments.
79
INTRODUCTION
Although the exchange rate is one of the most important economic variables, it has proved to be difficult to explain its movements empirically1. Most theoretical models predict that real exchange rates are determined by real interest rate differentials, balance of payments and other variables which affect market expectations. One of the difficulties of going from theoretical models to empirical estimation is apparently attributable to changes in the relative importance of various determinants of exchange rates over time. In the late 197Os, the sharp appreciations of the yen and the DM relative to the U.S. dollar were associated with the current account surpluses of Japan and Germany. But, in the early to mid- 1980s, the U.S. dollar appreciated steadily against the yen even though Japan was accumulating a current account surplus. This is frequently ascribed to a high real interest rate differential in favour of the dollar. This paper tries to explain exchange rate movements by taking account of factors that may have contributed to this apparent shift in the importance of various determinants of exchange rates. The first Part reports the movements of real yen-dollar and DM-dollar exchange rates and their presumed determinants. Part II develops a simple portfolio balance model with an explicit risk premium term and parameters wfiich are affected by structural shifts in the foreign exchange market, while Part 111 shows estimation results. The final section provides a brief summary and highlights some of the policy implications of the findings.
I. MOVEMENTS OF REAL YEN-DOLLAR AND DM-DOLLAR EXCHANGE RATES
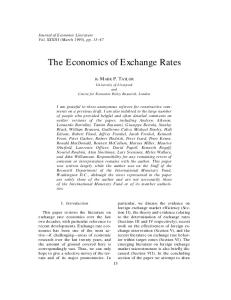
The real yen-dollar and DM-dollar exchange rate indices and their presumed determinants since the beginning of the current period of floating rates in 1973 are shown in Charts A and B. The real exchange rates are calculated by using GNP/GDP
80
CHART A
YEN-DOLLAR REAL EXCHANGE RATE AND ITS PRESUMED DETERMINANTS
-
170
14
-
130
-
120
-
180 150
-
1973
1974
-10
1976
1978
1977
1978
1979
1980
1981
1982
1983
1984
1986
180 150
1988
-.---...-. ,- -
Real long-term rate (Japan-US) Real short-term rate (Japan-US)
per cent
15
- 170
Real exchange rate index (1973 0 1 = 100)
Per cent
i'
-J
- -10 I l I I I i I I I I I I I l I I , l , , I
~ ~ 5 ~ 1 ' ~ ~ i l ' ' l l " l l l l l 1 1 1 1 1 1 1 I 1 1 1 1 1 1 1 1 1 1 ~
accumulated basic balance/OECD GNP - .......... Japanese Japanese accumulated current balance/OECD GNP
-
Per cent
2.0 1.5
-
1.0
-
0.5
-
Per cent
2.0
#'
,-'-
1.5
-
- 0.5
'
1973
~
1974
~
1976
~
1978
~
1977
~
1978
~
1979
~
1980
81
~
1981
~
1982
1983
~
19W
~
1985
~
1988
0
-0.5 ~
~
~
~
~
~
~
~
~
CHART B
DM-DOLLAR REAL EXCHANGE RATE AND ITS PRESUMED DETERMINANTS 140
-
130
-
-
Real exchange rate index (1973 0 1 = 100)
- 140
- 130 - 120 - 110
90-
8070
1973
1B74
........... l0 r
Per Cent
1976
1978
1977
1978
1979
1980
1981
1982
1993
1984
1996
Real long-term rate (Germany-US) Real short-term rate (Germany-US)
1980
Per cent
1 l0
A
-
-2
00
8 6
-
4
-
2
-
-4-
1973
1976
1978
1977
1978
1979
1980
1981
1982
1993
1984
1986
1980
- EMS .......... -
Per cent
1 .o
1974
____
accumulated basic balance/OECD GNP EMS accumulated current balance/OECD GNP German accumulated basic balance/OECD GNP
Per cent
3 1.0
0.8 0.8 0.4 0.2
0
- 0.2 -0.4 -0.8
1 1 1 1 1 1 1 1 1 1 1 1 1 1 1 , 1 1 1 1 1 1 1 1 1 1
1173
1B74
1176
1978
1877
1971
1979
1 1 1 1 1 1 1 1 , 1 1 1 , , 1 i , , 1 1 , , , 1 1 1 1
1980
82
11111
1982
1993
1984
1986
1986
deflators. The real interest rate differentials are estimated by using ex post GNP/GDP deflator inflation rates and indicate relative yields on financial instruments denominated in the yen, the DM and the dollar as measured in own currency terms. The accumulated current balance and narrowly-defined basic balance (equal t o the current balance plus the direct investment balance) indicate the portfolio pressures generated by cumulated balance-of-payments imbalances since 1973. In the case of the DM-dollar exchange rate the accumulated balances of EMS countries are shown in addition to the German basic balance. This is because the real exchange rates among EMS countries have been fairly steady compared with yen-dollar or DM-dollar real exchange rates and, consequently, it is possible to regard this region as a DM currency area. Until the early 198Os, the accumulated basic or current balances are reasonably well correlated with the real exchange rates of Japan and Germany. The timing of the sharp appreciation of the yen in 1978 and the depreciation in the next year corresponds to the swing of the accumulated balances. The high DM period of 1978 to 1980 also coincides with the peak of EMS balances with the EMS balances being more closely correlatedwith the DM-dollar real exchange rate than the German basic balance. However, these relationships appear to break down after 198 1. While Japan has accumulated surplus rapidly since then, the yen stayed weak until mid- 1985. The DM depreciated further while the accumulated basic balance stayed steady. Note to charts A and B
Real exchange rates: Quarterly average of nominal yen-dollar and DM-dollar exchange rates were adjusted by the GNP/GDP deflators of the United States, Japan and Germany. Realinterest rate differentials: Nominal interest rates were first adjusted bythe expostinflation rate of the respective country and then the real interest rate differentials between Japan/Germany and the United States were derived. Short-term rates: United States: 3-month Treasury bills; Japan: call money; Germany: 3-month interbank rate. Long-term rates: United States: AAA corporate bonds; Japan: Telephone and Telegraph bonds; Germany: public sector bonds. Short-term ex post inflation rate: 100 x [(P,+,/P,,)~/~
-1
1
Long-term ex post inflation rate: 1oox [(Pt+4/Pt)-j P, = GNPIGDP deflator at quarter t. For the short-term ex post inflation rate, the formula is equivalent to 3-quarter moving average of 1-quarter ahead rate of inflation. OECD forecasts are used for the recent period. Accumulated current balances: Current balances were accumulated from 1973 Q1 and divided by OECD GNP. The EMS numbers cover only Germany, France, Italy, the Netherlands and Belgium. Accumulated basic balances: Current balances plus direct investment balances were accumulated from 1973 Q1 and divided by OECD GNP. The definition of EMS is the same as above. The direct investment balances of the Netherlands and Belgium were set t o zero due to data problems.
83
Meanwhile, during the first half of the 1980% real long-term interest rate differentials were closely correlated with real exchange rates with real short-term interest rates being less closely correlated. Finally, for the most recent period, the sharp appreciationof the yen and the DM corresponds to the swing in real long-term interest rate differentials and the continued surplus in current or basic balances. These observations are confirmed by the correlation coefficients between the real exchange rates and their presumed determinants shown in Table 1. These coefficients are calculated for two periods, from 1973 to 1980 and from 198 1 to 1986. Regarding the yen-dollar rate, the correlation coefficient with the real long-term interest rate increased from 0.42 in the earlier period to 0.66 in the more recent period. The correlation with the short-term differential stayed low. On the other hand, the correlation of the accumulated current balance declined from 0.89 to 0.52 between the two periods with the correlation of the basic balance showing a similar decline. The DM-dollar real exchange rates were negatively correlated with real interest rate differentials in the earlier period, but were highly correlated in the recent period, especially the long-term differential. While the correlation of the accumulated EMS current balance declined, that of the basic balance increased slightly but both were higher than the correlation of the German basic balance in the two periods. Here, it is necessary to note that the correlation coefficient merely indicates the closeness of the direction of movements.
Table 1. Correlation between real exchange rates and their presumed determinants Yendollar real exchange rate
Japan-U.S. long-term real interest differential
0.42
0.66
Japan-U.S. short-term real interest differential
0.18
0.17
Accumulated Japanese current balance/OECD GNP
0.89
0.52
Accumulated Japanese basic balance/OECD GNP
0.82
0.54
DMdollar real exchange rate 1973Q1-198004
198101-1 986Q4
German-U.S. long-term real interest differential
-0.20
0.71
German-US. short-term real interest differential
-0.20
0.56
Accumulated EMS current balance/OECD GNP
0.59
0.42
Accumulated EMS basic balance/OECD GNP
0.46
0.52
Accumulated German basic balance/OECD GNP
0.12
0.18
al
See Notes to Charts A and B for details of the data.
84
This evidence seems to indicate that there has been a shift in the relative importance of the balance-of-paymentsfactor and the real interest rate factor. In the earlier period, the balance-of-payments factor was dominant while in the more recent period, the real long-term interest differential has become more irnportant. A possible cause of this structural change in the determinants of exchange rates is the increasing internationalization of financial markets. In the 1970s and 1980s there was a significant degree of deregulation of exchange controls and an accompanying rapid growth in international financial transactions2. These developments have increased the depth of the foreign exchange market. Increases in the number of participants and transactions in the market made it possible for the market to accommodate large portfolio pressures created by the balanceof-payments imbalances without large exchange rate movements. Furthermore, the increased depth of the market is also expected to strengthen the extent to which changes in real interest rate differentials affect the exchange rate, given that investors' expectations are formed rationally. If basic balances have less effect on the exchange rate, then the overvaluationof a currency brought about by an increase in the domestic real interest rate is not directly rectified by exchange rate adjustments induced by deficits in the basic balance. As the effect of the basic balance becomes weaker, more real appreciation of the home currency is therefore required to raise expectations of a future real depreciation of the home currency which would be sufficient to offset the real interest differential between domestic and foreign assets. Thus, as the internationalizationof financial markets progresses, the relative effect of real interest rate differentials becomes more important while that of basic balances becomes less strong.
II.
RISK PREMIUM MODEL
In order to explain past movements of the real yen-dollar and DM-dollar exchange rates, this section develops an exchange rate model which explicitly takes account of the portfolio pressures of balance-of-payments imbalances. Suppose that there are three currency areas in the world, namely the yen, the DM and the dollar areas. Suppose also that the investors of each currency area regard their own currency as risk-free and foreign currencies as risky because of their consumption bundle and that investors behave in the framework of simple rnean-variance analysis. 85
Regarding the group of Japanese investors, their demand for DM and dollar denominated financial assets can be written as follows3:
Here, the superscriptjdenotes Japan and subscripts 2 and 3 denote the DM and the dollar respectively. Variables are defined as follows:
Xi Xi c'
=
Mi
=
Bi Bi
= =
= =
the demand for DM assets by Japanese investors the demand for dollar assets by Japanese investors the positive coefficient related to the risk aversion and the wealth of Japanese investors the anticipated variance-covariance matrix of future DM-yen and dollar-yen real exchange rates the expected return on DM assets minus that on yen assets the expected return on dollar assets minus that on yen assets.
Similar foreign currency asset demand functions can be derived for German and
I:[
U.S. investors. For German investors:
[c:]
=
cg
fMg)-'
PI
Here, the superscript g denotes Germany and subscripts 1 and 3 denote the yen and the dollar respectively, with variables defined as follows:
X:, X! Cg
= the demand for yen and dollar assets by German investors = the positive coefficient related to the risk avesion and the
Mg
=
G
=
B83
=
wealth of German investors the anticipated variance-covariance matrix of future yen-DM and dollar-DM real exchange rates the expected return on yen assets minus that on DM assets the expected return on dollar assets minus that on DM assets.
For U.S. investors, a symmetric equation holds:
86
where the superscript U denotes the United States, with variables being defined in similar ways to before. These foreign asset demand functions satisfy market-clearing conditions in an equilibrium. In a world of three currency areas, the net external assets of three groups of investors in each currency have to sum to zero. Thus, we have
x; x; xi
+ x; + x ; = 0 + x: + x; = 0 + xg, + x; = 0
141
where Xif is the net external yen-denominated assets held by Japanese investors4. This is determined by the following balance sheet constraint on Japanese investors which includes DM and dollar asset demands, X i and X i as given in equation [ 11: X:
+Xi+
X i = Bi
~51
where B i is Japan's net total external financial assets, given by the cumulative net financial flows from the past. X : and X : in equation [4] are the net external DM assets held by Germany and the net external dollar assets held by the United States and they are derived similarly using the following balance sheet constraints and the foreign asset demands given in equations [2] and [3].
X?
x;
+ X ; + X: = + x; + xu, = Bu
Bg
[61 [71
Ifexpectations are the same among investors of all nationalities, the expected rate-of-return differentials will satisfy the following equations: fi; = f i ; - f i ;
84 = 4 3 ;
[81
fi: = s;-a; fi; = 4 3 ;
That is, out of six possible rate-of-return differentials, only two are independent. Similarly, it can be proved that the following relationships hold among three variance-covariance matrices (see Fukao, M., 1983). M i = H i M UHi ~g = H~ M U H ~
[91
where H I and H2 are the following 2 X 2 matrices.
-1
=
[-1
.] 1
H2=
[:I:] 87
This is because, out of three currencies there are only two independent real exchange rates. Moreover, if the expectations are the same for all, three variance-covariance matrices are only expressing the same uncertainty from three different viewpoints. From equations [8] and [9], it can be observed that the asset demand functions of Japan and Germany (equations [ 11 and [2])can be expressed by using B y, B: and M Uall of which are expressed from the U.S. viewpoint - that is in terms of rate-of-return differentials and exchange-rate uncertainty vis-4-vis the dollar. Out of three market-clearing conditions shown in [4], only two are independent due to Walras' law. By substituting asset demand functions re-expressed by B y, B and M uinto the first two equations of 141, we can solve for equilibrium return differentials after some algebra (see Fukao, M., 1983).
where c (>0)is the summation of cj, cg and cu. These rate-of-return differentials can be regarded as the risk premia required from the portfolio pressures due to accumulated balance-of-payments imbalances Bj and 6 s . The rate-of-return differentials are functions of the cumulative imbalances and the variance-covariance matrix of future real exchange rates. The attitudes towards risk aversion and wealth of all three countries affects the value of the parameter c. In order to derive real exchange rate equations from these equations for expected rate-of-return differentials, we assume regressive expectations for the future movements of exchange rates. Then By and 13: are expressed as follows:
where
d, f g , r u
=
7, g,"
=
g
the real interest rates of Japan, Germany and the United States respectively, expressed as nominal rates on national currency less national inflation rates the logs of the expected long-term equilibrium real exchange rates of the yen and the DM against the dollar (the dollar price of one unit of the respective currency)
88
e
b
3
3
e2
= =
the logs of the current real exchange rates of the yen and the DM against the dollar a positive coefficient representing the time period within which real exchange rates are expected to converge to their long-term equilibrium rates.
By using equations [ 101 and [ 111, we can derive a real exchange rate equation which can then be estimated.
7)
This equation shows that the yen-dollar fe and the DM-dollar fez) real exchange 3 3 rates are determined by the equilibrium real exchange rates fg g2),the bilateral real interest rate differentials frj - ru, r g - ru), and the external financial assets (BJ,Bg). The last term corresponds to the risk premium pressure in the foreign exchange market. Unlike two-country models, the term shows a third country effect. Unless the covariance matrix MU is a diagonal matrix (i.e. zero correlation between yen-dollar and DM-dollar exchange rates), both Japanese and German external asset positions affect the two independent real exchange rates. The above equation was derived under the rather arbitrary assumption of regressive expectations. But is has an advantage over other ad hoc possibilities in being consistent with rational expectations over long time horizons. When the 3 3 3 3 current real exchange rate is above the equilibrium rate fe > g or e2 > g2),the country with overvalued currency tends to run current account deficits. This would reduce its external assets. Since the diagonal elements of M uare positive, a fall in the external assets induces a fall in its real exchange rate. Therefore, the expectation that real exchange rates will move towards their equilibrium rates will be realized in the long run. Whether this is consistent with rational expectations in the short run will depend on the dynamics of the entire 3-country macroeconomic system, which is not specified here. Although exchange rates themselves do not seem to have a tendency to move consistently in accordance with the multivariate time series behaviour that would be required to render such expectations rational, the time series processes of exchange rates are sufficiently unstable as to make no simple characterisationof expectations rational over a long period of time. Perhaps more to the point, research using survey data indicates a strong regressive element in actual expectations as stated by market participants5.
89
As discussed in Part I, as the internationalization of financial markets progresses, the relative effect of the risk premium factor becomes weaker. In terms of equation [ 121, the coefficient, c, becomes larger as the number of investors who hold foreign assets increases; the wealth invested in internationally-diversified portfolios expands, hence reducing the effect of the risk premium factor. At the same time, this declining importance of the risk premiumfactor affects the formation of expectations on the future movements of the real exchange rate. As the rectifying effect of balance-of-payments pressure weakens, the period of exchange-rate misalignment becomes more persistent. This weakens the regressive expectations, making the expectations parameter, 6, larger. The combined effect is a larger cand a larger 6 but smaller (6/c)because the first-round effect of an increase in c has to dominate the second-round effect of an increase in b6.
111.
A.
DETAILED SPECIFICATIONS AND ESTIMATION RESULTS
Specification for estimation
The exchange rate equation [ 121 was tested with the data from the beginning of 1973 to the end of 1986. For the dependent variable, the logs of real yen-dollar and DM-dollar exchange rates adjusted by GNP/GDP deflators are used7. As for the real interest rate differentials, real long-term interest rates are used in view of the better correlation with the real exchange rates shown in Table 1. Regarding the expected rate of inflation, past one-year inflation was used as well as the ex post one-year inflation rate (i.e. perfect foresight; see Notes to Charts A and B for more details). Three variables were tested for the risk premium factor: i) Accumulated current balance minus reserves; ii) Accumulated current balance; iii) Accumulated current balance plus accumulated direct investment balance.
If interventions by the monetary authorities were exogenous to the foreign exchange market, it would be appropriate to subtract the portion of portfolio pressures borne by the authorities. We have tried a very rough adjustment by subtracting the reserves of Japan and Germany from their respective accumulated current balances lacking more precise data on intervention*.
90
In practice, while interventionaffects exchange rates by changing the supply of assets denominated in different currencies, exchange rate movements also affect the amount of intervention. When the second relationship is very strong, it is not possible to measure the effect of intervention on exchange rates using estimated g equations . Since reserves are often very highly correlated with exchange rates due to "leaning-against-the-wind" intervention policy, they were not included as an independent variable to measure the effects of intervention directly' O. On the other hand, under certain conditions, it is possible to abstract from official interventions in the estimation of exchange rate equations. Consider the following conditions: i) ii)
The authorities are accommodating a constant portion of portfolio pressures created by balance-of-payments imbalances; The private sector thinks that the reserves held by monetary authorities are, in fact, its own assets (Ricardian hypothesis).
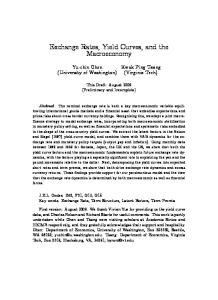
In the first case, the authorities' asset-liability structure is always similar to that of the private sector. In the second case, the private sector takes account of the official portfolio structure in its investment decision. Therefore, it is possible to use the second and the third definitions of the risk premium variable - the accumulated current balance or accumulated current and direct investment balances - in the estimation. There is a conceptual problem with current balances which are often used to measure portfolio pressures. Since only the external financial asset position is relevant to the risk premium factor, it is desirable to adjust for the existence of the external non-financial asset position' l . Although the direct investment balances of balance-of-payments statistics do not exactly correspond to changes in real external non-financial asset positions, we define a basic balance by adding the current balance and direct investment balance to approximate the true changes in the external financial asset position. Since the variables for the risk premium factor are in nominal terms, they are normalized by dividing through by nominal OECD GNP. As for the variance-covariance matrix, M",the variance-covariance matrix of changes in the real exchange rates during the entire estimation period was used, other specifications proving less satisfactory' 2. Finally, some measure of liberalization in the financial market is required to capture how the parameters 6 and c may have changed over time. Theoretically, the measure should indicate the size of the wealth of investors who actively shift their uncovered foreign assets following changes in expected yield differentials. For this purpose, an index of financial openness is calculated. The average of gross external assets and liabilities relative to GNP/GDP of the four major countries for whom data
91
are available (the United States, Japan, Germany and the United Kingdom) are combined to form an index with 1 9 8 2 GNP/GDP weights: I
( 1 9 7 3 0 1 = 1.0) i=l
= =
If Wi
=
Ai Li Yi
= =
Ti
financial openness index weight of GNP/GDP of country iin total in 1982 gross external asset of country i gross external liability of country i GNP or GDP of Country i.
The index, as shown in Chart C, is essentially a trend variable which is equal to one in 1 9 7 3 0 1 and is equal to 1.96 in 198604. As explained a t the end of the previous Part, as the foreign exchange market gets bigger, the effect of the risk premium factor becomes smaller and that of real interest differentials becomes larger. In estimation, the real interest rate differentials were multiplied by this index and the risk premium variables were divided by it.
CHART C
FINANCIAL OPENNESS INDEX ( 1 9 7 3 a 1 = 1.0)
-
2.0
-
-
1.7
1.6
-
-
1.6
1.5
-
-
15
1.4
-
-
14
1.2 -
-
1.3
-
12
-
1.1
-
1.0
-
0.9
2.0
-
19
-
1.8
-
1.7
1.3
0.9
o
. 8 1973
" ' 1974 1975
~
~ 1976
~ 1 " 1977 1976
~ 1 ' " ~ 1979 1980 1981
92
~ ~ ~ 1982 1983
~ ~ 1984
t ~ ~ 1965 1986
0.8 '
~
~
~
'
~
~
1
'
t
~
~
'
~
~
The estimated equations, which incorporate the above detailed specifications, are as follows: 3
= a, e2 = bo el 3
+ ai * I f
+ bi * I f
Y Y
+ +
- r U ) a2 Y (MYl Y BJ (rg - r U ) b2 * (M& * Bi
(ri
+ MY2 * Bg)/(Y
+ El + M L * Bg)/(Y * I f ) + 6, o
If)
where: the logs of yen-dollar and DM-dollar real exchange rates the estimated parameters financial openness index real long-term interest rates of Japan, Germany and the United States the variance-covariance matrix accumulated balances nominal OECD GNP error terms. B.
Estimation results
Out of many estimated equations, basic results are shown in Table 2. These equations use one-year expost inflation rates for the calculation of real interest rates. The use of past inflation rates increased the standard errors of estimated equations almost twofold. As can be observed in the table, the accumulated current account and basic balances performed well. Equations [B] and [C] for the yen-dollar rate and [E] and [F] for the DM-dollar rate have significant and correctly-signed parameters on interest rate differentials and risk premium variables. On the other hand, foreign exchange reserve adjusted current balances do not work well (equations [A] and [D]). Although the parameters have the correct positive sign, they are not significant at the 5 per cent level. These results might indicate that the leaning-against-the-wind policy meant that the effects running from exchange rates to intervention were stronger than the effects of intervention on rates. Charts D and E show the decomposition of exchange rate movements using preferredequations [C] and [F]. As can be seen, residuals are sometimes very large. In particular, equation [F] cannot explain the sharp fall of the DM from the second half of 1984 to early 1985, which is often attributed to a speculative bubble against the DM. These large and sometimes persistent residuals are the cause of relatively low Durbin-Watson statistics even after the application of the Cochrane-Orcutt procedure. However, the equations can explain the sharp appreciationof the yen and
93
CHART D
DECOMPOSITION OF EXCHANGE RATE MOVEMENTS Japan
..........
I
4.9 -5.0
1
4.0 Real exchange rate (actual) Real exchange rate (predicted)
4.9
n
-5.0
-5.1
-5.2
-5.3
-5.4
-5.5 -5.6
-5.1
-5.8
-
,
Real interest rate differential
0
-0.1
V l
I 1 1
1 1 1
1 1 1
1 1 1
I
I
1 1 1
I # , I I I I
I
1973
1974
1976
1976
1977
1978
1979
1980
1982
I
0.3 0.2
0.1
l
-
I
1981
I
#
I
1
1
1
1983
1 1 ,
, , I
1 1
1984
1986
1988
Risk factor
0.3
-
0.2
-
0.1
0
0
1973
1974
1976
1978
1977
1978
1979
1980
94
1981
1982
1983
1984
1986
1988
CHART E
DECOMPOSITION OF EXCHANGE RATE MOVEMENTS Germany
.........
-
-I
Real exchange rate (actual) Real exchange rate (predicted)
4.3
Real interest rate differential
-
0.3
1
-
Risk factor
-
o 0.1
.
z
0
4.1
0.3 0.2
~
\
,I,,, 1973
1974
I
,
,
1976
,,,
,
1976
1977
(
,
, , , I 1978
4.1
1979
1980
95
1981
1982
1983
19M
1986
1986
Table 2. Real exchange rate equations Basic results
(197301-1986Q4) Risk premium
Constant
Real long-term interest differential
Accumulated :urrent balance ninus reserves
Accumulated current balance
Accumulated basic balance
R* S.E.
RHO
DW
0.84 0.053
1.20 0.89
0.88 0.047
1.28 0.85
0.88 0.047
1.28 0.84
0.92 0.053
1.49 0.92
0.94 0.049
1.62 0.92
0.94 0.049
1.61 0.90
Yen-dollar
[AI
-5.338
0.7483 (2.08)
181
-5.457
0.8360 (2.63)
[Cl
-5.388
0.7812 (2.49)
PI
-0.6466
1.5010 (2.85)
[El
-0.7961
1.2371 (2.53)
[FI
-0.7261
1.2282 (2.64)
4218 (1.35) 11 245 (4.23) 12 565 (4.44)
DM-dollar
1 348 (0.42) 10 074 (3.1 3) 9 735 (3.16)
al A CochraneOrcutt estimation method was used. bl Figures in parentheses are t-statistics. cl R2 are error-based adjusted numbers at the original level of dependent variable. dl Real long-term interest differentials are multiplied and risk premiums are divided by financial openness index
el The variance-covariance matrix M u used in the equation is as follows: Yendollar DM-dollar
Ydollar
DMdollar
3.312*10-' 2.028*10-'
3.258*10-'
Enimatm period: 197301498804.
the DM in 1978 and the subsequent fall. They also follow the appreciation of the t w o currencies after 1985. Large fluctuations are explained by the risk premium factor which indicates portfolio pressures. However, shorter exchange rate swings correspond t o changes in real interest rate differentials. Table 3 shows the effects of changes in real interest rates and basic balances on real exchange rates. A 1 percentage point increase in the long-term real interest rate in Japan and Germany leads t o an estimated appreciation of their exchange rates by 1.53 and 2.52 per cent respectively as of the fourth quarter of 1986. Since the equation includes the financial openness index in the real interest term, the effect of a change in real interest rate differentials becomes larger as financial openness increases. Regarding the risk premium factor,
96
Table 3. The effects of changes in real interest rates and basic balances on real exchange rates Per cent One percentage point increase in real long-term interest rate
(1986Q4) 1.53 2.52
Yen-dollar DMdollar
a/ Calculated from the equations [C] and [F] in Table 2 as follows: (parameter on real interest rate differential) + (If in 1986Q4 1.9591 $10 billion surplus in basic balance
(1986Q4)
Yen-dollar DM-dollar
In Japan
In EMS
1.77 0.84
1.08 1.35
a/ Calculated from the equations [C] and [F]in Table 2 as follows (parameter on risk premium) (vanance matrix in Table 211 [(OECD GNP in 1986Q4 1.199*1031*(Ifin 1986Q4 1.95911.
Table 4. Real exchange rate equations Robustness test (1 97301-198404) Real long-term interest differential
Constant
Risk premium accumulated current balance
R2
D.W.
S.E.
RMSE of prediction for
1985Q1-198604
Yen-dollar
[GI
-5.3819
0.6448 (2.07)
13 451 (2.99)
0.87 0.045
1.37 0.85
0.057
-0.7791
0.8422 (1.541
10 518 (2.481
0.92 0.050
1.69 0.95
0.045
DM-dollar
[HI ~~~
a/ The variancwovariance matrix for hP is as follows: Ydollar DM-dollar E m k m &:
Yen-dollar
DMdollar
2.75*1@ 1.48*1@
2.86*1W3
197301-198604.
U See Note to Table 2 for detail.
97
CHART F
YEN-DOLLAR RATE -5.0
-5.1
-5.2
6.3
-5.4
-5.5
-5.6 1sw
1S86
1986
DM-DOLLAR RATE
- - Actual .......... Predicted - 0.7 -
- 0.6
- 0.8
- 0.9
7
-0.6
- 4.7 -
-
- - 0.8
-
-
-
- -0.9 - -1.0
-1.o
-
-
-1.1
-1.2
-1.1
I a4 1sw
I
a1
I
02
I
I
(U
a4
1986
I
I
ai
19)o
98
I
a3
02
a4
-1.2
the effect of the basic balance is shown in the lower panel. A $10 billion surplus in the basic balance in Japan leads t o an appreciation of the yen by 1.77 per cent and the DM by 0.84 per cent. A $10 billion surplus in the EMS leads to an appreciation of the yen and the D M by 1.08 per cent and 1.35 per cent respectively’ 3. Since we are assuming a 3-currency world, the counterparts of these basic balance surpluses are implicitly assumed to be U.S. deficits. These calculations are based on OECD GNP and the financial openness index as of the fourth quarter of 1986. As OECD GNP and financial openness increase further, the effects of the basic balance will decrease. In order to test the robustness of the equations, preferred equations are re-estimated with the data up to the end of 1984. Therefore, the variancecovariance matrix was re-estimated with the data up to 1984 and the risk premium variables were recalculated. The results are shown in Table 4. Except for the reduced significance of the real interest rate differential in the DM equation, the t w o equations are similar t o the corresponding ones in Table 2. Then, the equations are used t o test the out-of-sample prediction capability. The model tracks the sharp appreciation of the yen and the DM well (see Chart F). The root mean square errors of the predicted real exchange rates during the 19850.1- 1986Q4 period are 5.7 per cent for the yen and 4.5 per cent for the DM. These are close t o the standard errors of the equation.
CONCLUSIONS
This paper has developed a simple exchange rate model and tested it with the yen-dollar and the DM-dollar exchange rates. Although the residuals are large, the estimated equations can explain major swings in real exchange rates. The results show that portfolio pressures are playing an important role and that risk premium factors are highly ~ignificant’~. A t the same time, real interest rate differentials are becoming more important in recent years with the continuing increase in international financial transactions. It has sometimes been argued that higher capital mobility would make it easier to finance large balance-of-payments imbalances because of the increased depth of the foreign exchange market. However, as shown in Part II, higher capital mobility makes exchange rates more sensitive to real interest rate differentials. Larger exchange rate misalignments due t o real interest rate differentials generate larger
99
balance-of-payments imbalances. These, in turn, create portfolio pressures and exchange rate misalignments. Therefore, higher capital mobility does not solve the balance-of-payments problems. It merely postpones the emergence of these pressures. If corrective policy action is also postponed, the imbalances become larger and more difficult to rectify before markets enforce adjustment. Another long-term problem with such exchange rate misalignments is the long cycle of exchange-rate swings. Since the accumulated basic (or current) balance affects the level of the exchange rate, a country with accumulated surplus tends t o have an overvalued currency for a long time until the accumulated surplus is used up by a flow of deficits. However, when the exchange rate approaches its presumed equilibrium level, the country would still have flow deficits. This, in turn, pushes its exchange rate lower, beyond the equilibrium level for a period. Thus, the stock-flow interaction can generate a long cycle of exchange rate swings characterized by overshooting. After fifteen years of experience with the floating rate system, it has become clear that market forces alone cannot create stable exchange rates. Given that some of the large swings in real exchange rates are explained by real interest rate differentials and balance-of-payments imbalances, it would be necessary to avoid large swings in these variables to avoid exchange rate misalignments. A greater degree of policy coordination may be the only way to achieve this more stable economic environment.
100
NOTES
1.
Meese and Rogoff (1 983) showed that the random walk model predicts better than some structural models outside of the sample period. lsard (1986) provides a survey on exchange rate models.
2. Fukao and Hanazaki (1 987) presents some aspects of exchange decontrols and consequent increases in international financial transactions.
3. This is a standard results under the current assumptions. See Fukao (19831, Branson and Henderson (19851, Frankel (1 985) for example. This Part follows Fukao, M. (1983) closely.
4.
The elements of equation [4] have t o be expressed in the same unit of currency. This conversion exchange rate is important in the equations [ 5 ] - [ 7 ] because of the existence of capital gains and losses through exchange rate movements. In these equations, capital gains or losses from exchange rate movements are abstracted. If we take account of these effects, the equations require some adjustments. For example, equation [5]with these adjustments can be derived as follows. The flow of Japanese current account surplus, BCj , and the levels of external assets have the following relationship:
Z E : j ( j = BCi i where E : is the price of the ith currency in terms of the dollar and the dot indicates the time derivative. The summation over i runs from 1 t o 3. By integrating both hands of the above equation, we have:
l:;X;ds=
/_2i ds.
Using integration' by parts, the equation can be transformed t o the following form:
2E:Xji-Z i
[;-3
E ; X ji d S =
[F
ds.
By replacing the accumulated current balance by @ and rearranging the terms, we have
2 E: X ( = B i i
+Z
E
X ji ds.
This equation shows that the net external asset holding (the left-hand side) is determined by the accumulated current balance, Sj, and the accumulated capital gains and losses.
101
is paper the above true equation is simplified into the equation [5]. This simplification requires the following assumptions: i) by choosing the unit of currency appropriately, the ~ set t o one (1 .O) and, then, deviations from one are disregarded; exchanges rates € 7 are ii) the term which indicates capital gains and losses is set t o zero and is disregarded. Furthermore, the effect of capital gains and losses on the foreign asset demand functions are also disregarded. These approximations can be justified under certain conditions. See Fukao, M. ( 1 983) for details. 5.
Frankel and Froot (1 985) showed that survey data of exchange rate expectations indicate strong regressive expectations.
6. This proposition is proved in the framework of a two-country rational expectations model by Kyoji Fukao (1 983).
7.
Although consumer price indices are preferable from the viewpoint of the investors' decision-makingprocess, purchasing power parity requires the broadest possible measure of price levels. Thus GNP/GDP deflators are used as a compromise. Officer ( 1 978) suggests that GNP/GDP deflators are the best measures for the PPP theory.
8.
If we knew the currency composition of assets and liabilities of all the monetary authorities, we could adjust the accumulated current balances with the consolidated balance sheet of monetary authorities (see Fukao, 1985). Although we can observe the level of foreign reserves, their currency composition is not disclosed. Furthermore, there is no data on the foreign currency liabilities of monetary authorities. Here, we adjusted only for Japanese and German reserves. This is because it is often reported that while the reserves of these t w o countries are mainly held in dollars, other central banks have large amounts of other currencies. European central banks other than the Bundesbank have large amounts of European currencies to support the EMS. Since interventions of one European currency t o support another European currency can be netted out by consolidating the balance sheets of European central banks, they do not show up in our analytical framework of the yen, DM and dollar.
9.
If the amount of intervention is strictly proportionate to the exchange rate movement, it is impossible t o identify the effect of intervention statistically.
10. When the monetary authorities try to dampen exchange rate movements, they sell a currency t o prevent its appreciation and buy it to prevent its depreciation. In this case, the change in the level of reserves is proportionate t o the change in the exchange rate and, consequently, the level of reserves is correlated with the level of the exchange rate. See Fukao ( 1 985) for more detail. 11.
Even if a country has an accumulated current account surplus, if it has an equivalent amount of non-financialexternal assets through foreign direct investment, the country does not have t o hold any net foreign financial assets.
12.
Regarding the variance-covariance matrix, M u, the following alternative specifications were tried: i) variance-covariance matrix of levels of real exchange rates during the entire estimation period; ii) variance-covariance matrix of levels of real exchange rates with moving sample period. However, these alternative specifications led t o a considerable deterioration in the results.
102
13.
These estimated effects of basic balance can be interpreted as the effects of government intervention under certain conditions. If the government is financing a fixed portion of basic balance through intervention it is difficult t o estimate the effect of intervention directly (see Note 9). However, if the government conducts intervention in addition to the routine intervention, the effect of the former intervention is equal to the effects of basic balance. A $10 billion purchase of the dollar by yen sales lowers the yen by 1.77 per cent and the DM by 0.84 per cent against the dollar. A $10 billion purchase of the dollar by DM sales lowers the DM by 1.35 per cent and the yen by 1.08 per cent respectively. These estimated effects do not take account of the induced changes in expectations. See Fukao ( 1 985).
14.
Krugman (1 981 ) and Frankel (1985) argued that given the empirical estimate of relative risk aversion (about 2), the risk premium required t o finance the balance-of-payments imbalances is of negligible magnitude theoretically. Krugman also argued that the economic gain from portfolio diversification is so small that a relatively minor transaction cost prevents international diversification. However, these two a prior; calculations are self-contradictory, If the gain from diversification is small compared with transaction costs, many small investors would not participate in the foreign exchange market. This would reduce the effective size of the market and increase the risk premium by making the effective relative risk aversion larger.
103
BIBLIOGRAPHY
Branson, W.H. and D.W. Henderson (19851, "The specification and influence of asset markets" in Handbook of International Economics, Vol. 2, ed. R.W. Jones and P.B. Kenen. Frankel, J. (1985). "The dazzling dollar", Brookings Papers on Economic Activity 1. Frankel, J.A. and K. Froot (1 9851, "Using survey data t o test some standard propositions regarding exchange rate expectations", NBER Working Paper No. 1672 (July). Fukao, K. (1983), "Determinants of exchange rate and speculative demand for foreign exchange", Bank of Japan Monetary and Economic Studies (Japanese edition), Vol. 2, No. 4 (December). Fukao, M. (19831, "The theory of exchange rate determination in a multi-currency world", Bank of Japan Monetary and Economic Studies, Vol. 1, No. 2 (October). Fukao, M. (1985), "The effectivness of coordinated intervention", Japan Center for lnternational Finance Policy Study Series No. 3 (April). Fukao, M. and M. Hanazaki (19871, "Internationalization of financial markets and the allocation of capital", OECD Economic Studies No. 8 (Spring). Isard, P. (1986), "Alternative approaches t o the empirial modelling of exchange rates: where is the profession now?" paper presented a t a conference on 'Empirical Macroeconomics for Interdependent Economics: Where Do We Stand?', held at the Brookings Institution in Washington D.C. on 10th-11th March 1986. Krugman, P. (1981 1, "Consumption preferences, asset demands and distribution effects in international financial markets", NBER Working Paper No. 651 (July). Meese, R. and K. Rogoff (1983), "Empirical exchange rate models of the seventies: do they fit out of sample?", Journal of International Economics 14. Officer, L. (19781, "The relationship between absolu;te and relative purchasing power parity", Review of Economics and Statistics 60, pp. 562-68.
104