Arthritis & Rheumatism (Arthritis Care & Research) Vol. 59, No. 1, January 15, 2008, pp 92–101 DOI 10.1002/art.23239 © 2008, American College of Rheumatology
ORIGINAL ARTICLE
A Randomized Controlled Trial of the People With Arthritis Can Exercise Program: Symptoms, Function, Physical Activity, and Psychosocial Outcomes LEIGH F. CALLAHAN,1 THELMA MIELENZ,1 JANET FREBURGER,1 JACK SHREFFLER,1 JENNIFER HOOTMAN,2 TERESA BRADY,2 KATHERINE BUYSSE,1 AND TODD SCHWARTZ1
Objective. To evaluate the basic 8-week People with Arthritis Can Exercise (PACE) program for improvements in primary (symptoms, functioning, level of physical activity) and secondary (psychosocial) outcomes. Methods. A total of 346 individuals with self-reported arthritis from 18 sites participated in a randomized controlled trial of PACE. Outcomes were measured at baseline and 8 weeks. The intervention group completed self-reported assessments at 3 and 6 months. Two-level multiple linear regression models were estimated to calculate adjusted outcome means in the intervention and control groups. A mixed-effects repeated-measures model was used to calculate adjusted means in the intervention group at 3 and 6 months. Both intent-to-treat (ITT) and as-treated (AT) analyses were conducted. Results. At 8 weeks, the intervention group had improvements in the following outcomes: 2 symptom outcomes (pain, fatigue) and 1 psychosocial outcome (self-efficacy for managing arthritis) in the ITT analyses; 1 symptom outcome (pain), 1 function outcome (chair stands), and 1 psychosocial outcome (self-efficacy for arthritis management) in the AT analyses. In addition, completers who attended >9 classes had improvements in 3 symptom outcomes (pain, fatigue, stiffness), 2 function outcomes (10-pound lifts, chair stands), and 1 psychosocial outcome (self-efficacy for arthritis management) at 8 weeks. Relative to baseline, PACE participants maintained significant improvements in symptoms at 6 months, but declined in function and self-efficacy for exercise. Conclusion. If adults with arthritis attend a majority of PACE classes, they may expect improvements in symptoms, self-efficacy for arthritis management, and upper and lower extremity function. Achieving sustained improvement in outcomes may require continued participation in PACE.
INTRODUCTION Arthritis, one of the most prevalent chronic conditions in the US and the country’s leading cause of disability, is ClinicalTrials.gov identifier: NTC00146393. Supported by the Centers for Disease Control and Prevention through a grant from the Association of American Medical Colleges (MM-0275-03/03). 1 Leigh F. Callahan, PhD, Thelma Mielenz, PT, PhD, OCS, Janet Freburger, PT, PhD, Jack Shreffler, PhD, Katherine Buysse, BS, Todd Schwartz, DrPH: University of North Carolina at Chapel Hill; 2Jennifer Hootman, PhD, Teresa Brady, PhD: Centers for Disease Control and Prevention, Atlanta, Georgia. Address correspondence to Leigh F. Callahan, PhD, The University of North Carolina at Chapel Hill, Thurston Arthritis Research Center, 3300 Thurston Building, CB#7280, Chapel Hill, NC 27599-7280. E-mail: leigh_callahan@med. unc.edu. Submitted for publication January 10, 2007; accepted in revised form June 4, 2007.
92
characterized by pain, decreased joint mobility, and weakness, which likely contribute to mortality and morbidity from other chronic diseases such as diabetes (1– 4). Although persons with arthritis tend to be less fit than their peers without this condition, studies have demonstrated that persons with arthritis can safely participate in appropriate exercise programs to improve their cardiovascular fitness, muscular strength, psychosocial status, and functional status (1,2,5–15). The surgeon general’s report on physical activity and health indicated that exercise programs of moderate intensity are effective in individuals with rheumatoid arthritis (RA) or osteoarthritis (OA) (16,17). On the basis of this report and other research findings, clinicians and public health practitioners have been recommending participation in exercise programs for people with arthritis (18). The People with Arthritis Can Exercise (PACE) program is a land-based program developed by the Arthritis Foundation in 1987 (revised in 1999) to promote the self-man-
RCT of People With Arthritis Can Exercise agement of arthritis through exercise. This 8-week program, administered twice weekly for 1 hour, is offered at basic and advanced levels and is available for widespread use in community-based settings. Evaluations of the effectiveness of PACE have been limited to small pilot studies (19 –21). In these smaller studies, improvements were shown in symptoms, strength, function, and psychosocial behaviors. Given the need for solid evidence-based data to support widespread dissemination, this study was undertaken to evaluate the effectiveness of the basic PACE program (1999 version) in changing arthritis-related health outcomes among community-dwelling adults with self-reported arthritis. The primary objectives of this study were 1) to conduct a randomized controlled trial (RCT) to evaluate the short-term effects (at 8 weeks) of PACE on the primary outcomes of symptoms, function, and physical activity and a set of secondary (psychosocial) outcomes, and 2) to assess the longer-term effects (at 3 and 6 months) of PACE on outcomes in the intervention group. Our secondary objectives were 1) to assess the effects of completer status (defined as attending ⱖ9 of the 16 classes) on outcomes, 2) to evaluate the long-term effects (at 3 and 6 months) of PACE on outcomes for continuers (participants who reported continuing PACE exercises at home), and 3) to track any adverse events from the program.
PARTICIPANTS AND METHODS This RCT was conducted at multiple community locations with an intervention group and a control group that received the intervention on a delayed basis. All participants completed self-report and performance-based assessments at baseline and 8 weeks later. After the 8-week assessment, the control group was offered PACE. Participants in the intervention group also completed self-report assessments 3 and 6 months after completion of PACE. This study was approved by the University of North Carolina institutional review board. Instructors from urban and rural counties across North Carolina were recruited for the study during training sessions conducted by the North Carolina Arthritis Program. Instructors included exercise program leaders, heath education specialists, recreation leaders, nurses, and occupational and physical therapists. All instructors (n ⫽ 18) completed an online training course on protection of human subjects and were given the opportunity to become certified in cardiopulmonary resuscitation at no cost. Instructors chose their PACE class site based on affiliations in their community. Sites included senior centers, fitness or wellness centers, retirement communities, and churches. Participants were recruited by PACE instructors, through investigator community contacts (e.g., family practice offices, community centers, and health departments), and through local radio and print advertisements. The criteria for inclusion were 1) self-reported arthritis, 2) age 18 years or older, 3) currently exercising ⬍3 times a week for ⬍20 minutes per session, 4) limited in normal activities because of arthritis or joint symptoms (to address
93 the basic-level PACE 8-week program target audience), and 5) English speaking. Participants were excluded if 1) they used a wheelchair and were not able to transfer independently and 2) their mental status did not allow them to complete the questionnaires. Participants were randomly assigned to either the intervention group or the control group by varying permuted blocks (i.e., the block size is randomly varied to prevent guessing), stratified by class site. Group assignments were done by concealed allocation of the 2 groups (22). Baseline assessments took place from August to November 2003 and were performed at the class sites approximately 1 week before the start of PACE. Participants provided informed consent and completed a self-report questionnaire and underwent a standardized functional assessment battery of tests by trained physical therapists (PTs). The followup assessments of the self-reported questionnaire and functional assessment battery of tests took place from October 2003 to January 2004. Demographic measures included age, race/ethnicity, marital status, educational level, sex, height, weight, work status, and use of current medications. Chronic conditions were assessed using a modification of the American Academy of Orthopedic Surgeons Musculoskeletal Outcomes Data Evaluation and Management System list of comorbidities (23). An unweighted count of nonmusculoskeletal conditions was used as the comorbidity score (possible range 0 –11). Before the baseline assessments, the instructors received a copy of the sample outline for the basic-level 8-week program and a list of recommendations from the research team (e.g., a request that no floor exercise be conducted because we were evaluating the basic program). Safety guidelines advised instructors to refer questions on health to participants’ health care providers and provided a protocol for handling emergencies. Instructors monitored intervention group attendance and reported to the research team weekly. Participants in the intervention group were mailed surveys 3 and 6 months after the conclusion of PACE to assess the long-term effect of the course. Specific questions about level of physical activity and continued enrollment or interest in continuing with PACE were added to the 3- and 6-month surveys. Primary outcome measures. Pain, stiffness, and fatigue (symptoms of arthritis) were measured using visual analog scales (VAS) (24,25). For example, the amount of pain experienced over the past week was assessed using a 100-mm VAS anchored with “no pain” and “pain as bad as it could be” (24,25). A similar method was used to assess stiffness and fatigue. Physical function was assessed with both self-report and performance-based measures. Self-reported function was assessed using the disability scale of the Health Assessment Questionnaire (HAQ) (26), which includes questions about 20 activities of daily living in 8 domains (dressing, arising, eating, walking, hygiene, activities, reach, and grip); scores are adjusted based on the use of assistive devices. Each item is scored from 0 (no disability) to 3
94
Callahan et al
(maximum disability). The average score from the 20 items was used with a higher score representing worse function. Performance-based physical function was assessed at baseline and at 8 weeks by PTs. All PT assessors were trained on a standardized assessment protocol. First, a medical history was taken to identify participants with conditions that would exclude them from some performance testing (e.g., uncontrolled hypertension, recent surgeries). Participants completed 5 performance-based tests of physical function, all of which have established reliability (27–29). Timed 10-pound lifts assess upper extremity strength (29), and timed chair stands assess lower extremity strength (28). A third test, the timed 360-degree turn, assesses standing balance and turning ability (28). Measuring the speed of gait (a fourth test) assesses functional mobility (27), and the 6-minute walk, a submaximal test of aerobic capacity, measures aerobic endurance (27). Physical activity was assessed for type of activity, frequency, and duration over the past 7 days using the Physical Activity Scale for the Elderly (PASE) (30). A score (range 0 –⬎400) is computed using a formula in which time spent in each activity is multiplied by a weighted value to reflect the amount of energy expended in completing that activity. Higher scores reflect higher levels of physical activity (30). Secondary outcome measures. Four psychosocial outcomes were assessed. The Rheumatoid Arthritis Self-Efficacy (RASE) 28-item scale measures respondents’ self-efficacy for arthritis self-management behaviors (31). The total score (range 28 –140) is computed by summing 28 Likert-format item responses (range 1–5 to express strength of agreement). Higher scores reflect higher selfefficacy (31,32). The 5-item Self-Efficacy for Physical Activity (SEPA) scale assesses respondents’ confidence in their ability to be physically active despite barriers (33). A summary score (range 1–5) is calculated by averaging the 5 items. Higher scores reflect higher levels of self-efficacy (33,34). The 11-item Center for Epidemiologic Studies Depression Scale measures symptoms associated with depression in the general population (35). Each symptom is scored from 0 to 3 to reflect the frequency of occurrence within the past 7 days. The 11 items are summed, with higher scores indicating a greater frequency of depressive symptoms (range 0 –33). The 5-item Helplessness Subscale of the Rheumatology Attitudes Index was used to measure perceived helplessness (36). The items are scored from 1 to 5 (least to greatest amount of helplessness) and the average is used for analysis. Statistical analyses. All statistical analyses were conducted using STATA (37). An initial quality check of all data was conducted in 2 steps: 1) data were checked for allowable ranges, legibility, and errors, and 2) univariate analyses of all variables were performed, with particular attention paid to missing data, sparse numbers, or extreme values. In the final analyses, we did not perform any imputation or transformations, although some tests were con-
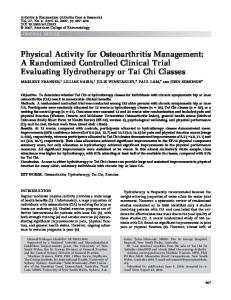
Figure 1. Participant flow chart. PACE ⫽ People With Arthritis Can Exercise.
ducted by imputing missing PASE values, as described below. Both intent-to-treat (ITT) and as-treated (AT) analyses were performed (Figure 1). Following accepted procedures, for the ITT analyses all participants were analyzed as they were randomized regardless of whether they actually participated in their prescribed treatment arm. Some eligible participants (n ⫽ 25) were not randomized because they would not have transportation to attend classes if they were not assigned to the same group as another person (spouse, relative, friend, etc.), they had scheduled vacations, or they had surgeries that precluded their assignment to certain class times. In addition, for various reasons (e.g., difficulty arranging transportation, simply deciding to attend or not attend classes) some participants randomized to PACE actually received the control protocol (n ⫽ 13), and vice versa (n ⫽ 13). Therefore, participants who attended at least 1 class were included in the AT analysis as receiving PACE, regardless of whether they were randomized and regardless of their assignment (intervention, control). To promote
RCT of People With Arthritis Can Exercise community-based participation, participants who were not randomized were still allowed to participate. The characteristics of participants at baseline for the ITT and AT analyses were compared for the intervention group and control group using t-tests and Pearson’s chi-square test. For primary and secondary outcomes, mean differences in outcomes at the 8-week followup were compared between the intervention and control groups adjusting for baseline differences as noted below. In the intervention group, mean adjusted outcome measures at 3 and 6 months were compared with baseline. Analysis of subgroups by completer status (attended ⱖ9 classes) was performed for the AT analyses. Outcomes represented 4 major categories: symptoms (pain, fatigue, stiffness), function (HAQ and 5 physical performance tests), physical activity level (PASE), and psychosocial characteristics (self-efficacy, depression, helplessness). Analyses of covariance 2-level multiple linear regression models (site was the second level) were used to calculate adjusted means for the 8-week outcomes for the intervention and control groups in both the ITT and AT analyses. Covariates in the full models assessing the symptoms, function, and physical activity outcomes included sex, age, race, education, comorbid conditions, self-efficacy (per both RASE and SEPA), depression, helplessness, and the baseline outcome measure. Covariates in the full models assessing the psychosocial outcomes included sex, age, race, education, comorbid conditions, symptoms, function, and physical activity level. Standard scoring of the PASE only allows estimation of missing values from the remaining data for the number of hours per day related to the intensity of activities (Smith K: personal communication). With the baseline PASE score missing for 17% of the participants, we imputed the scores by best-subset regression for the models containing PASE as an independent variable (37). Because the results using the larger imputed sample did not differ from those using the original sample, we used the nonimputed PASE in the final models. Adjusted mean outcomes in the evaluations at 3 and 6 months were calculated using a 3-level mixed-effects regression model that included a random intercept for site (level 3), individual participant (level 2), and repeated measures of outcome (level 1), with adjustment for covariates as outlined previously. The models included effects for 8 weeks and for 3 and 6 months using the baseline value as reference. Similar subgroup analyses were conducted for continuers, i.e., those participants who reported they were continuing the PACE exercises at home (n ⫽ 70).
RESULTS Of the 428 individuals screened for enrollment, 347 were eligible and enrolled in the study (Figure 1). Of those 81 screened who were not enrolled, 38% were too active. One participant was excluded because of declining mental status during the course of the study. In the ITT analysis of only randomized participants, 166 participants were randomized to intervention and 155 to control. In the AT analysis, a total of 175 participants received the intervention and 171 received the control protocol.
95 Overall, the participants had a mean age of 70 years (range 32–94 years), 90% were female, 75% were white, and 60% had more than a high school degree (Table 1). Baseline differences between the intervention and control groups are depicted in Table 1 for both the ITT analysis and AT analysis. There were no meaningful random differences between the ITT intervention and control groups. Compared with controls, the AT intervention group had significantly more nonmusculoskeletal comorbid conditions (P ⫽ 0.007) and less aerobic endurance (shorter distance in the 6-minute walk; P ⫽ 0.03). In the ITT analyses, the main types of self-reported arthritis for the treatment and control groups included RA (25% and 25%, respectively), fibromyalgia (10% and 8%, respectively), and OA (43% and 40%, respectively). The major comorbidities for the treatment and control groups were heart disease (20% and 21%, respectively), hypertension (55% and 52%, respectively), stroke (9% and 8%, respectively), and diabetes (18% and 13%, respectively). Information was collected on current medication: 51% and 36% of patients in the treatment and control groups, respectively, took nonsteroidal antiinflammatory drugs (NSAIDs) for OA; 42% and 50%, respectively, took NSAIDs for RA; and 43% and 49%, respectively, took disease-modifying antirheumatic drugs for RA. None of these comparisons were statistically different (data not shown). In the ITT analyses (Table 2), the intervention group had significant improvements in pain, fatigue, and self-efficacy for managing arthritis at 8 weeks. On the VAS, the intervention group’s mean score was 6.8 mm better for pain and 8.3 mm better for fatigue relative to the control group. In addition, on 1 psychosocial outcome (self-efficacy for managing arthritis), the intervention group had a score that was 5.1 points higher than the control group (Table 2). Numerical values for 1 symptom (stiffness), measured function (upper and lower strength and balance measures), level of physical activity, and 1 psychosocial outcome (exercise self-efficacy) also indicated improvement in the intervention group, but these findings were not significant. In the AT analyses, the intervention group had significant improvements in 1 symptom (pain [8.2 mm better than control group]), 1 function (lower extremity strength [chair stands 1.0 second faster than control group]), and 1 psychosocial outcome (arthritis self-efficacy [6.8 points better on the RASE than control group]) (Table 3). Numerical values for other symptoms (fatigue, stiffness), all measured functions, level of physical activity, and 2 other psychosocial outcomes (exercise self-efficacy and helplessness) indicated improvement in the intervention group, but these findings were not significant. The mean ⫾ SD number of classes attended by participants who attended at least 1 PACE class (n ⫽ 175) (Figure 1) was 9.4 ⫾ 4.5. A total of 114 (65.1%) participants completed ⱖ9 of the 16 classes offered during the 8-week session and thus were defined as completers. For these participants (Table 4), the AT analyses at 8 weeks indicated significant improvements in the intervention group in symptoms (shown by differences on a VAS) for pain (7.6 mm better than controls), fatigue (9.2 mm better than controls), and stiffness (6.1 mm better than controls); function
96
Callahan et al
Table 1. Baseline characteristics of the intervention and control groups by type of analysis* Intent-to-treat Characteristics Demographics Age in years Female sex, % White race, % More than high school education, % Number of comorbid conditions Symptoms, mm on VAS Pain Fatigue Stiffness Self-reported function HAQ Measured function Upper extremity strength: three 10-pound lifts (seconds) Lower extremity strength: 3 chair stands (seconds) Standing balance and turning ability 360° turn right (seconds) 360° turn left (seconds) Functional mobility Normal walking speed, meters/second Fast walking speed, meters/second Aerobic endurance 6-minute walk, feet Level of physical activity PASE Psychosocial Arthritis self-efficacy: RASE Exercise self-efficacy: SEPA Depressive symptoms: CES-D Perceived helplessness: RAI
As treated
Intervention (n ⴝ 166)
Control (n ⴝ 155)
Intervention (n ⴝ 175)
Control (n ⴝ 171)
69.7 ⫾ 0.98 85.6 72.0 59.5 1.61 ⫾ 0.10
69.9 ⫾ 0.94 89.9 76.0 60.0 1.50 ⫾ 0.10
70.5 ⫾ 0.92 86.4 73.6 60.7 1.76 ⫾ 0.11†
68.6 ⫾ 0.92 89.0 75.7 62.4 1.39 ⫾ 0.09
50.2 ⫾ 2.09 48.9 ⫾ 2.48 45.7 ⫾ 2.15
47.6 ⫾ 2.16 46.4 ⫾ 2.70 43.9 ⫾ 2.11
50.1 ⫾ 2.02 48.5 ⫾ 2.41 45.5 ⫾ 2.15
48.1 ⫾ 2.05 45.9 ⫾ 2.52 45.5 ⫾ 2.01
1.03 ⫾ 0.05
1.03 ⫾ 0.05
1.02 ⫾ 0.05
1.05 ⫾ 0.05
7.86 ⫾ 0.24
8.24 ⫾ 0.31
7.87 ⫾ 0.23
8.04 ⫾ 0.29
12.4 ⫾ 0.52
11.6 ⫾ 0.41
12.3 ⫾ 0.49
11.7 ⫾ 0.41
4.75 ⫾ 0.24 4.68 ⫾ 0.22
4.33 ⫾ 0.18 4.21 ⫾ 0.17
4.46 ⫾ 0.17 4.45 ⫾ 0.17
4.51 ⫾ 0.23 4.34 ⫾ 0.21
0.97 ⫾ 0.02 1.28 ⫾ 0.03
1.01 ⫾ 0.02 1.34 ⫾ 0.03
0.98 ⫾ 0.02 1.29 ⫾ 0.03
1.02 ⫾ 0.02 1.36 ⫾ 0.03
1,153 ⫾ 33
1,227 ⫾ 40
1,151 ⫾ 32‡
1,254 ⫾ 37
90.9 ⫾ 5.36
87.6 ⫾ 5.53
90.0 ⫾ 4.98
90.1 ⫾ 5.59
105.5 ⫾ 0.95 2.64 ⫾ 0.07 7.27 ⫾ 0.44 2.45 ⫾ 0.07
104.5 ⫾ 1.05 2.68 ⫾ 0.08 6.72 ⫾ 0.41 2.38 ⫾ 0.08
105.6 ⫾ 0.94 2.66 ⫾ 0.07 7.24 ⫾ 0.42 2.44 ⫾ 0.07
104.5 ⫾ 1.02 2.68 ⫾ 0.07 6.81 ⫾ 0.40 2.38 ⫾ 0.08
* Values are the mean ⫾ SE unless otherwise indicated. VAS ⫽ visual analog scale; HAQ ⫽ Health Assessment Questionnaire; PASE ⫽ Physical Activity Scale for the Elderly; RASE ⫽ Rheumatoid Arthritis Self-Efficacy Scale; SEPA ⫽ Self-Efficacy for Physical Activity Scale; CES-D ⫽ Center for Epidemiologic Studies Depression Scale; RAI ⫽ Rheumatology Attitudes Index. Higher scores for functional mobility, aerobic endurance, PASE, RASE, and SEPA reflect better health. Lower scores for symptoms, self-reported function (HAQ), measured function, depressive symptoms, and perceived helplessness (5-item subscale of the RAI) reflect better health. † P ⬍ 0.01 for the difference between intervention and control groups. ‡ P ⬍ 0.05 for the difference between intervention and control groups.
(upper extremity strength: 0.7 seconds faster on timed 10-pound lifts, lower extremity strength: 1.1 seconds faster on chair stands); and 1 psychosocial outcome (self-efficacy for arthritis management: 6.6 points higher on the RASE). Numerical values for the other performance-based measures of function, level of physical activity, exercise selfefficacy, and perceived helplessness also indicated improvement in the intervention group, but these findings were not significant. The adjusted means for symptoms, function, physical activity, and psychosocial outcomes for repeated measures from baseline to 6 months for those participants who attended any PACE classes are presented in Table 5. The response rates for the 3- and 6-month surveys were 74.3% (n ⫽ 130) and 72.6% (n ⫽ 127), respectively. In this analysis, statistical significance refers to a difference from the baseline value. At 6 months, participants had maintained significant decreases in 2 symptoms (pain: 7.8 mm, fatigue:
7.4 mm). In contrast, both function (0.09 points higher on the HAQ) and self-efficacy for exercise (a decline of 0.24 points on the SEPA) became worse (Table 5). A subanalysis on the continuers (participants who at 6 months said they were continuing to do the PACE exercises at home) showed results similar to those seen for the entire intervention group except that self-reported function did not deteriorate significantly and the third symptom (stiffness) maintained improvement from baseline (Table 5).
DISCUSSION The short-term effects of the basic PACE program were improvements in pain and fatigue as well as in self-efficacy for managing arthritis, but we found no significant effects on function or activity. In a separate analysis (AT) for participants completing the majority of the program,
RCT of People With Arthritis Can Exercise
97
Table 2. Comparison of the intervention and control groups at 8 weeks (intent-to-treat analyses)* Outcomes at 8 weeks Symptoms, mm on VAS† Pain (n ⫽ 239) Fatigue (n ⫽ 236) Stiffness (n ⫽ 238) Self-reported function† HAQ (n ⫽ 245) Measured function† Upper extremity strength: three 10-pound lifts (seconds) (n ⫽ 186) Lower extremity strength: 3 chair stands (seconds) (n ⫽ 199) Standing balance and turning ability 360° turn right (seconds) (n ⫽ 205) 360° turn left (seconds) (n ⫽ 205) Functional mobility† Normal walking speed (meters/ second) (n ⫽ 186) Fast walking speed (meters/second) (n ⫽ 185) Aerobic endurance† 6-minute walk (feet) (n ⫽ 196) Level of physical activity† PASE (n ⫽ 195) Psychosocial¶ Arthritis self-efficacy: RASE (n ⫽ 209) Exercise self-efficacy: SEPA (n ⫽ 209) Depressive symptoms: CES-D (n ⫽ 206) Perceived helplessness: RAI (n ⫽ 209)
Intervention Control (n ⴝ 166) (n ⴝ 155)
38.1‡ 35.4§ 37.6
44.9 43.7 40.1
1.04
1.00
7.04
7.48
10.7
11.4
3.86
4.12
3.89
4.08
1.05
1.08
1.38
1.40
1,249
1,279
86.6
85.0
108.5§
103.4
2.69
2.66
6.76
6.38
2.26
2.22
* Values are the mean. See Table 1 for definitions. Higher scores for functional mobility, aerobic endurance, PASE, RASE, and SEPA reflect better health. Lower scores for symptoms, self-reported function (HAQ), measured function, depressive symptoms, and perceived helplessness (5-item subscale of the RAI) reflect better health. † Adjusted means based on a multilevel multiple linear regression model with site as the second level and adjusted for baseline outcome, sex, age, race, education, comorbidity, self-efficacy (RASE and SEPA), depression (CES-D), and helplessness (RAI). ‡ P ⬍ 0.05 for the difference between intervention and control groups. § P ⬍ 0.01 for the difference between intervention and control groups. ¶ Adjusted means based on a multilevel multiple linear regression model with site as the second level and adjusted for a baseline outcome, sex, age, race, education, comorbidity, HAQ, PASE, and pain VAS.
short-term effects were observed in pain and fatigue, in some upper and lower extremity strength, and in selfefficacy for managing arthritis. This finding tells us that given a higher dose (⬎9 classes), gains were made in the strength of the upper and lower extremities, reflecting one of the more minor components of PACE: strength training. The longer-term effects of the program were continued
improvements in pain and fatigue at 6 months and, for those participants continuing the program independently, sustained improvement in stiffness. There were no adverse events reported during the program, and therefore it appears safe for older persons with arthritis who have been in the habit of exercising very little. Our study provides the first solid RCT evidence that the Table 3. Comparison of the intervention and control groups at 8 weeks (as-treated analyses)* Outcomes at 8 weeks Symptoms (mm on VAS)† Pain (n ⫽ 255) Fatigue (n ⫽ 253) Stiffness (n ⫽ 254) Self-reported function† HAQ (n ⫽ 263) Measured function† Upper extremity strength: three 10-pound lifts (seconds) (n ⫽ 198) Lower extremity strength: 3 chair stands (seconds) (n ⫽ 213) Standing balance and turning ability 360° turn right (seconds) (n ⫽ 219) 360° turn left (seconds) (n ⫽ 219) Functional mobility† Normal walking speed (meters/second) (n ⫽ 200) Fast walking speed (meters/ second) (n ⫽ 199) Aerobic endurance† 6-minute walk (feet) (n ⫽ 209) Physical activity level† PASE (n ⫽ 211) Psychosocial¶ Arthritis self-efficacy: RASE (n ⫽ 224) Exercise self-efficacy: SEPA (n ⫽ 224) Depressive symptoms: CES-D (n ⫽ 221) Perceived helplessness: RAI (n ⫽ 224)
Intervention Control (n ⴝ 175) (n ⴝ 171)
37.6‡ 36.0 36.1
45.8 41.7 40.8
1.02
1.01
7.01
7.40
10.5§
11.5
3.84
4.07
3.84
4.04
1.07
1.07
1.40
1.41
1,276
1,280
88.5
84.6
109.5‡
102.7
2.72
2.65
6.68
6.42
2.20
2.26
* Values are the mean. See Table 1 for definitions. Higher scores for functional mobility, aerobic endurance, PASE, and RASE reflect better health. Lower scores for symptoms, self-reported function (HAQ), measured function, depressive symptoms, and perceived helplessness (subscale of the RAI) reflect better health. † Adjusted means based on a multilevel multiple linear regression model with site as the second level and adjusted for baseline outcome, sex, age, race, education, comorbidity, self-efficacy (RASE and SEPA), depression (CES-D), and helplessness (RAI). ‡ P ⬍ 0.01 for the difference between intervention and control groups. § P ⬍ 0.05 for the difference between intervention and control groups. ¶ Adjusted means based on a multilevel multiple linear regression model with site as the second level and adjusted for baseline outcome, sex, age, race, education, comorbidity, HAQ, PASE, and pain VAS.
98
Callahan et al
Table 4. Comparison of the outcomes for completers (attended >9 classes) and controls at 8 weeks (as-treated analyses)* Outcomes at 8 weeks Symptoms (mm on VAS)† Pain (n ⫽ 221) Fatigue (n ⫽ 219) Stiffness (n ⫽ 221) Self-reported function† HAQ (n ⫽ 229) Measured function† Upper extremity strength: three 10-pound lifts (seconds) (n ⫽ 180) Lower extremity strength: 3 chair stands (seconds) (n ⫽ 194) Standing balance and turning ability 360° turn right (seconds) (n ⫽ 199) 360° turn left (seconds) (n ⫽ 199) Functional mobility† Normal walking speed (meters/ second) (n ⫽ 183) Fast walking speed (meters/ second) (n ⫽ 182) Aerobic endurance† 6-minute walk (feet) (n ⫽ 190) Physical activity level† PASE (n ⫽ 183) Psychosocial¶ Arthritis self-efficacy: RASE (n ⫽ 195) Exercise self-efficacy: SEPA (n ⫽ 195) Depressive symptoms: CES-D (n ⫽ 191) Perceived helplessness: RAI (n ⫽ 195)
Intervention Control (n ⴝ 114) (n ⴝ 171)
36.7‡ 32.0§ 34.2‡
44.3 41.2 40.3
0.98
0.99
6.76§
7.46
10.5§
11.6
3.79
4.08
3.77
4.06
1.08
1.07
1.41
1.40
1,291
1,280
85.8
83.0
109.3§
102.7
2.82
2.67
6.28
6.25
2.16
2.24
* Values are the mean. See Table 1 for definitions. Higher scores for functional mobility, aerobic endurance, PASE, RASE, and SEPA reflect better health. Lower scores for symptoms, self-reported function (HAQ), measured function, depressive symptoms, and perceived helplessness (subscale of the RAI) reflect better health. † Adjusted means based on a multilevel multiple linear regression model with site as the second level and adjusted for baseline outcome, sex, age, race, education, comorbidity, self-efficacy (RASE and SEPA), depression (CES-D), and helplessness (RAI). ‡ P ⬍ 0.05 for the difference between intervention and control groups. § P ⬍ 0.01 for the difference between intervention and control groups. ¶ Adjusted means based on a multilevel multiple linear regression model with site as the second level and adjusted for baseline outcome, sex, age, race, education, comorbidity, HAQ, PASE, and pain VAS.
basic 8-week PACE program has at least modest benefits. Before our study, the only published research article was a small (n ⫽ 30) pilot study assessing the effectiveness of the Arthritis Foundation’s Aquatic and PACE programs by using a control group for comparison (19). Suomi and Collier reported that PACE significantly decreased pain
during activities of daily living and increased several functional measures, including flexibility, eye– hand coordination, hip and shoulder strength, and balance (19). Our results for the completers of PACE in the AT analyses showed similar improvements, as we found a decrease in pain and increases in upper and lower extremity function. In our study, additional improvements for completers were decreases in fatigue and stiffness and an increase in self-efficacy for managing arthritis. Statistically significant differences were reported for certain symptoms and self-efficacy for managing arthritis in our ITT analyses, but fatigue and arthritis self-efficacy were possibly the only meaningful changes. Meaningful change for the 100-mm pain VAS was reported as 17–18 mm, which is substantially more than the range we found in the literature (6.8 – 8.2) (38). In patients with RA, a meaningful change of 6.7–17.0 on the 100-mm fatigue VAS has been reported, and we found changes of 7.4 –9.2 (39). We found changes of 5.1– 6.8 on the RASE, and a 5-point increase is reported as meaningful (31). Among completers, we did not find meaningful changes in exercise endurance as measured by the 6-minute walk test, in function as measured by the HAQ, or in overall physical activity. A limitation of this study is that we only evaluated the basic PACE program, which focuses primarily on range-of-motion and low-resistance exercises, so it is not surprising that endurance and overall physical activity did not improve. Although one might expect improvement in symptoms to lead to decreased disability, our participants’ improvements in symptoms may not have been great enough to cause changes in their HAQ scores. The HAQ may not have been the best instrument to measure change for an 8-week followup period (40,41). In addition, our measure of physical activity, the PASE, may not have been sensitive enough to capture changes in overall activity in this group of older adults. The PASE has been shown to have adequate reliability and validity, but data are insufficient on the instrument’s responsiveness to change over time (42). Nonprobability sampling causes participant bias toward self-selection, but this population is representative of participants in these types of programs. Another limitation is that almost one-third of the participants did not complete at least half of the PACE classes. In a qualitative evaluation of the PACE program, noncompleters of the program reported arthritis-related illness or insufficient physical challenge as a key barrier to class participation, whereas completers reported personal or family illness as the primary barrier (43). Six months after participants completed PACE, pain and fatigue were still significantly better than at baseline, but disability measured by the HAQ and self-efficacy for physical activity were worse. The subset of participants who reported continuing the PACE exercises at home maintained improvement, compared with baseline, in all symptoms (pain, fatigue, and stiffness) and declined only in self-efficacy for physical activity, suggesting that continued participation in exercise imparts additional benefits. Why participants had a decline in self-efficacy for exercise from baseline to 6 months is not clear, but it may be related to the fact that participants understood the benefits of
RCT of People With Arthritis Can Exercise
99
Table 5. Outcomes for intervention group at 3 and 6 months after attending the People With Arthritis Can Exercise (PACE) program (as-treated analysis)* Outcomes Intervention group (n ⫽ 152) Symptoms (mm on VAS)† Pain (n ⫽ 114) Fatigue (n ⫽ 116) Stiffness (n ⫽ 117) Self-reported function† HAQ (n ⫽ 123) Physical activity level† PASE (n ⫽ 94) Psychosocial¶ Arthritis self-efficacy: RASE (n ⫽ 104) Exercise self-efficacy: SEPA (n ⫽ 103) Depressive symptoms: CES-D (n ⫽ 100) Perceived helplessness: RAI (n ⫽ 104) Subanalyses of intervention group participants who continued PACE exercises at home (n ⫽ 67) Symptoms (mm on VAS)† Pain (n⫽53) Fatigue (n⫽54) Stiffness (n⫽56) Self-reported function† HAQ (n ⫽ 59) Physical activity level† PASE (n ⫽ 51) Psychosocial¶ Arthritis self-efficacy: RASE (n ⫽ 54) Exercise self-efficacy: SEPA (n ⫽ 53) Depressive symptoms: CES-D (n ⫽ 53) Perceived helplessness: RAI (n ⫽ 52)
0 week
8 weeks
3 months
6 months
49.3 46.2 42.1
37.7‡ 33.3‡ 34.1‡
41.4‡ 37.9‡ 37.5
41.5‡ 38.8‡ 37.4
1.00
1.09
1.02
1.11§
91.5
88.5
73.5‡
82.9
107.8 2.67 6.65 2.34
109.6 2.73 6.47 2.22
106.1 2.58 6.34 2.32
105.2 2.43§ 6.73 2.21
49.9 43.0 43.0
38.0‡ 29.5‡ 33.8‡
36.8‡ 31.5‡ 35.3§
37.3‡ 33.0‡ 36.0§
0.92
0.98
1.04
0.96 99.4
90.0
84.4§
85.6
108.1 2.87 5.94 2.30
110.3 2.89 5.35 2.18
105.8 2.86 5.33 2.18
105.3 2.59§ 5.80 2.19
* Values are the mean. n ⫽ individuals measured at both baseline and 8 weeks and at least at 3 or 6 months; see Table 1 for additional definitions. Higher scores for functional mobility, aerobic endurance, PASE, RASE, and SEPA reflect better health. Lower scores for symptoms, self-reported function (HAQ), measured function, depressive symptoms, and perceived helplessness (subscale of the RAI) reflect better health. † Adjusted means based on a repeated-measures mixed-effects linear regression model with a random intercept by site and adjusted for baseline outcome, sex, age, race, education, comorbidity, self-efficacy (RASE and SEPA), depression (CES-D), and helplessness (RAI). ‡ P ⬍ 0.01 for the difference from baseline adjusted mean. § P ⬍ 0.05 for the difference from baseline adjusted mean. ¶ Adjusted means based on a repeated-measures mixed-effects linear regression model with a random intercept by site and adjusted for baseline outcome, sex, age, race, education, comorbidity, HAQ, PASE, and pain VAS.
exercise and felt less confident without the class structure, frequency, and social support. Our findings indicate that the basic 8-week PACE program is a safe program for sedentary older individuals with arthritis to start exercising without exacerbating their symptoms. In fact, we actually found that symptoms improved in these persons. Studies need to be conducted to determine whether offering the program more than 2 times per week and for longer periods leads to any additional benefits. As with any exercise program, it appears that individuals need to stay with the program to maintain their benefits over time. In summary, our study of more than 300 communitybased adults from urban and rural areas in North Carolina reinforced findings from pilot studies that PACE, offered 2 times per week, modestly improves symptoms and strength but does not improve function, increase exercise endurance, or increase physical activity. The program was well received by the participants and instructors in a variety of communities. For more substantial benefits, frequency and intensity may need to be increased.
ACKNOWLEDGMENTS The authors thank the instructors, Julie Brockman, Aaron Brown, Shelley Carraway, Sharon Gale, Kelly Gordon, Cristi Greer, Lisa Harper, Dana Kimberly, Tres Magner, Mary McKeithn, Ellen Propst, Brenda Rumfelt, Patricia Schmidt, Joanne Stallings, Janice Stolzenberg, Larry Stolzenberg, Judy Vernon, and Carolyn Wlliams, for compassionately teaching the PACE classes. We thank the PACE sites for allowing us to hold the classes at their facilities. We thank Britta Schoster and Matthew Morrison for their help in the assessments. We thank all of the physical therapists: Kathryn Kubiak, Jeremiah Tate, Barbara Helms, Kathy Parker, Yvonne Golightly, Judy Foxworth, Tiffany Shubert, Lori Schrodt, Sangini Rane, Karen Lunnen, Ruffin Ayers, Linda Eargle, Wendy Reynolds, Bridget Dunford, Joanne Stallings, Lynn Forbes, Robert Mitchner, Wendy Gehm, Blake Brookshire, Jan Lindsey, Jana Van Rooyen, and Angela Blair. Thanks to Roger Akers, Robert Schwartz, and Carol Porter from the Sheps Center for Health Services Research for excellent data management. We thank Ellen
100
Callahan et al
Condelli and Kathleen Ferrell, Vicki Nakagawa, David Moore, the North Carolina Arthritis Program, the Wake County Human Services Public Health Center, and the Carolinas Chapter of the Arthritis Foundation for consultation and support. We express our sincere thanks to the PACE participants, without whom this study would not have been possible.
15. 16. 17.
AUTHOR CONTRIBUTIONS Dr. Callahan had full access to all of the data in the study and takes responsibility for the integrity of the data and the accuracy of the data analysis. Study design. Callahan, Mielenz, Freburger, Hootman, Brady. Acquisition of data. Callahan, Mielenz, Freburger, Buysse. Analysis and interpretation of data. Callahan, Mielenz, Freburger, Hootman, Brady, Buysse, Schwartz. Manuscript preparation. Callahan, Mielenz, Freburger, Shreffler, Hootman, Brady, Buysse, Schwartz. Statistical analysis. Callahan, Mielenz, Shreffler, Schwartz.
18.
19.
20. 21.
REFERENCES 1. Brady TJ, Kruger JM, Helmick CG, Callahan LF, Boutaugh ML. Intervention programs for arthritis and other rheumatic diseases. Health Educ Behav 2003;30:44 – 63. 2. Fontaine KR, Heo M. Changes in the prevalence of US adults with arthritis who meet physical activity recommendations, 2001-2003. J Clin Rheumatol 2005;11:13– 6. 3. Centers for Disease Control and Prevention. Prevalence and impact of chronic joint symptoms: seven states, 1996. MMWR 1998;47:345–51. 4. Lawrence RC, Helmick CG, Arnett FC, Deyo RA, Felson DT, Giannini EH, et al. Estimates of the prevalence of arthritis and selected musculoskeletal disorders in the United States. Arthritis Rheum 1998;41:778 –99. 5. Minor MA, Lane NE. Recreational exercise in arthritis. Rheum Dis Clin North Am 1996;22:563–77. 6. Zimmer Z, Hickey T, Searle MS. Activity participation and well-being among older people with arthritis. Gerontologist 1995;35:463–71. 7. Westby MD. A health professional’s guide to exercise prescription for people with arthritis: a review of aerobic fitness activities. Arthritis Rheum 2001;45:501–11. 8. Allegrante JP, Kovar PA, MacKenzie CR, Peterson MG, Gutin B. A walking education program for patients with osteoarthritis of the knee: theory and intervention strategies. Health Educ Q 1993;20:63– 81. 9. Ettinger WH, Burns R, Messier SP, Applegate W, Rejeski WJ, Morgan TM, et al. A randomized trial comparing aerobic exercise and resistance exercise with a health education program in older adults with knee osteoarthritis. JAMA 1997;277: 25–31. 10. Kovar PA, Allegrante JP, MacKenzie CR, Peterson MG, Gutin B, Charlson ME. Supervised fitness walking in patients with osteoarthritis of the knee: a randomized, controlled trial. Ann Intern Med 1992;116:529 –34. 11. Messier SP, Royer TD, Craven TE, O’Toole ML, Burns R, Ettinger WH. Long-term exercise and its effect on balance in older, osteoarthritic adults: results from the Fitness, Arthritis, and Seniors Trial (FAST). J Am Geriatr Soc 2000;48:131– 8. 12. Rejeski WJ, Ettinger WH Jr, Martin K, Morgan T. Treating disability in knee osteoarthritis with exercise therapy: a central role for self-efficacy and pain. Arthritis Care Res 1998;11: 94 –101. 13. Yocum DE, Castro WL, Cornett M. Exercise, education, and behavioral modification as alternative therapy for pain and stress in rheumatic disease. Rheum Dis Clin North Am 2000; 26:145–59. 14. Elkblom B, Lovgren O, Alderin M, Friedstrom M, Satterstrom
22. 23.
24.
25.
26. 27.
28.
29.
30. 31.
32.
G. Effects of short-term physical training on patients with rheumatoid arthritis. Scand J Rheumatol 1975;4:87–91. Harkcom TM, Lampman RM, Banwell BF, Castor CW. Therapeutic value of graded aerobic exercise training in rheumatoid arthritis. Arthritis Rheum 1985;28:32–9. US Department of Health and Human Services. Physical activity and health: a report of the surgeon general. Atlanta: CDC; 1999. Brady TJ, Sniezek JE. Implementing the National Arthritis Action Plan: new population-based approaches to increasing physical activity among people with arthritis. Arthritis Rheum 2003;49:471– 6. Minor MA. 2002 Exercise and Physical Activity Conference, St. Louis, Missouri: exercise and arthritis “we know a little bit about a lot of things. . .” [editorial]. Arthritis Rheum 2003;49: 1–2. Suomi R, Collier D. Effects of arthritis exercise programs on functional fitness and perceived activities of daily living measures in older adults with arthritis. Arch Phys Med Rehabil 2003;84:1589 –94. Doyle MA, Farrar V, Ryan S, Sisola S. An evaluation of People With Arthritis Can Exercise (PACE) [abstract]. Arthritis Care Res 1990;3:S7. Kennedy C, Walker K, Linnel S, Johnson R, Sockler J. Effect of exercise on social activity and health status in women with RA. Res Q Exerc Sport 1992;63 Suppl:A–91. Friedman LM, Furberg CD, DeMets DL. Fundamentals of clinical trials. 3rd ed. New York: Springer-Verlag; 2006. Tashjian RZ, Henn RF, Kang L, Green A. The effect of comorbidity on self-assessed function in patients with a chronic rotator cuff tear. J Bone Joint Surg Am 2004;86: 355– 62. Lorig K, Stewart A, Ritter P, Gonzalez V, Laurent D, Lynch J. Outcome measures for health education and other health care interventions. Thousand Oaks (CA): Sage Publications; 1996. Stewart AL, Hays RD, Ware JE. Health perceptions, energy/ fatigue, and health distress measures. In: Stewart AL, Ware JE, editors. Measuring functioning and well-being: the Medical Outcomes Study approach. Durham (NC): Duke University; 1992. Fries JF, Spitz P, Kraines RG, Holman HR. Measurement of patient outcome in arthritis. Arthritis Rheum 1980;23:137– 45. Steffen TM, Hacker TA, Mollinger L. Age- and gender-related test performance in community-dwelling elderly people: SixMinute Walk Test, Berg Balance Scale, Timed Up & Go Test, and gait speeds. Phys Ther 2002;82:128 –37. Gill TM, Williams CS, Mendes de Leon CF, Tinetti ME. The role of change in physical performance in determining risk for dependence in activities of daily living among nondisabled community-living elderly persons. J Clin Epidemiol 1997;50: 765–72. Jette AM, Jette DU, Ng J, Plotkin DJ, Bach MA, and the Musculoskeletal Impairment (MSI) Study Group. Are performance-based measures sufficiently reliable for use in multicenter trials? J Gerontol A Biol Sci Med Sci 1999;54: M3– 6. Washburn RA, Smith KW, Jette AM, Janney CA. The Physical Activity Scale for the Elderly (PASE): development and evaluation. J Clin Epidemiol 1993;46:153– 62. Hewlett S, Cockshott Z, Kirwan J, Barrett J, Stamp J, Haslock I. Development and validation of a self-efficacy scale for use in British patients with rheumatoid arthritis (RASE). Rheumatology (Oxford) 2001;40:1221–30. Brady TJ. Measures of self-efficacy, helplessness, mastery, and control: the Arthritis Helplessness Index (AHI)/Rheumatology Attitudes Index (RAI), Arthritis Self-Efficacy Scale (ASES), Children’s Arthritis Self-Efficacy Scale (CASE), Generalized Self-Efficacy Scale (GSES), Mastery Scale, Multi-Dimensional Health Locus of Control Scale (MHLC), Parent’s Arthritis Self-Efficacy Scale (PASE), Rheumatoid Arthritis Self-Efficacy Scale (RASE), and Self-Efficacy Scale (SES). Arthritis Rheum 2003;49 Suppl 5:S147– 64.
RCT of People With Arthritis Can Exercise 33. Marcus BH, Selby VC, Niaura RS, Rossi JS. Self-efficacy and the stages of exercise behavior change. Res Q Exerc Sport 1992;63:60 – 6. 34. Marcus BH, Owen N. Motivational readiness, self-efficacy and decision-making for exercise. J Appl Soc Psychol 1992;22:3– 16. 35. Carpenter JS, Andrykowski MA, Wilson J, Hall LA, Rayens MK, Sachs B, et al. Psychometrics for two short forms of the Center for Epidemiologic Studies-Depression Scale. Issues Ment Health Nurs 1998;19:481–94. 36. DeVellis RF, Callahan LF. A brief measure of helplessness in rheumatic disease: the helplessness subscale of the Rheumatology Attitudes Index. J Rheumatol 1993;20:866 –9. 37. Stata statistical software: version 9.0. College Station (TX): Stata Corporation; 2005. 38. Hagg O, Fritzell P, Nordwall A. The clinical importance of changes in outcome scores after treatment for chronic low back pain. Eur Spine J 2003;12:12–20.
101 39. Wells G, Li T, Maxwell L, MacLean R, Tugwell P. Determining the minimal clinically important differences in activity, fatigue, and sleep quality in patients with rheumatoid arthritis. J Rheumatol 2007;34:280 –9. 40. Wolfe F. A reappraisal of HAQ disability in rheumatoid arthritis. Arthritis Rheum 2000;43:2751– 61. 41. Aletaha D, Ward MM. Duration of rheumatoid arthritis influences the degree of functional improvement in clinical trials. Ann Rheum Dis 2006;65:227–33. 42. Jorstad-Stein EC, Hauer K, Becker C, Bonnefoy M, Nakash RA, Skelton DA, et al. Suitability of physical activity questionnaires for older adults in fall-prevention trials: a systematic review. J Aging Phys Act 2005;13:461– 81. 43. Schoster B, Callahan LF, Meier A, Mielenz T, DiMartino L. Participant satisfaction with the People with Arthritis Can Exercise (PACE) Program: a qualitative evaluation. Prev Chronic Dis [serial online]. 2005;2(3). URL: http://www.cdc. gov/pcd/issues/2005/jul/05_0009.htm.