World Applied Sciences Journal 4 (3): 326-331, 2008 ISSN 1818-4952 © IDOSI Publications, 2008
A New Method for Estimation of Large Synchronous Generator Parameters by Genetic Algorithm 1
2
3
Bahman Bahmani Firouzi, Ehsan Jamshidpour and Taher Niknam 1
Marvdasht Islamic Azad University, Marvdasht, Fars, Iran The Institute for Energy And Hydro Technology (IEHT), Kermanshah, Iran 3 Department of Electrical Engineering, Shiraz University of Technology, Shiraz, Iran 2
Abstract: In this paper possibility of synchronous generator dynamic parameters estimation via On -Line Field Tests using Genetic Algorithm in a 400MVA synchronous generator in BISOTUN power plant in IRAN has been presented and simulated. On-Line (RTDR) time domain data are acquired by generator disturbance simulation. The direct and quadrature-axis dynamic parameters are found by processing the step response of the synchronous machine at rotating state. Genetic algorithm approach is employed to identify the desired parameters. This test procedure increases the required power and the testing time; but presents a good and reliable precision because of the high flux level and rotating condition. Key words: Synchronous generator Parameter estimation On-line test Genetic algorithm •
•
INTRODUCTION
•
parameters of the synchronous generators in BISOTUN Thermal Power Plant. This paper consists of the following parts: In section (II) BISOTUN Power Plant synchronous generator characteristics and its applied model is introduced ; section (III) presents RTDR method, Small and large disturbances and introduces a full algorithm for on-line methods, section (IV) outlines the applied genetic algorithm; in section (V) the results of simulation of small disturbances for BISOTUN Power Plant generator is shown; the full algorithm of on-line method is simulated in section (VI) and finally estimated and simulated results is shown for comparison.
Generator modeling plays an important role in system planning, operation and post-disturbance analysis. Synchronous generator parameter estimation can be performed by two general methods: Standstill and Rotating Time Domain Response (RTDR) method. Standstill testing in the time and frequency domains has gained rapid popularity, Owing to the simplicity of its implementation even on very large machines. It is still sometimes criticized for its excessively low levels of test currents, not to mention that the rotational effects of the coupling axes, the centrifugal force effects on damper windings and the magnetic saturation effects can not be observed during standstill [1, 2]. These limitations triggered the emergence of running time-domain response (RTDR) testing, based on small [3] or large signal disturbances around the nominal operating point. The genetic algorithm approach as an estimator is a new approach and in this paper it is used for synchronous machine parameters identification from time-domain response data. The purpose of this work is to present a new approach based on genetic algorithm identification of the synchronous machine parameters from time-domain on-line small-disturbance test, obtained by abruptly changing the reference voltage or torque. For this purpose small and large disturbances are introduced and small disturbances are simulated as a suitable disturbance to determine the dynamic
SYNCHRONOUS GENERATOR CAHARACTERISTICS AND ITS MODEL The synchronous generators in BISOTUN Thermal Power Plant are round rotor turbo generators, which has been made by ANSALDO Company. The unit under study characteristic data is as follows: Stator: 400 [MVA], 320 [MW], 20 [kV], 11547 [A], 50 [Hz], 3000 [rpm], 0.85 [Power Factor (lag)]. The Excitation System is Static and it injects current to the rotor with brushes. Because of nonsaliency of the rotor shape and the high rotor speed the (2-2) model structure is considered for this generator [5]. The equivalent circuit model structure is shown in Fig. 1
Corresponding Author: Dr. Taher Niknam, Electrical and Electronic Department, Shiraz University of Technology, Modares Blvd, P.O. 71555-313, Shiraz, Iran
326
World Appl. Sci. J., 4 (3): 326-331, 2008
Fig. 1: Equivalent circuit model structure RTDR METHOD AND ITS ALGORITHM RTDR method is the method for synchronous machine parameter estimation from machine under disturbance around nominal operating point [1, 2]. The conventional on-line test for machine modeling involves large disturbance responses, such as synchronization, load rejection and line switching tests. Due to the large transient deviations resulting from these tests, the number and the type of the tests can be restricted by system stability concerns and power equipment considerations [3, 4, R.L.6]. On the other hand, recording the actual field operating data under small-scale disturbances doesn’t constitute any significant effect on the overall operating status of the generating system. Therefore, it is desirable to construct and adjust the synchronous machine model parameters based on the machine small-disturbance responses. In this study, the test data are categorized as the machine small disturbance responses. The dynamics are generated by 1% and 2% changes in the excitation system reference voltage and input torque. Such testing can be operated under nominal operating conditions without any serious effect on the overall operating status of the system. With the above explanation, the RTDR algorithm consists of three main steps. For this method some signals must be acquired from machine under test (or from simulated machine under disturbance, these signals are: Va(t), Vb(t), Vc(t), ia(t),ib(t),ic(t), δ (t), ωr(t), δ (t) is the power angle and ωr(t) is the rotor speed signal. These two signals relates to each other to each other by equation (1) [5]. (t ) =
t
r
(t )− e(t ) = ∫ ( 0
r
( )−
e
( ))d + r ( 0 ) − e ( 0 )
Fig. 2: RTDR method flowchart Vq,, id and iq, can be obtained. Since the machine is connected to a large power system, with balanced conditions, the electrical frequency, ω, varies little from the rated line frequency. Therefore, instead of using the standard Park’s transformation matrix, the following equations can be used [3, 6]: P( t ) = I V b − I V a a a c bc Q( t ) = (V I + V I + V I ) / 3 ab c bc a ca b 2 2 2 V + Vbc + Vca ) Vt ( t ) = ( ab 4.5 I a2 + I b2 + I c2 ) It ( t ) = ( 1 .5 V d ( t ) = Vt Sin ;V q ( t ) = Vt Cos i d ( t ) = ( PSin + QCos ) /( 1 . 5Vt ) i ( t ) = ( PCos − QSin ) /( 1 . 5V ) t q
(1)
The RTDR flowchart has been shown in Fig. 2 By measuring the quantities shown in Fig. 2, the d-and q-axis terminal voltages and currents, Vd, 327
(2)
World Appl. Sci. J., 4 (3): 326-331, 2008
GENETIC ALGORITHM APPROACH AS THE IDENTIFICATION METHOD
As it has been shown in Fig. 2, The first main part of RTDR algorithm is to calculate ψd and ψq by integration from the measured (or simulated) data. Since the machine is connected through the transformer to the power system, the derivatives of daxis and q-axis flux linkages are ignored. This assumption is correct since the rate of change of the terminal voltage and current of the machine is negligible under small disturbance conditions. Therefore ψd and ψq can be calculated from the following equations:
d
=
Vq + Ra iq r
q
=
To identify the dynamic parameters of the synchronous machine the genetic algorithm approach is implemented. This algorithm begins like any other optimization algorithm by defining the optimization parameters, the cost function and the cost. It ends like other optimization algorithms too, after convergence test. A path through the components of the genetic algorithm is shown as a flowchart in Fig. 3 [7]. For this study dynamic parameters are optimization ′ , Tqo ′ , Tdo ′′ , Tqo ′′ X d , X q , X d′ , X q′ , Tdo
− ( V d + Ra id )
parameters. The sum square error (SSE) and relative sum square error (RSSE) which are defined with equations (6) has been considered as costs.
(3)
r
n = ( Factuali − Festimatedi ) 2 SSE ∑ i =1 % RSSE = SSE × 100 n 2 Factual ∑ i i =1
The second part of this algorithm is calculating the ψd and ψq through synchronous machine model. Synchronous Machine Park’s model as explained in section (2) is used for this part. id and iq are also used as input signals for this part. By writing synchronous machine equations, ψd and ψq can be calculated from the following equations:
d
= − x d i d + x ad ( i fd + i1d )
q
= − x q iq + x aq ( i1 q + i 2 q )
Where F is the flux in d- and q-axes. Factual is the signal which is calculated in the first step of RTDR algorithm and Festimated is the output signal from the second step of RTDR algorithm and it is calculated from the estimated parameters.
(4)
For this purpose, rotor currents must be determined, So rotor currents are written according to rotor fluxes and stator currents. These equations have been written in appendix A; so the rotor fluxes can be calculated by solving the following state equations:
P P P P
d
=
0
( V fd − r fd i fd )
1d
=
0
( − r1 d i 1d )
1q
=
0
( − r1q i1 q )
2q
=
0
( − r2 q i 2 q )
(6)
(5)
The above equations are in perunit values and P denotes d/dt. ψd and ψq can be calculated by the method. Circuit parameters must be determined for the mentioned calculations. These parameters are estimated from the third main part of this algorithm. These parameters will be updated according to the difference between ψd and ψq in the steps 1 and 2. In this paper employing Genetic Algorithm does this estimation.
Fig. 3: Flowchart of a continuous genetic algorithm 328
World Appl. Sci. J., 4 (3): 326-331, 2008
Genetic algorithm begins by defining an initial population of Nipop chromosomes. A matrix represents the population with each row in the matrix being a 1î Nparameterd,q array (chromosomes) of continuous parameter values. Given an initial population of Nipop chromosomes, the full matrix of Nipop î Nparameterd,q random values is generated by the following equation [7].
Variation of ACTIVE POWER by 1% change in Field Reference at 300(sec.)
324 322 320
318 P(t) (Mwatt) 316 200 250 300 350 400 450 500 550 Variation of REACTIVE POWER by 1% change in Field Reference at 300(sec.) 270
600
265
IPOPd,q = (hid,q -lowd,q )î random {Nipop î Nparameterd,q } (7) + lowd,q
260 Q(t)
(M v a r )
255 200
Where: Random {Nipop , Nparameterd,q } = a function that generates an Nipop î Nparameterd,q matrix of uniform random numbers between zero and one
17.58
250 300 350 400 450 500 550 600 Variation of AMPLITUDE of TERMINAL VOLTAGE by 1% change in Field Reference at 300(sec.)
17.56 17.54
hi: highest number in the parameter range Low: lowest number in the parameter range.
a m p17.52 litu de V(t) (KV) 200 250
This society of chromosomes is not a democracy. Each one’s worth is assessed by the cost function. Then by sorting the initial population according to the minimum cost, Ngood chromosomes which have the minimal costs are selected for mating and others will be go out. Assuming the crossover, mutation and other operators of genetic procedure are applied to the obtained population from previous step. Applying this procedure iteratively to the population improves the cost function; so the mutation probability is decreased exponentially after each iteration. In This study initial population is considered to be 100 chromosomes which are selected among 1000 ones. Probability of crossover (Pc) varies during the program eventually. The remind details will not be described for the sake of brevity. The convergence condition is achieving the SSE lower than 0.0001, i.e. RSSE ≤ 0.001 which has been implemented in the optimization program.
300
350
400 Time (sec.)
450
500
550
600
Fig. 4: Variations of machine outputs for 1% change in excitation reference voltage at t=300 (sec) 328
Variation of ACTIVE POWER by 1% change in TORQUE Reference at 300(sec.)
326 324 322 P(t) (Mwatt) 320 200 250 300 350 400 450 500 550 Variation of REACTIVE POWER by 1% change in TORQUE Reference at 300(sec.) 260
600
258 256 254 Q(t) (Mvar) 252 200 250 300 350 400 450 500 550 600 Variation of AMPLITUDE of TERMINAL VOLTAGE by 1% change in TORQUE Reference at 300(sec.) 17.54 17.53 17.52
SIMULATION OF ON-LINE METHOD FOR THE GENERATOR
17.51 a m p 17.5 litude V(t) (KV) 200 250
The shape of an input signal, which is applied to a system for parameter estimation, must excite the different modes of the system (Persistently of exciting condition). White noise or Pseudo Random Binary Sequence (PRBS) are ideal for identification but generating of such signals need to special equipment. Meanwhile operators usually don’t permit to apply these signals as input. It is known that step change is the easiest way to excite the dynamic modes of any system. These changes can be executed through excitation system (applying an external signal to voltage reference node in AVR, by unit transformer tap changing or operator increase or decrease command),
300
350
400 Time (sec.)
450
500
550
600
Fig. 5: Variations of machine outputs for 1% change in input torque t=300 (sec.)
329
Governor control system (increase or decrease for load demand) or load rejection. A test procedure which is safe to perform and don’t require expensive equipment is step changing in voltage or load reference. This method has been simulated by 1% and 2% changes in the excitation reference voltage and input torque which are considered as input disturbance. To simulate the machine outputs, first the synchronous machine, which is connected to an infinite bus through a reactance, is
World Appl. Sci. J., 4 (3): 326-331, 2008
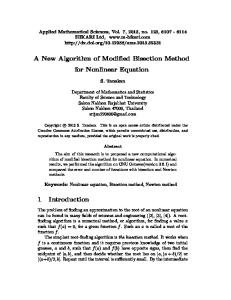
simulated. This simulation is done in SIMULINK. Since the rate of change of the terminal voltage and current of the machine is negligible under small disturbances, the derivatives of d- and q-axis flux linkages in machine model are ignored; so the network’s model would have no electric transients and a phasor configuration can be assumed for it [8, 9]. The above mentioned disturbance can be simulated in the form of step changes in the operating conditions. These disturbances are implemented to the machine at the steady state operating conditions. Figure 4 and 5 show the changes of machine outputs by the above disturbances which are implemented to the generator at steady-state conditions at t = 300 second.
SIMULATED and ESTIMATED FLUX in d-axis in P.U. (Disturbance : 1% change in Torque Reference at 300 (sec.)) 0.915
0.91
0.905 d-Flux (P.U.)
0.9 300
-0.59 300
400
450 Time (second)
500
550
X d ≥ X q > Xq′ ≥ X′d > X q′ > X′d′ ′ > Td′ > Tdo ′′ > Td′′ Tdo T′ > T′ > T′′ > T′′ q qo q qo
600
SIMULATED and ESTIMATED FLUX in q-axis in P.U. (Disturbance : 1% change in Field Reference at 300 (sec.)) -0.56
600
(8)
All estimated parameters fulfill the above limitations. Meanwhile Table 2 shows the parameters were found in the documents of the power plant. Comparison of these values to the corresponding identified values, show the accuracy of the model.
-0.565 -0.57 q-Flux (P.U.) -0.575 -0.58 300
350
Model Validation is the most important step in any identification procedure. The easiest way to validate a model is to compare the estimated model response to the simulated output. This strategy was selected to compare the output of the estimated model to the simulated (actual). As the figures show all estimated models are good enough. Another criterion to check the limits of the derived parameters are using the equation (8), which investigated for both axes.
d - F l0.91 ux (P.U.)
550
600
MODEL VALIDATION
Estimated
500
550
Fig. 7: Simulated and estimated fluxes in 1% change in input torque at t=300 (sec)
0.915
450 Time (second)
500
q - F-0.585 lux (P.U.)
Simulated
400
450 Time (second)
-0.58
SIMULATED and ESTIMATED FLUX in d-axis in P.U. (Disturbance : 1% change in Field Reference at 300 (sec.)) 0.925
350
400
-0.575
The full RTDR algorithm as explained in the above sections was simulated in MATLAB. To identify the machine parameters it is needed to imp lement Genetic Algorithm [7] to the input-output measured signals. These signals were obtained through simulations in section (V) via applying different small disturbance. These signals were obtained through simulations via applying different small disturbance. Figure 6 shows the simulated and estimated machine output (Fluxes) in d- and q-axis in various small disturbance conditions. Table 1 shows the simulated and estimated parameters in various disturbance conditions.
0.905 300
350
SIMULATED and ESTIMATED FLUX in q-axis in P.U. (Disturbance : 1% change in Torque Reference at 300 (sec.)) -0.57
SIMULATION OF RTDR ALGORITHM AND ITS RESULTS
0.92
Simulate d Estimated
350
400
450 Time (second)
500
550
CONCLUSION
600
In this paper, a dynamic test procedure for identification of machine parameters for BISOTUN Thermal Power Plant was presented. Employing small
Fig. 6: Simulated and estimated fluxes in 1% change at field reference at t=300 (sec) 330
World Appl. Sci. J., 4 (3): 326-331, 2008 Table 1: Simulated and estimated parameters in various disturbance conditions Estimated Parameters
Estimated Parameters from
Estimated Parameters from
Estimated Parameters from
Real
from 1% disturbance
2% disturbance in
1% disturbance in
2% disturbance in
values
in field reference
field reference
input torque
input torque
X d′
1.840
1.840
1.840
1.840
1.840
X ′d′
0.076
0.075
0.078
0.075
0.078
T do′
0.790
0.810
0.820
0.797
0.824
T do′′
0.264
0.284
0.284
0.240
0.275
X
0.344
0.370
0.363
0.373
0.370
X ′q
1.960
1.976
1.940
2.000
2.000
X ′q′
0.038
0.043
0.039
0.039
0.044
T q′o
5.780
5.770
5.760
5.760
5.760
T qo′′
0.164
0.140
0.130
0.140
0.137
X
0.254
0.256
0.250
0.258
0.260
d
q
Table 2: Dynamic parameters of the generator in technical documents
Ra 0.0033
Xl
Xd
Tdo′′
Tdo′
X ′d′
X ′d
0.125
1.78
0.038
5.78
0.16
0.23
disturbances to the excitation and governor systems satisfactorily identified the parameters of the model. Genetic Algorithm approach was used to estimate the parameters.The derived model was validated and its responses to the same disturbances were very close to the corresponding outputs of actual machine. Finally a step change is offered to employ to the excitation system (by changing Unit Transformer Tap changer), because of its simplicity and safety to perform.
4.
5. 6.
REFERENCES 1.
2.
3.
Kamwa, I., P. Viarouge and E.J. Dickinson, 1991. Identification of generalized models of synchronous machines from time domain tests. IEE Proceeding-C. Wamkeue, R., I. Kamwa, X. Dai-Do and A. Keyhani, 1999. Iteratively Reweighted Least Square for Maximum Likelihood Identification of Synchronous Machine Parameters from On-Line Tests. IEEE Transactions on Energy Conversion, 14 (2). Tsai, H., A. Keyhani, J. Demcko and R.G. Farmer, 1995. On-Line Synchronous Machine Parameter Estimation From Small Disturbance Operating Data. IEEE Transaction on Energy Conversion, Vol: 10 (1).
7. 8.
9.
331
Rusche, P.A.E., G.J. Brock, L.N. Hannet and J.R. Willis, 1990. Test and Simulation of Network Dynamic Response Using SSFR and RTDR Derived Synchronous Machine Models. IEEE Transactions on Energy Conversion, Vol: 5 (1). Paul C. Krause, 1986. Analysis of Electric Machinery. Mc Graw-Hill series in Electrical Engineering, Power and Energy. Horning, S., A. Keyhani and I, Kamwa, 1997. Online Evaluation of a Round Rotor Synchronous Machine Parameter Set Estimated From Standstill Time-Domain Data. IEEE Transactions on Energy Conversion, 12 (4). Haupt, R.L. and S.E. Haupt, 1999. Practical Genetic Algorithms. Jhon Wiely and Sons Inc. Huang, C.T., Y.T. Chen, C.L. Chang, C.Y. Huang, H.D. Chiang and J.C. Wang, 1994. On-Line Measurement-Based Model Parameter Estimation for Synchronous Generators; Model Development and Identification Schemes. IEEE Transactions on Energy Conversion, Vol: 9 (2). Shande, S., Z. Shouzhen and H. Bo, 1991. Identification of Parameters of Synchronous Machine and Excitation System by On-Line Test. IEE International Conference on Advances in Power System Control, Operation and Management, November 1991, HongKong.