Philipp Kogelnik
A Mobile Augmented Reality App for Hiking Maps
Bachelor’s thesis
Graz University of Technology Institute for Computer Graphics and Vision Head: Univ.-Prof. Dipl.-Ing. Dr.techn. Dieter Schmalstieg Supervisor: Dipl.-Ing. Jens Grubert Graz, December 2014
This document is set in Palatino, compiled with pdfLATEX2e and Biber. The LATEX template from Karl Voit is based on KOMA script and can be found online: https://github.com/novoid/LaTeX-KOMA-template
Statutory Declaration I declare that I have authored this thesis independently, that I have not used other than the declared sources/resources, and that I have explicitly marked all material which has been quoted either literally or by content from the used sources.
Graz, Date
Signature
Eidesstattliche Erkl¨ arung1 Ich erkl¨are an Eides statt, dass ich die vorliegende Arbeit selbstst¨andig verfasst, andere als die angegebenen Quellen/Hilfsmittel nicht benutzt, und die den benutzten Quellen wortlich und inhaltlich entnommenen Stellen als ¨ solche kenntlich gemacht habe.
Graz, am Datum
Unterschrift
1 Beschluss
der Curricula-Kommission fur ¨ Bachelor-, Master- und Diplomstudien vom 10.11.2008; Genehmigung des Senates am 1.12.2008
iii
Abstract The augmented reality technology is able to process the user’s environmental context and extend the reality with useful information. This could be used in the context of paper maps to visualise up-to-date information and provide interactive features. The main intention behind this type of augmented reality application is to increase the value of static maps for the user. In this work a prototype of an augmented reality app for mobile devices is developed which adds further information to hiking maps of the region Rohrmoos-Schladming. The background of this project is to provide a real world application for evaluating AR interfaces. The prototype includes a 3d model of the region and visualises the data of implemented remote services. This thesis is intended to explain the concepts behind the application to provide details about the included features and the abilities of the app. In addition to the concepts a closer look on the technical implementation is taken. This includes the creation of the 3d model, the implementation of the remote services and the design of the user interface. To be able to evaluate the application in a productive stage a remote logging system is included, which is also described in the scope of this work.
v
Contents Abstract
v
1 Introduction 1.1 Motivation . . . . . . . . . . . . . . . . . . . . . . . . . . . . . . 1.2 Contribution . . . . . . . . . . . . . . . . . . . . . . . . . . . . . 1.3 Limitations . . . . . . . . . . . . . . . . . . . . . . . . . . . . . .
1 1 2 3
2 Related Work 2.1 Augmented Reality Applications . . . . . . 2.2 Augmented Reality Evaluation in the wild 2.3 Hiking Apps . . . . . . . . . . . . . . . . . . 2.4 Augmented Reality Frameworks . . . . . .
. . . .
5 5 7 8 9
3 Concepts 3.1 Features . . . . . . . . . . . . . . . . 3.1.1 3D model . . . . . . . . . . . 3.2 Landscape Data Aggregation . . . . 3.2.1 Data sources . . . . . . . . . . 3.3 User Interface . . . . . . . . . . . . . 3.3.1 Augmented Reality Interface 3.3.2 Virtual Reality Interface . . . 3.4 Remote Logging . . . . . . . . . . . .
. . . .
. . . .
. . . .
. . . .
. . . .
. . . .
. . . .
. . . .
. . . .
. . . .
. . . . . . . .
. . . . . . . .
. . . . . . . .
. . . . . . . .
. . . . . . . .
. . . . . . . .
11 11 12 13 13 14 15 15 16
4 Implementation 4.1 Tools . . . . . . . . . . . . . . . . . . . . . . . . . . . . 4.2 Textured Digital Elevation Model . . . . . . . . . . . . 4.2.1 Coordinate Systems . . . . . . . . . . . . . . . 4.2.2 Parsing and Downsampling of Elevation Data 4.2.3 3D Modelling . . . . . . . . . . . . . . . . . . .
. . . . .
. . . . .
. . . . .
. . . . .
. . . . .
19 19 21 21 22 23
. . . . . . . .
. . . . . . . .
. . . . . . . .
. . . . . . . .
. . . . . . . .
. . . . . . . .
. . . . . . . .
. . . . . . . .
. . . . . . . .
vii
Contents
4.3 4.4
4.5 4.6
4.2.4 Texturing . . . . . . . . . . Augmented Reality Scene . . . . . 4.3.1 Calculation of Coordinates Implementation of Online Services 4.4.1 Weather layer . . . . . . . . 4.4.2 Tracks layer . . . . . . . . . Virtual Reality Interface . . . . . . Remote Logging . . . . . . . . . . . 4.6.1 Tracked Data . . . . . . . . 4.6.2 Reports . . . . . . . . . . . .
. . . . . . . . . .
. . . . . . . . . .
. . . . . . . . . .
. . . . . . . . . .
. . . . . . . . . .
. . . . . . . . . .
. . . . . . . . . .
. . . . . . . . . .
5 Results 5.1 Performance . . . . . . . . . . . . . . . . . . . . . 5.1.1 Comparison Lowpoly/Highpoly Meshes 5.1.2 Static batching . . . . . . . . . . . . . . . 5.2 Expert Evaluation . . . . . . . . . . . . . . . . . . 5.3 Challenges . . . . . . . . . . . . . . . . . . . . . .
. . . . . . . . . . . . . . .
. . . . . . . . . . . . . . .
. . . . . . . . . . . . . . .
. . . . . . . . . . . . . . .
. . . . . . . . . . . . . . .
. . . . . . . . . . . . . . .
. . . . . . . . . . . . . . .
. . . . . . . . . .
24 25 27 28 29 30 32 33 33 34
. . . . .
37 37 38 38 39 40
6 Conclusion and Further Work
41
Bibliography
43
viii
List of Figures 3.1
Concepts image of the weather layer workflow . . . . . . . . . 14
4.1 4.2 4.3 4.4 4.5 4.6 4.7 4.8
WGS84 coordinate system [34] . . . . . . . . . . UTM raster for Europe [37] . . . . . . . . . . . . QGIS measurement of map rotation . . . . . . . Explanation of model offset . . . . . . . . . . . . Screenshot of the weather layer . . . . . . . . . . Screenshot of the hiking tracks layer . . . . . . . Screenshot of a custom Google Analytics report Screenshot of the Google Analytics world view
. . . . . . . .
. . . . . . . .
. . . . . . . .
. . . . . . . .
. . . . . . . .
. . . . . . . .
. . . . . . . .
. . . . . . . .
22 22 25 27 30 31 35 35
ix
List of Tables 2.1 2.2
Hiking app overview . . . . . . . . . . . . . . . . . . . . . . . . 8 AR framework overview . . . . . . . . . . . . . . . . . . . . . . 10
3.1
Possible features divided in categories . . . . . . . . . . . . . . 12
4.1 4.2 4.3 4.4
Used tools . . . . . . . . . . . . . . . . Paper map corner coordinates (UTM) Supported touch gestures . . . . . . . Google analytics event data . . . . . .
5.1 5.2
Lowpoly performance . . . . . . . . . . . . . . . . . . . . . . . 38 Batching performance . . . . . . . . . . . . . . . . . . . . . . . 39
. . . .
. . . .
. . . .
. . . .
. . . .
. . . .
. . . .
. . . .
. . . .
. . . .
. . . .
. . . .
. . . .
. . . .
20 23 32 34
xi
1 Introduction Augmented Reality has become a popular application domain for consumer oriented mobile applications (apps) [1]. It is a subdivision of Mixed Reality (MR) - the mixing of computer generated content into real world [2]. Partly this development comes from the fact, that nowadays smartphones are widely-used and fast enough for real time image tracking. Many companies have already discovered the benefits of AR and use it in different application areas, like showing additional information in books or playing games in the real world [3]. This chapter gives an overview of the project’s scope and shows the motivation behind this thesis.
1.1 Motivation Because this technology is relatively new, much research is done in this area to find new applications and interface types for increasing the benefits of Augmented Reality. Schladming-Dachstein Tourism Marketing tries to increase the value of their region and wants to use new technologies to achieve this goal. At the moment there are paper maps of the region Schladming-Rohrmoos which are positions at selected tourist spots. The maps should give the hikers and bikers an overview of the whole area, so they can plan their trails. But there are some problems with paper maps. One of them is that the content of the map is static, so the information on the map cannot be updated and new data cannot be added. So a way must be found to combine up-to-date information with the maps of the region. AR can be used to
1
1 Introduction make the maps interactive and combine them with additional information [4]. Moreover the paper maps only provides geographic data. But the aim should be to provide information about different topics which are important for hikers like weather forecasts and predefined hiking tracks. Another interesting feature is the integration of social data like finding nearby users or sharing the walked route. As one can see in these lines, AR is a field which can work closely together with many other areas of research. So the usage of this technology is very interesting but can also be very challenging.
1.2 Contribution The aim of this bachelor thesis is to create an application for mobile devices to add additional information to paper maps. The app contains an AR interface to work with the maps positioned in the region Schladming-Rohrmoos and moreover a Virtual Reality (VR) interface to use it when there is no paper map nearby. The higher level target behind this project is to discover the benefits of VR and AR interfaces for this kind of application and evaluate them in a real world environment. An important feature for hikers is to know about the structure of the landscape like height the area or difficulty of hiking trails. Therefore a 3D model if the landscape can be projected on the maps. To add additional data, some services are included which can provide important data for hikers. The evaluation of useful and necessary features is done in 3.1. To evaluate the usage of AR and VR in productive applications, a remote logging system is implemented. This system tracks all activities which are performed in the app, without influencing the user experience [5]. With this information, a detailed conclusion can be given about the time spent AR and VR modes and which actions are used very often.
2
1.3 Limitations
1.3 Limitations Due to the limited time of the project, only a prototype of the app can be provided. This means that only a limited set of example data services are included in the current version of this bachelor thesis. To save time for more important features not all services are implemented in their final form, like using offline data instead of a real online service. Moreover the appearance of the app is only rudimentary designed and not ready for release. Summing up this is only a prototypical implementation to show Schladming-Dachstein Tourism Marketing the benefits of AR and how a final product can look like. Moreover user studies which are comparing the AR and the Virtual Reality interface of this application are not performed because of the limited time. Therefore the interface of the app should be evaluated at a later stage. However, a first usability evaluation has been carried out by a remote expert of the University of Oulu which can be found in 5.2. Another important topic which is not covered is testing the app on different platforms and systems. Because of a limited repertoire of devices, tests can only be performed on the available smartphones and tablets. Although Unity 3D [6] is used to provided support for different mobile operating systems, it cannot be guaranteed to work. The same can be said about different screen resolutions, because there is a variety of resolutions which are used on mobile devices, especially on Android phones [7].
3
2 Related Work This chapter shows related work in the field of Augmented Reality (AR) to get basic knowledge about the applications of this technology. Furthermore some results of AR interface evaluations and the comparison to traditional interfaces is provided.
2.1 Augmented Reality Applications Augmented reality is a technique for extending the real world with some additional virtual information like sound or 3d models. In the last years many different applications have been identified and nowadays it is widely used. Well-known examples are so-called AR browsers, which make use of labels to visualize points of interest in context of the user’s real world environment on top of the device’s video feed [8]. There are also many other usages like applications to assist surgeries, educational software or mobile games [3]. A subcategory of AR is the field of Mobile Augmented Reality (MAR) [9], which covers applications on mobile devices like smartphones or headmounted displays (HMD). The app which is developed as a part of this thesis belongs to this category. Like the general AR technique, MAR could also be used in a variety of application contexts. As mentioned before, some mobile games already take advantage of this technology and become very popular. MAR can also be used in education as an extension to traditional books for adding some additional information collected in the web or provided by the publisher [9]. Another useful category is software, which provides extended data to physical maps. This is the research field which
5
2 Related Work is covered in this work. Therefore some related workings in this scope are presented in this section. Tunnel Vision App [10]. This app provides data from a variety of sources and presents it on the Metropolitan Transportation Authority subway map which is ubiquitous throughout New York. A big advantage of this app is the distribution of the map in the whole city, which leads to a wide potential user base. So people waiting for busses or subways can use it get some interesting facts about the area where they are located. The displayed data includes up-to-date information about the subway and US census data (average income, average rent etc.). Paper Map Visualization [11]. Adithya et al provide in their paper a solution for displaying a 3D digital elevation model (DEM) on a physical map. The approach of this paper is similar to the concepts used in the hiking map prototype described the next chapters, but the contextual focus is on military maps for operation plans. According to Adithya et al paper maps do not always provide the needed level of detail and realism of the area. Therefore a DEM is used to enhance the map with clearer height information. The map is split into several parts to provide the ability of showing only a part of the map in 3D. To show the DEM of a specific region, a marker has to be moved on the chosen area of the map and subsequently the model is shown above the marker. MapLens. This is an application for phones with Symbian OS by Morrison et al [12] which is used to evaluate the usage of AR in combination with maps. Due to the academic background of this app it only provides the feature of displaying location-references images on the map, because this action is used in the evaluation. Augmented transit maps [13]. Stroila et al show a way to augment the user experience in public transport locations and vehicles. The transit maps are extended with the ability to select stations and the ability to calculate the remaining time until the arrival at the destination. According to them this app could also be used as an advertising platform. Time-wARpXplorer [14]. This location based AR game by Lochrie et al is developed to raise awareness of historic sites in Lancaster. Standing in front of a site the user can augment the reality with some historic photographs.
6
2.2 Augmented Reality Evaluation in the wild Moreover an achievement for the visited location is unlocked and the play can take and upload their own photos. The app is not only designed for locals, but also for visitors to explore the city.
2.2 Augmented Reality Evaluation in the wild There are some papers which evaluate AR interfaces and compare them to traditional user interfaces like simple zoom able views. The result of them is that the AR mode is used to get a short overview of the setting and gain additional information which depends on the context of the user. For displaying detailed data and static data, which does not necessary need the context information, traditional interfaces are preferred by many users. Grubert, Grasset and Reitmayr showed in their evaluation of an AR app for event posters, that people feel uncomfortable when the AR interface is used for an extended period of time. In their second case study, which evaluates the usability of an AR interface in a gaming context, more participants used the AR interface. However, this behaviour could occur because of the novelty of the technology. There are two main reasons for switching from AR to VR mode. Firstly the users get impatient and switch modes if the tracking of game poster does not work. And a second reason is, that some users do not want to walk closer to the poster to identify small icons. [15]. In a detailed evaluation paper of AR interfaces in combination with game posters, error rate and task completion time of AR and VR mode are compared. The result is, that there are no significant differences in performance. The slightly higher time to complete in AR mode can be due to tracking issues which also explains the higher standard deviation. Moreover the reactions of people walking by are logged and evaluated. The findings of the recordings are that 68% of them are not noticing the participants, the poster and the recording equipment at all. [16] As already mentioned before Morrison et al evaluated the AR interface of the app MapLens which is developed by themselves. The app is developed for Nokia feature phones running on Symbian OS S60 which implies that these phones do not provide any touch interaction. A second application
7
2 Related Work named DigiMap was developed which provides a digital map (VR) with the same information as MapLens. The participants of the evaluation were asked to take part in a treasure hunt game with different predefined instructions where they had to take and upload photos of themselves performing the tasks. When comparing the pictures taken with in VR and AR apps, the VR users uploaded more non-task-related photos which indicates that they are more oriented to their surrounding environment. The analysis of the results also shows more accurate reports from the AR users. If aggregating the results into one statement, the AR interface leads to a better concentration onto the game tasks. By contrast the digital map invites to a higher environmental awareness. This states that the purpose of the app should be considered when choosing an interface type. [12]
2.3 Hiking Apps In this section some popular mobile hiking apps are shown to get knowledge about the features provided by similar apps. All of them are available in the Google Play Store and the rating is based on the value of July 2014. The following table lists only a representative part of all evaluated apps, but enough for presenting the most common feature in the field of hiking applications. App alpenvereinaktiv.com [17] Maverick Pro [18] ¨ Wanderkarte Osterreich [19] AlpineQuest GPS Hiking [20] apemap Outdoor und Wander- Navigation [21]
Rating 4.3 4.3 3.0 4.6 4.2
Price[e] free 4.99 free 6.99 free (Pro: 19.99)
Table 2.1: Hiking app overview
alpenvereinaktiv.com provides different types of tracks like skiing-, hikingand climbing-tracks including elevation profile. According to user feedback the interface is well-structured and has a very high usability. The highlight of this app is the integrated navigation which is only provided by alpenvereinaktiv.com.
8
2.4 Augmented Reality Frameworks Maverick Pro is an app which includes map from many different sources like Open Street Maps, Bing and some regional data sources. The maps are automatically cached for offline usage so it can also be used in real hiking situations with unstable network connections. Key features are track recording and the possibility to create way points and export them. ¨ The app Wanderkarte Osterreich is mainly used to record tracks and show some statistical data like speed, duration and distance. The rating is average because of the missing zoom functionality for maps. AlpineQuest GPS Hiking is the best rated app in the provided list. Moreover it provides the largest amount of features and can be used for a variety of outdoor activities. Like in Maverick Pro different map sources are integrated and they support extending them with different layers (POI, tracks etc.). Own tracks can be recorded and shared with friends. The app is highly rated because there are hardly ever crashed and the interface is easy to use. apemap Outdoor und Wander- Navigation is the only app with a 3d view of the maps. Many tracks (mainly located in Austria, Germany and Switzerland) are available for downloading. A desktop application can be used to create custom tracks and transfer offline maps to the smartphone. Points of criticism are the high price for fee-based maps and the complexity of the user interface.
2.4 Augmented Reality Frameworks The aim of this section is to give a short overview of AR frameworks which support mobile devices. Due to the large number of frameworks only some important ones are presented. ARToolkit supports two different licenses. Older versions are available under the GPL license and the newer ones can only be used with a commercial license. The core is written in C and C++, but there are several 3rd party wrappers to use ARToolkit with other programming languages.
9
2 Related Work Framework ARToolkit [22]
Platforms iOS, Android, Unity Cross Platform DroidAR [23] Android Metaio SDK [24] iOS, Android, Unity, Web Qualcomm Vuforia [25] iOS, Android, Unity Cross Platform Total Immersion AR Engine [26] iOS, Android, Web Wikitude SDK [27] iOS, Android, Smart Glasses
License free, commercial tion GPLv3 free, commercial tion free, commercial tion commercial free, commercial tion
Table 2.2: AR framework overview
DroidAR. This framework is only designed for being used in Android apps, therefore the area of application is very limited. But the source code of the whole project is available, so the functionality can be reviewed, bugs are able to be fixed and new features can be implemented. Marker-based and location-based AR are supported. Metaio SDK supports a broad range of platforms including HMDs and the Web. It integrates very well into Unity 3D and provides an easy to use SDK. This framework is able to track 2D and 3D targets and QR codes. Qualcomm Vuforia provides support for many different platforms due to the very good integration into Unity 3D. This framework also includes the ability to track some different types of targets like image targets, cubic targets, or frame markers. Total Immersion AR Engine. This is the only framework in the list which exclusively provides a commercial license. It provides support for many platforms native applications for mobile devices and desktops or web applications. Wikitude SDK supports apps for iOS, Android and Smart Glasses. Two big advantages of Wikitude are the big number of developers working with this tool and the easiness to use. Due to these reasons many tutorials exist and people new to it have a relatively steep learning curve.
10
op-
opop-
op-
3 Concepts In this chapter a closer look is given the features which are included in the prototype and how they are planned to be implemented.
3.1 Features To create an app which provides additional benefit to physical maps, some research has to be done to identify useful features. There is only one feature that is explicitly asked by Schladming, which is the paper map augmentation with the 3D model of the region. The landscape model itself does mostly provide geographic data to hikers, so there should be additional services which are helpful prior to and during hiking trips. There are several ways to get ideas for possible functionality in an application. In this work two of them are used to get feature suggestions. The features are then classified into three areas - public data, personal data and social data. First of all an informal survey within friends and relatives has been done. This process provided some interesting suggestions which are collected and divided into the three categories. Afterwards ideas which are technically not possible to implement or do not correlate with the planned way the app is working are sorted out. In the second step the list of suggested features is compared with functionality which is provided by popular similar apps. To get this information different popular hiking apps in the Google Play Store are examined the get a look over highly rated features based on the used comments. After combining all ideas there is an array of possible features, which can be used
11
3 Concepts in development. A subset with very helpful suggestions can be found in table 3.1. Public data Weather warnings
Personal data Current location
Current weather
Track recording
Show images of area
Mark visited locations
Social data Share visited places on social media See other people in current area
Sunrise and sunset times Hiking tracks Hiking huts Names of mountains, lakes and cities on top of 3D model Table 3.1: Possible features divided in categories
Due to the prototype approach of this application only a limited set of features should be included within the scope of this work. Therefore the list of possible features is mainly called into action in further work after finishing the prototype. Social and personal data are excluded from being implemented in this version, because they mostly need some infrastructure to store the data which is generated when using the app. And these implementations would exceed the scope of this work. The decision on which public data features to include in the prototype fell on the current weather and the hiking tracks.
3.1.1 3D model The only feature that was already planned when the work was started is the 3D model overlay. This should give the user a plastic presentation of the region. Due to the usage on mobile devices there are a few special
12
3.2 Landscape Data Aggregation requirements and limitations that are important in the implementation process. First of all the resolution of the model cannot be very high because of the lower computing power compared to desktop computers. Therefore some downsampling of the data has to be done before using it in a 3D scene. As Klein et al showed in their work [28] the number of mesh polygons can often be reduced at a high percentage without losing very much information. Another point to consider is that the paper maps are deployed vertically, which implicates that the 3D model is mostly seen from the top. In such a view vertical model features are hardly visible. To overcome this issue vertical exaggeration can be done. This means that the vertical features are highlighted by stretching the model in the z-axis. [29, Chapter 2]
3.2 Landscape Data Aggregation The creation of the 3D landscape model, which is described in the previous chapter, is a very complex task. The biggest challenge is the unification of different data formats, coordinate systems and reference units. A very good introduction into the landscape model creation is given by Petersen et al in the book Fundamentals of Physical Geography[29]. According to them the creation process of the model consists of three tasks. First of all an digital elevation model (DEM) of the region has to be generated. The second task is to get some georeferenced satellite images which can be layed over the model. And the last step is combining these two to get a textured 3D landscape model of the region Rohrmoos-Schladming.
3.2.1 Data sources The required data is not accessible for all regions in the world. But in many countries there are some governmental institutions or geographic instututes which do the measuring of the regions. For the region of this work the responsible institute is GIS Steiermark, which does airborne laser scanning
13
3 Concepts
Figure 3.1: Concepts image of the weather layer workflow
(ALS) measurements for the whole state of Styria. Moreover they provide high resolution orthographic images which are usable by this application.
3.3 User Interface The user interface is a very important part in the development process of a mobile app. In most cases the first impression is essential for the decision if a user starts the app a second time, because workflow issues or a bad usability are far worse than missing features. To provide a useful interface a layered approach is chosen. This means that each feature can be enabled in a separate layer and does not effect other features. When considering the previous concepts we get a total of three layers - landscape model layer, weather layer and tracks layer. A conceptional layer can be found on figure 3.1. The big advantage of the separate layer for each feature is the independence of work. If one layer produces an error or does accidentally effect other layers this part can be deactivated easily. This way the workflow could be interrupted for a few seconds, but there is an easy way to continue without the earlier problems.
14
3.3 User Interface
3.3.1 Augmented Reality Interface The AR interface should be the default user interface when starting the application. It is supposed to give additional value to the paper maps when standing directly in front of them. The biggest advantage of this type of interface compared to a VR interface is the ability to point the device to a map location and the app immediately shows content of the selected location. If the paper map gets tracked on the video feed of the device, the 3d landscape model should be displayed above the map. So the user can better decide, which hiking tracks are suitable to his skills. The additional layers which are mentioned in 3.1 should be shown either above the landscape model if it is enabled or directly on the map otherwise. If the 3d is disabled a tracking border should be displayed around the paper map to make clear if the map is tracked at the moment.
3.3.2 Virtual Reality Interface The AR interface is a great addition to the paper maps which are deployed at public places in the region Rohrmoos-Schladming. But what if the user wants to get information and there is no map nearby? Or what if the user is in front of the map, but it is already dark and the map cannot be tracked? For this case there has to be another interface which can be used everywhere and everytime. To overcome this issue a VR mode of the interface should be implemented. This mode should implement the same functionality as the AR mode. The aim is that the VR view could be navigated by touch gestures, because smartphone users are used to this type of input. According to Yee [30] a main target when implementing touch gestures is, that the learning curve should be minimized. Especially older users, who are not always familiar with touch input, should be able to use the specified with ease. Moreover the gestures have to be easily distinctable, because very similar interaction cannot be recognised with a high accuracy. This means that similar gestures lead to a higher failure rate.
15
3 Concepts After considering these limitations dragging, pinching and swiping gestures are used. To keep them easy there are not more than two fingers which have to be used. In outdoor scenarios touch gestures are not always very intuitive in usage. Especially when fingers are stiff and cold the navigation is not as easy as it should be. To avoid such cases a secondary navigation interface is implemented, which do not use touch gestures. In a comparison between soft buttons and touch gestures Bragdon et al [31] figured out, that there are no big differences in performance and accuracy. To provide an interface with the same abilities as the touch gestures, there are buttons enable the same functionality as dragging, pinching and swiping. Additionally a button which resets the camera to the default view is added to the interface.
3.4 Remote Logging In order to have a view on the feature usage after the app release, a remote logging system should be implemented. This means that different actions are tracked and sent to a tracking provider, which aggregates the data. The biggest advantage of logging event data is the possibility to identify the popularity of features. This could help improving the user interface or extending the functionality of the app in later versions. To track events even if the network connection is interrupted an offline cache should be implemented. If the network is not available the data is stored in a temporary cache file. At the next app startup each event in the cache is resent and is included in the next data analysis. To provide the previously mentioned information some data has to be recorded and sent to the tracking provider. A detailed list of which data should be able to figured out with logging is provided in the following list. • Time spent in application • Time spent in AR/VR
16
3.4 Remote Logging • Time spent with features activated • Number of application startups • Number of AR/VR mode switches In order to get these information an event must be sent at every activation/deactivation of a feature. Moreover the switch between AR and VR mode should be logged. Each event does not only include the new state of the mode or feature, it also contains the time spent since the last corresponding event.
17
4 Implementation One of the main topics of this work is the implementation of the prototype. This chapter covers the complete process starting with the finding of the right tools to work and ending with the programming of the features. Some information is given about the conversion, interpolation and processing of the geographic data. The implementation of different services is shown by the examples of weather and hiking tracks. Due to the reason that the paper maps are not always available when using the app, a VR interface is added to use the software also during hiking trips. To evaluate the usage of the app, a remote logging system is included. This enables the possibility to create reports about time spend in different modes and the number of performed tasks.
4.1 Tools To start with the implementation of the app the right tools have to be found. This section provides a small overview of all used tools and how which feature they are providing. 3DEM. This tool is able to visualise terrains out of a variety of data formats. On the other side the 3D images can be exported in different file formats, so it can be used to convert geographic data files. Sadly the development is not continued any more, but the author has given his permission to release the tool for free. QGIS. With this software maps with many layers can be created and viewed. The layers can consist of raster or vector data in different formats. More-
19
4 Implementation Tool Category 3DEM [32] Terrain Visualisation QGIS Geographic Information System MeshLab Mesh Processing 3DS Max 3D Computer Graphics Unity3D Game Creation System Visual Studio 2013 Development Environment Paint.net Raster Graphics Editor Table 4.1: Used tools
over it is possible to do measurements of the maps to get the geographic coordinates of points on the map. With MeshLab it is possible to create 3D meshes out of files in many different data formats. Exporting is also possible in a variety of common formats. So this tool is suitable to create the models out of data files and export them to do the processing in 3DS Max. 3DS Max. This software is able to do professional 3D modelling, animations, simulations and rendering. Unity3D is a commercial game creation software. It can be used to create complex game scenes and provides some integrated assets like lights or simple primitive meshes. Furthermore this software is particularly suitable for creating AR application because of the good integration of Qualcomm Vuforia. Visual Studio 2013 is a commercial integrated development environment to create applications in different programming languages (mainly based on the .NET framework). It comes with extensive debugging abilities and supports the inclusion of plug-ins. Paint.NET is an open source tool for creating and editing raster images. Due to the big community, there are many plug-ins which extend the software with new features and image filters. So Paint.NET is a really powerful tool to do simple image processing.
20
4.2 Textured Digital Elevation Model
4.2 Textured Digital Elevation Model The first feature which is included in the app is the ability to project a 3D model of the landscape onto the paper map. This gives hikers the information to plan hiking trails which are not to difficult but hard enough for their skills. Traditional maps can also give rudimentary height information, but the are less intuitive than 3D models. The readers of 3D maps can easily visualise elevation differences and topographic features [33]. To create a 3D model of the given elevation data, there are some processing steps which are described in the next subsections.
4.2.1 Coordinate Systems There are many common coordinate systems which can be used to georeference 3D models. In this work two different system are used for creating the models, get data from webservices and create the connections between 3D and 2D map. World Geodetic System of 1984 (WGS84). WGS84 is a geodetic datum, which describes a set of constants for calculating coordinates of points on the earth. This system is the reference system for GPS positioning information. For this reason it is the most widely used global reference system. The position is described in degrees, minutes and seconds for longitude (east-west position) and latitude (north-south position) [34]. How the world is divided into degrees can be seen on figure 4.1. Universal Transverse Mercator (UTM). In contrast with WGS84 the UTM system is a plane, rectangular coordinate system. It covers the area from 84 degrees north to 80 degrees south and divides it into 60 zones, each with a size of 6 degrees longitude [35]. An example of the raster used for UTM can be found on figure 4.2. In prototype developed for this work, UTM is used as the reference system, because the elevation data in processed in this way. But due to the reason that other data is referenced in WGS84 coordinates, a conversion between them is necessary. The steps which have to be done to translate WGS84 to
21
4 Implementation UTM and vice versa is shown by Rino Ciancaglini [36]. When converting WGS84 longitude/latitude coordinates to UTM the first step is to calculate the zone of the location, which is divided in a longitude and a latitude part (e. g. 33N). The final step is the calculation of the northing and easting values, which provide the location within the zone borders.
Figure 4.1: WGS84 coordinate system [34]
Figure 4.2: UTM raster for Europe [37]
4.2.2 Parsing and Downsampling of Elevation Data The edge coordinates of the provided map of Schladming-Rohrmoos are located in zone 33 of the UTM system. So the data of this area is needed to create the 3D model of the landscape. The data which is made available by GIS-Steiermark has a resolution of one data point per meter and can be downloaded as in HGT format. The HGT format includes binary encoded elevation data of a specified area. To convert the data into a plain text file, the tool 3DEM can be used. For doing the conversion the HGT-File has to be imported into 3DEM. Then the topology of the area is visualised. Then the visualisation can be exported into a plain text elevation data file. In addition a HDR metadata file is generated which includes the coordinate system (which is UTM in this case), the coordinates of the map corners, the number of rows and columns and some more information. Due to the fact that the TXT file only
22
4.2 Textured Digital Elevation Model contains height values, a parser is written to convert the data into a XYZ point cloud. For each point which is processed, the parser determines if the point is inside the bounds of the paper map. The coordinates of the map corners can be found in table 4.2. To test if a point is inside the bounds, checks are performed if the coordinates are on the correct side of every edge. The check function uses the following formula which takes advantage of vector cross products where v1 is the vector from corner c1 to corner c2 , vi the corner from c1 to a point inside the map bounds and vt the vector from c1 to the point to test [38]. v~1 × ~vi ∗ v~1 × ~ vt ≥ 0 (4.1) If the condition returns true for each edge, the point is inside our region of interest. The resulting xyz file has about 350000 data points, which is too detailed for a mobile app. To get a proper resolution, some data points are removed. This results in a file with about 30000 points, which is a shrinkage of over 90%. Corner Top Left Top Right Bottom Left Bottom Right
Easting 412367 392928 412613 393229
Northing 5234801 5235122 5251347 5251668
Table 4.2: Paper map corner coordinates (UTM)
4.2.3 3D Modelling At this point the data is processed in a way to easily generate a 3D model out of the xyz file. As a first step the tool MeshLab is used to create the mesh. After replacing the ending of the xyz file by .asc, it can be imported into the tool. The given xyz data is not organised, which means that there is no indication of which side is the outside of the surface. Therefore normals have to be calculated to get a first approximation of the surface [39]. This
23
4 Implementation calculation can be done with MeshLab (Filters -¿ Normals, Curvatures and Orientation -¿ Compute normals for point sets). The next step is the reconstruction of the surface based on the estimation calculated in the step before. The algorithm used in this work is the ballpivot [40], which delivers good results in this case. No manual calculations have to be done, because ball-pivot is a built-in algorithm in MeshLab. After this step the raw digital elevation model can be exported as a Collada file and is ready for usage in a 3D scene.
4.2.4 Texturing To create a more realistic model of the landscape the mesh has to be textured. This is done with orthographic images (orthophotos) of the region, which can be obtained from GIS-Steiermark. The WGS84 coordinates of the are delivered with the images, so they can be cut to fit the region of the paper map. Now the bounds of the images correlate with the model bounds, but there is an inconsistency in the rotation, because of the different reference coordinates systems of images and elevation data. To correct them the rotation of the images to the model has to be measured. The tool QGIS can provide this information. Two raster layers have to be created, the first one with the coordinates of the model and the second one with the image coordinates. In QGIS there is a function to manually measure angles between two shapes. This leads to a value of 1.2118 degrees. The texturing itself is done with 3DS Max, a tool for 3D modelling. The next step to perform this task is to import the created Collada file. The imported model now has to be linked with the orthographic images, this is done with an UV map. [41, Chapter 3] Before the linking can be done, the scaling, rotation and offset of the texture has to be set. For the rotation the 1.217 degrees, which has been measured in the last step, can be used. The scaling values are needed, because of the different sizes of the texture and the model in the internal coordinate system of 3DS Max. Following formula is used for calculation:
24
4.3 Augmented Reality Scene
Figure 4.3: QGIS measurement of map rotation
scalex =
widthimg heightimg , scaley = widthmodel heightmodel
(4.2)
After the texturing is done the model can be exported to use it in the augmented reality scene, which is described in the next section.
4.3 Augmented Reality Scene The AR scene in this project is implemented with Unity 3D, which is a powerful game engine like mentioned in section 4.1. The advantage of this tool is the wide range of build-in functions and the easy integrability of Qualcomm Vuforia. To provide a complete AR scene, there are only a few game object which have to be added. One necessary object is the image target, which is a predefined asset included in Vuforia. This object can hold an image and
25
4 Implementation raises events if the defined image is found or lost on the camera view. Some scripts are created to handle those events and show or hide the objects in the AR scene. In this project all general purpose scripts like static data storages or scripts for showing the menu are attached to this game object, because this object is supposed to be active during the whole application life cycle. Only scripts of active objects are executed automatically [42]. The second mandatory game object for AR scenes out of the Vuforia package is the AR camera. This object replaces the default camera and handles the image tracking. To create a natural look of the landscape a directional light is used to illuminate the scene. This kind of light acts like the sun which means that it radiates in parallel lines in the given direction [43]. The last game object which has to be included is the 3d model itself. It is added as a child of the image target, because if the target gets tracked all children are shown and the other way round. There are also some UI elements which are drawn on the screen. In the basic view four buttons on the left side of the screen are implemented to interact with the application. At first there is a button to switch between AR and VR mode. The process of the switching is explained in section 4.5. The three remaining buttons enable or disable the layers 3D (show/hide 3D model), weather and GPS tracks. To build a generic solutions which easily allows to add extensions which are triggered on button clicks the design pattern Observer [44] is implemented. A subject class contains properties with the boolean values indicating the current state of the layers. Observer classes are able to register to these events and get notified if a value changes. If a new action should be performed on button click, only a new observer class has to be created which executes the functions. The functionality to disable the 3D model is an important feature to get a short overview of the data point locations. This is especially important for the GPS track layer where the exact positions has to be known. This information is hardly available on the 3d mesh.
26
4.3 Augmented Reality Scene
Figure 4.4: Explanation of model offset
4.3.1 Calculation of Coordinates The placement of the directional light in (0,0) is very easy, because if the lighting properties are set properly small deviations do not affect the result in a noticeable way. In contrast the calculation of the image target and 3d model coordinates is slightly more complicated. The left upper corner of the map has to be at (0,0) because the whole AR scene is aligned to this point. Moving a model without any rotation into the coordinate origin is easy because the x and y movement is just the half side length of the model. But the model in this case is rotated by 1.12 degrees, so some angle calculations have to be done. Figure 4.4 explains the setup and it shows why the scene would be inaccurate without the calculations. To get the correct movement following steps have to be performed: y β = cotan( ) (4.3) x First of all the β angle must be calculated because we do have a rectangle
27
4 Implementation rather than a square where the angle would be 45 degrees. p x 2 ∗ y2 r= 2
(4.4)
x 0 = r ∗ cos(α + β)
(4.5)
y0 = r ∗ sin(α + β)
(4.6)
After these calculations the movement can be obtained by A0 = ( x 0 |y0 ).
4.4 Implementation of Online Services The feature which provides the most information to the users is the integration of several online services. Like explained in section 3.1 there are many different kinds of services which can be included. To show the abilities of this feature, two of them are included in the current version of the prototype. First of all an additional layer with weather information is added which can be enabled or disabled. The second one is the integration of GPS tracks. This layer is only a stub for a later integration of real online data. The details of the implementation are provided in the section of this service. As mentioned in the previous section the GUI is based on an Observer [44] model. This makes it easy to extend UI actions by only registering new handlers to them. A big problem when developing for mobile devices is the unstable network connection. In the specific case of this thesis this problem becomes even more serious because network interruptions occur more often in mountainous regions like Schladming. For this reason extended error handling has to be done to prevent crashes. An important aspect of modern mobile applications is a good interaction performance. If this point is not considered in development users do not come back and use this app because competition might be only a few clicks away.[45] This means that the interface should not get stuck after triggering a time consuming action. Network interaction can be a very time consuming
28
4.4 Implementation of Online Services action, especially when there is a slow network connection like it can occur in Schladming. To load the data from the providing servers a concurrent approach is used. Networking actions are started in a separate task which runs outside the GUI task. The data is not shown until the whole loading process is done.
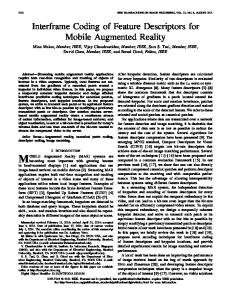
4.4.1 Weather layer An important service for hikers is gathering the current weather data in the hiking area. With this information users can decide early if the weather is good enough to start their trip. This feature is implemented by adding an additional layer with the data provided by the forecast.io API. This provider aggregates data gather from different weather source around the world. Moreover forecast.io [46] is able to do forecasts for specific locations. Several other weather services like ZAMG were tried but they deliver the same data for the whole area of Schladming. forecast.io is able to provide different data for different location because they interpolate between their data points. This is necessary because more than one distributed weather point should be displayed on the layer. In order to provide evenly distributed locations three popular places were chosen - Schladming, Eschachalm and Riesachfall. Weather icons are shown at these three positions some pixels beyond the 3D model. The icon appearance changes depending on the incoming data and can show sunny, rainy, snowy and cloudy weather. When touching the weather icons a windows appears and displays the current weather situation at the given location. This includes temperature, precipitation and cloudage. If someone is interested in a forecast there is a link to forecast.io where future data can be obtained. An example of the weather layer is provided in figure 4.5
29
4 Implementation
Figure 4.5: Screenshot of the weather layer
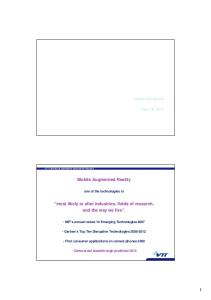
4.4.2 Tracks layer The second service which is implemented in this version of the prototype is an additional layer with hiking tracks. This is mostly important for people which do not know the region very well, so they can get suggestions for their trips. As mentioned in previous chapters this feature is not implemented in its final version. The current implementation does use static data included in the app rather than remote data to show the tracks. By now there are only nine sample tracks stored in the app data which have been selected by Schladming-Dachstein Tourism Marketing. The meta data like track distance and time to complete are stored directly in the code. But the GPS data for each track (waypoints) is stored in KML files which are included in the app. An overview of the KML file format can be found in the article of Song et al [47]. At application start-up the files are parsed and the 3D paths are generated. A reimplementation with real remote data is already considered, so the KML parser is able to process two different types of waypoints. On the one hand the waypoint can hold an explicit height level in meters. This data is converted into the AR scenes coordinate system. On the other hand the KML file could contain waypoints without a given height level which should be clamped to ground. To show them at the correct height in the scene a ray is sent onto the 3D model to get the height level at the given location. The waypoint is then displayed a small offset above the 3D model.
30
4.4 Implementation of Online Services
Figure 4.6: Screenshot of the hiking tracks layer
A very challenging part with Unity3D is the creation of clickable paths because there is no built in game object to represent such elements. To get a clickable path in the AR scene the track consists of cubes which are stretched and rotation to fit the directions of the way. The tracks are classified into three categories - easy, medium and heavy tracks. Each category can be enabled and disabled in an expandable GUI menu. To keep performance high there are two optimisation which are done during the loading process. Firstly the number of waypoints in a track is limited to 100 points. If there are more points included in the KML file, points are skipped to meet the limit. The other optimisation is static batching, which is done during the creation of the game objects. Static batching means that game objects with the same texture can be treated as one object. Due to the reason that all cubes in a track have the same texture they can be combined to one. This reduces the number of drawing calls per cycle from about 100 to one. An extended performance evaluation is done in section 5.1.2. Like on the weather layer the tracks implement an event handler for touch interaction. When clicking them a detail window is displayed and shows detailed information about the selected track. The information includes the name of the track, the stored meta information and a button which links to more details on the website of Schladming. An example of the tracks layer can be found on figure 4.6.
31
4 Implementation
4.5 Virtual Reality Interface A very important point for mobile application is the availability everytime and everywhere. This issue cannot be solved with only providing an AR interface. Therefore a VR interface is included which has the same abilities as the AR scene. In the GUI a button is display to switch between the two interfaces. After switching additional elements are displayed in the upper right area of the screen. There are buttons for moving, zooming, tilting and resetting the view. But this interface also provides touch gestures for interaction. The gestures are selected with as less as possible fingers needed, because the more fingers are used the more inaccurate it gets. [48] A list of supported touch gestures is shown in table 4.3. Interaction Type Pan Zoom Tilt
Gesture One-finger moving Two-finger pinching Two-finger dragging (up & down)
Table 4.3: Supported touch gestures
The moving speed correlates with the current camera position. This means that the moving speed increases with the distance between camera and 3D model. distance f actor = zc /zd (4.7) xm = δx ∗ speed f actor ∗ distance f actor
(4.8)
ym = δy ∗ speed f actor ∗ distance f actor
(4.9)
zc is the current z location of the camera and zd is the default location, which leads to a moving speedup at higher distances. The speedfactor is set to 6 because it gives the most natural feeling with this value.
32
4.6 Remote Logging The second gesture - zooming - is implemented by only changing the z position of the VR camera. For tilting, which is the third gesture, the VR camera is rotated around the x axis.
4.6 Remote Logging An important aspect in app development is an evaluation of the feature usage. There are a few key question which have to be answered to get a meaningful result. • • • •
How often are the features being used? In which context are the features being used? How long are the features being used? In which way are the features being used?
Understanding these results helps to improve future versions of the app in a reasonable way. If interpreted right this data can help to focus on the most popular features and improve them for a better app experience. [49] The necessary information cannot be obtained during development or when evaluating the app with a few users. Therefore a logging system has to be implemented to get the usage data of productive users. There are some remote logging providers which can be used for free. In this prototype Google Analytics is used, because it provides an easy to access API and there are already finished solutions for an integration into Unity3D. To meet the requirements of an outdoor application an offline cache for logging is implemented. If there is no network connection present, the logs are saved in a temporary cache file on the device. On the next startup the app loops over the logs and tries to resend them. If there is no present network connection too, the logs stay in the cache file.
4.6.1 Tracked Data The Google Analytics API consists of a HTTP service where the data has to be passed in the request parameters. At every application start a unique
33
4 Implementation identifier is generated. This identifier is used to relate each event to the same application cycle. Due to the reason that the identifier is generated at every startup there is no way to reconstruct the user which uses the application. Therefore no privacy issues can occur. For storing the identifier the screen name is used, a predefined parameter which is not used otherwise in our application. It is used for purposes other than intended, but this way there was no need to define a custom parameter and rewrite the API class. Google Analytics provides three different event parameters which are taken to store the event data - event category, event action and event label. Table 4.4 shows the usage of the three parameters. A small example can explain the data in detail: A person uses the app in a session with id 1234 and has the ”vr” mode turned on. Now the weather button is clicked which enables the weather layer. This triggers the remote logging. In this example the screen name gets the value 1234, event category is vr because this mode is used at the moment. The parameter event action gets the value ”weather” because this action is triggered and the event label is ”on” due to enabling the layer. Parameter name Screen name Event category Event action Event label
Stored data Session identifier current mode (AR/VR) performed action action parameter
Table 4.4: Google analytics event data
4.6.2 Reports The most important task to interpret the logged data in the right way is creating useful reports. Google Analytics makes it very easy to create custom reports which are structured in a meaningful way. To interpret the data for each feature separately four different reports are created - camera behaviour, weather behaviour, track behaviour and 3D
34
4.6 Remote Logging
Figure 4.7: Screenshot of a custom Google Analytics report
Figure 4.8: Screenshot of the Google Analytics world view
behaviour. Each report shows the total time in the specified mode, the average time and the number of events. The reports are divided in a general view and a view per session, where the detailed sessions are shown. An example of the provided data in report can be found on figure 4.7. Another big advantage of Google Analytics is the country view. This view shows the number of logged events per country, which can be seen on figure 4.8. This can be very interesting for the Schladming-Dachstein Tourism Marketing, because it shows where people are interested in the region.
35
5 Results In general results regarding the performance of the application can be found in this chapter. Optimizations are examined for their effectivity and some information is given about the execution performance on an example mobile device. Additionally this chapter gives details of the resulting application like needed memory, disk space and other system requirements. Instead of a user study to evaluate the usability of the app, the prototype was sent to usability experts at the University of Oulu. The feedback can be found in this chapter. In a project like this, which aggregates some different technical areas, challenges and difficulties can occur. The most important of them are also listed in section 5.3.
5.1 Performance The performance of an application is very important for a good impression after starting it the first time. An aim for such applications should be to provide a performance of more than 30 frames per second (FPS) at each time. According to Janzen and Teather [50] the interaction performance drops significantly at a framerate below 30. This is currently not reached in this version of the app as shown in the next sections. But it should be possible to optimize it to meet this target on state-of-the-art devices. A big performance boost can be get if loading the 3D mesh asynchronously. This means that it is not loaded at startup, but at in a second thread when
37
5 Results the application is already running. With this change the loading time of the app can be improved dramatically. The performance measurement is done by calculating the current and the average framerate since startup. The measurements are performed on a Samsung Galaxy Note 10.1 2012 device which provides a native resolution of 2560x1600.
5.1.1 Comparison Lowpoly/Highpoly Meshes The two different meshes in this measurements have the same shape, but the file sizes are different because of a higher polygon count within the first mesh. The reduced polygons lead to a dramatically improved performance which can be seen in table 5.1. But this is not the only advantage of reducing the model details. The application startup is much faster because the file size is also decreased by the difference of lowpoly and highpoly mesh. Displayed mesh Lowpoly mesh Highpoly mesh
Mesh filesize Average FPS 5MB 16.3 FPS 24MB 10.9 FPS
Table 5.1: Lowpoly performance
5.1.2 Static batching Static batching merges multiple 3D elements to act like one game object. The only limitation is that the elements must have the same texture. This feature reduces the number of drawing calls and increases the performance if there are many similar game objects in the 3D scene. In the scene of this application the parts of the hiking tracks can be batched because they all have the same color and can be treated as one object. This reduces the number of drawing calls per track from about 200 to exactly one. Due to the lack of a real remote track service there are only nine tracks
38
5.2 Expert Evaluation which are manually defined. The performance gain is not very high due to the limited number of tracks. But if it is reimplemented with remote data this optimisation can have a noticeable effect on the scene. Batching Drawing calls Average FPS Active 10 12.9 FPS Inactive 1000 12.5 FPS Table 5.2: Batching performance
5.2 Expert Evaluation Although an extended user evaluation is not done within this work some experts tested the app for usability errors. According to them there are some issues which are listed in this chapter. The first issues is that the hiking tracks are drawn as a collection of stretched cubes rather than a continuous path. This leads to a confusing view if moving closer to the paper map. Another big problem with the application is the slow loading time. A splash screen is recommended to provide a nicer view than the default Unity 3D icon on black ground while waiting. But the loading time could also be reduced with loading the 3D model asynchronously. One the one hand this reduces the startup duration of the application but on the other hand the user has to wait a few seconds after startup until the model has been loaded. A third issues which is mentioned in the evaluation feedback is the visibility of the GUI elements. It is stated that the buttons are not enough brought out because of the semi-transparent color. Especially in outdoor scenarios the buttons could be invisible for users.
39
5 Results
5.3 Challenges Due to the interdisciplinarity of the project there are some challenges which occurred while working on the application. The first, but also very big, challenge is the research for suitable landscape data, orthographic images and online services for the region. In the best case they are georeferenced to use them without any modifications and the application. But high-resolution data are very expensive in some regions, so public data sources with mostly lower resolutions have to be used. The next challenge is related to the previously mentioned one. The data sources might be georeferenced, but there can be differences in the used coordinate system. For this reason converters should be used, but in some cases the conversion is not a trivial task. An important target which is not always easy to meet is a high usability. The main problem in this case is that the app should also be used in outdoor scenarios, so the contrast should also be high enough. Moreover the UI elements should be big enough and easy to use for hiking trips. The last big challenge in this work is the performance optimization. Augmented Reality needs a lot of resources, the 3D model need them too. Moreover a set of online services should be included. The task is to optimize it to get a sufficient performance on midrange mobile devices. Many considerations have to be done regarding detail level of the 3D model, usage of Unity 3D built-in optimisation features and data loading performance.
40
6 Conclusion and Further Work The main target of this work is to develop an app which provides additional information to paper maps. The application should be used to evaluate augmented reality in a real world environment. However, the evaluation itself is not part of the scope covered in this work. The developed app is intended to be used in outdoor scenarios. This fact implies that there should be no usability issues and the UI elements should be highly visible. The integration of different online services is done with UI layers which can be enabled separately. This is a good approach concerning failure tolerance because the layers are independent from each other. To get an overview of the app usage after release a remote logging system is implemented, which tracks every feature activity. In case of a missing network connection the events are saved in an offline cache and they are resent at the next application start. The application developed in this work is only a prototype which should give a preview of the capabilities such an application can provide. Due to that reason there are some potential improvements and enhancements which can be implemented. First of all usability of the app is not evaluated properly. Therefore some issues and inconsistencies in the work flow can appear testing by people independent from software development. This is the most important work which should be done prior to release, because usability problems are likely to prevent users from using the app a second time. In the current version of the app there are only two sample services included, the current weather and hiking tracks of the region. It should be mentioned
41
6 Conclusion and Further Work that the hiking tracks service is not implemented in its final form, because the data is included statically in the application rather than be loaded from the web. The next step would be to load the tracks from the official site of Schladming-Dachstein Tourism Marketing. This ensures a measure of actuality for the provided data in the app. Another topic which should be thought of before releasing the app is doing some performance optimisation. At the moment the application is running stable and works on many mobile devices. But the app startup takes at least 30 seconds and the AR scene runs with at most 20 frames per second on a high end tablet. For a good user experience the performance is not good enough at the moment. The aim of a released version of this app should be to help hikers during their outdoor activities. To meet this target some more information has to be included. Helpful extensions can be found in section 3.1, where possible features are figured out.
42
Bibliography [1] Tobias Langlotz, Jens Grubert, and Raphael Grasset. “Augmented Reality Browsers: Essential Products or Only Gadgets?” In: Commun. ACM 56.11 (Nov. 2013), pp. 34–36 (cit. on p. 1). [2] O.I. Heimo et al. “Augmented reality - Towards an ethical fantasy?” In: Ethics in Science, Technology and Engineering, 2014 IEEE International Symposium on. May 2014, pp. 1–7 (cit. on p. 1). [3] Lee Yik Sheng. “Modelling learning from Ingress (Google’s augmented reality social game).” In: Educational Media (ICEM), 2013 IEEE 63rd Annual Conference International Council for. Oct. 2013, pp. 1–8 (cit. on pp. 1, 5). [4] Jens Grubert et al. “The utility of Magic Lens interfaces on handheld devices for touristic map navigation.” In: Pervasive and Mobile Computing 18 (2015), pp. 88–103 (cit. on p. 2). [5] A.A. Bagherzadeh et al. “A Multi-Agent Architecture for Tracking User Interactions in Browser-based Games.” In: Digital Game and Intelligent Toy Enhanced Learning (DIGITEL), 2012 IEEE Fourth International Conference on. Mar. 2012, pp. 105–107 (cit. on p. 2). [6] Unity 3D. Unity 3D. 2014. url: http://unity3d.com/ (cit. on p. 3). [7] Bob McKay. Tablet & Smartphone Resolutions and Screen Sizes. 2014. url: http://bobmckay.com/web/tablet-smartphone-resolutionsscreen-sizes (cit. on p. 3). [8] R. Grasset et al. “Image-driven view management for augmented reality browsers.” In: Mixed and Augmented Reality (ISMAR), 2012 IEEE International Symposium on. Nov. 2012, pp. 177–186 (cit. on p. 5).
43
Bibliography [9] B. Parhizkar et al. “Android mobile augmented reality application based on different learning theories for primary school children.” In: Multimedia Computing and Systems (ICMCS), 2012 International Conference on. May 2012, pp. 404–408 (cit. on p. 5). [10] Bill Lindmeier. Tunnel Vision. Dec. 2014. url: http://www.tunnelvisionapp. com/ (cit. on p. 6). [11] C. Adithya et al. “Augmented reality approach for paper map visualization.” In: Communication and Computational Intelligence (INCOCCI), 2010 International Conference on. Dec. 2010, pp. 352–356 (cit. on p. 6). [12] Ann Morrison et al. “Like Bees Around the Hive: A Comparative Study of a Mobile Augmented Reality Map.” In: Proceedings of the SIGCHI Conference on Human Factors in Computing Systems. CHI ’09. Boston, MA, USA: ACM, 2009, pp. 1889–1898 (cit. on pp. 6, 8). [13] M. Stroila et al. “Augmented transit maps.” In: Applications of Computer Vision (WACV), 2011 IEEE Workshop on. Jan. 2011, pp. 485–490 (cit. on p. 6). [14] Mark Lochrie et al. “Designing Seamless Mobile Augmented Reality Location Based Game Interfaces.” In: Proceedings of International Conference on Advances in Mobile Computing & Multimedia. MoMM ’13. Vienna, Austria: ACM, 2013, 412:412–412:415 (cit. on p. 6). [15] Jens Grubert, Rapha¨el Grasset, and Gerhard Reitmayr. “Exploring the Design of Hybrid Interfaces for Augmented Posters in Public Spaces.” In: Proceedings of the 7th Nordic Conference on Human-Computer Interaction: Making Sense Through Design. NordiCHI ’12. Copenhagen, Denmark: ACM, 2012, pp. 238–246 (cit. on p. 7). [16] Jens Grubert et al. “Playing It Real: Magic Lens and Static Peephole Interfaces for Games in a Public Space.” In: Proceedings of the 14th International Conference on Human-computer Interaction with Mobile Devices and Services. MobileHCI ’12. San Francisco, California, USA: ACM, 2012, pp. 231–240 (cit. on p. 7). [17] Play.google.com. alpenvereinaktiv.com. 2014. url: https://play.google. com/store/apps/details?id=de.alpstein.alpregio.AlpenvereinAktiv (cit. on p. 8).
44
Bibliography [18] Play.google.com. Maverick Pro. 2014. url: https://play.google.com/ store/apps/details?id=com.codesector.maverick.full (cit. on p. 8). ¨ [19] Play.google.com. Wanderkarte Osterreich. 2014. url: https : / / play . google.com/store/apps/details?id=sk.tekel.tmat (cit. on p. 8). [20] Play.google.com. AlpineQuest GPS Hiking. 2014. url: https://play. google.com/store/apps/details?id=psyberia.alpinequest.full (cit. on p. 8). [21] Play.google.com. Outdoor und Wander- Navigation. 2014. url: https:// play.google.com/store/apps/details?id=wmdev.apps.navBrowser (cit. on p. 8). [22] Artoolworks.com. ARToolworks. 2014. url: http://www.artoolworks. com/ (cit. on p. 10). [23] GitHub. DroidAR. 2014. url: https://github.com/bitstars/droidar (cit. on p. 10). [24] Metaio. Metaio SDK. 2015. url: http://www.metaio.com/products/ sdk/ (cit. on p. 10). [25] Qualcomm. Qualcomm Vuforia. 2014. url: https://www.qualcomm. com/products/vuforia (cit. on p. 10). [26] Total Immersion. Total Immersion AR Engine. 2015. url: http://www.timmersion.com/products/dfusion-suite (cit. on p. 10). [27] Wikitude. Wikitude. 2014. url: http://www.wikitude.com/ (cit. on p. 10). [28] R. Klein, G. Liebich, and W. Strasser. “Mesh reduction with error control.” In: Visualization ’96. Proceedings. Oct. 1996, pp. 311–318 (cit. on p. 13). [29] J. Petersen, D. Sack, and R. Gabler. Fundamentals of Physical Geography. Cengage Learning, 2010 (cit. on p. 13). [30] Wendy Yee. “Potential Limitations of Multi-touch Gesture Vocabulary: Differentiation, Adoption, Fatigue.” English. In: Human-Computer Interaction. Novel Interaction Methods and Techniques. Ed. by JulieA. Jacko. Vol. 5611. Lecture Notes in Computer Science. Springer Berlin Heidelberg, 2009, pp. 291–300 (cit. on p. 15).
45
Bibliography [31] Andrew Bragdon et al. “Experimental Analysis of Touch-screen Gesture Designs in Mobile Environments.” In: Proceedings of the SIGCHI Conference on Human Factors in Computing Systems. CHI ’11. Vancouver, BC, Canada: ACM, 2011, pp. 403–412 (cit. on p. 16). [32] Richard Horne. 3DEM. 2014. url: http://freegeographytools.com/ 2009 / 3dem - website - is - gone - but - 3dem - still - available - here (cit. on p. 20). [33] D. Schobesberger and T. Patterson. “Evaluating the effectiveness of 2D vs. 3D Trailhead Maps.” In: Proceedings of the 6th ICA Mountain Cartography Workshop. ETH Zurich, Mar. 2008, pp. 201–205 (cit. on ¨ p. 21). [34] J. Bossler and R. Snay. Manual of Geospatial Science and Technology, Second Edition. CRC Press, Mar. 2010 (cit. on pp. 21, 22). [35] T. G. Grubb and W. L. Eakle. Recording wildlife locations with the Universal Transverse Mercator (UTM) grid system. U.S. Department of Agriculture, Forest Service, Rocky Mountain Forest and Range Experiment Station, 1988 (cit. on p. 21). [36] Rino Ciancaglini. “CO-ORDINATES CONVERSION: FROM WGS84 TO UTM AND VICEVERSA.” In: PROCEEDINGS OF THE 7TH WORLD CONGRESS ON INTELLIGENT SYSTEMS. 2000 (cit. on p. 22). [37] Map of Europe, showing the latitude and longitude zones. 2014. url: http: //upload.wikimedia.org/wikipedia/commons/9/9e/LA2- EuropeUTM-zones.png (cit. on p. 22). [38] A. J. Hanson. Visualizing Quaternions: Series in Interactive 3D Technology. Morgan Kaufman, 2006 (cit. on p. 23). [39] Chao Zheng and Hui Zhang. “Implicit Surface Reconstruction Based on Adaptive Clustering.” In: Computer-Aided Design and Computer Graphics (CAD/Graphics), 2011 12th International Conference on. Sept. 2011, pp. 509–515 (cit. on p. 23). [40] F. Bernardini et al. “The ball-pivoting algorithm for surface reconstruction.” In: Visualization and Computer Graphics, IEEE Transactions on 5.4 (Oct. 1999), pp. 349–359 (cit. on p. 24). [41] T. Mullen. Mastering Blender. Serious skills. Wiley, 2012 (cit. on p. 24).
46
Bibliography [42] J. W. Murray. Game Development for iOS with Unity3D. CRC Press, 2013 (cit. on p. 26). [43] Mike Geig. Unity Game Development in 24 Hours, Sams Teach Yourself. Sams Publishing, 2014 (cit. on p. 26). [44] Erich Gamma et al. Design Patterns: Elements of Reusable Object-oriented Software. Boston, MA, USA: Addison-Wesley Longman Publishing Co., Inc., 1995 (cit. on pp. 26, 28). [45] M. Panwar. “Application Performance Management Emerging Trends.” In: Cloud Ubiquitous Computing Emerging Technologies (CUBE), 2013 International Conference on. Nov. 2013, pp. 178–182 (cit. on p. 28). [46] forecast.io. 2014. url: http://forecast.io (cit. on p. 29). [47] Soonyong Song et al. “An application to generate keyhole markup language file format from GPS location data.” In: Consumer Electronics (ISCE 2014), The 18th IEEE International Symposium on. June 2014, pp. 1– 2 (cit. on p. 30). [48] Hao Lu¨ and Yang Li. “Gesture Coder: A Tool for Programming Multitouch Gestures by Demonstration.” In: Proceedings of the SIGCHI Conference on Human Factors in Computing Systems. CHI ’12. Austin, Texas, USA: ACM, 2012, pp. 2875–2884 (cit. on p. 32). [49] J. Hughes. iPhone & iPad Apps Marketing: Secrets to Selling Your iPhone and iPad Apps. Que Publishing, 2010 (cit. on p. 33). [50] Benjamin F. Janzen and Robert J. Teather. “Is 60 FPS Better Than 30?: The Impact of Frame Rate and Latency on Moving Target Selection.” In: CHI ’14 Extended Abstracts on Human Factors in Computing Systems. CHI EA ’14. Toronto, Ontario, Canada: ACM, 2014, pp. 1477–1482 (cit. on p. 37).
47