Ferrari et al. Malar J (2016) 15:27 DOI 10.1186/s12936-015-1074-8
Open Access
RESEARCH
A malaria risk map of Kinshasa, Democratic Republic of Congo Giovanfrancesco Ferrari1,2* , Henry M. Ntuku1,2,3, Sandro Schmidlin1,2, Eric Diboulo1,2, Antoinette K. Tshefu3 and Christian Lengeler1,2
Abstract Background: In Kinshasa, malaria remains a major public health problem but its spatial epidemiology has not been assessed for decades now. The city’s growth and transformation, as well as recent control measures, call for an update. To identify highly exposed communities and areas where control measures are less critically needed, detailed risk maps are required to target control and optimize resource allocation. Methods: In 2009 (end of the dry season) and 2011 (end of the rainy season), two cross-sectional surveys were conducted in Kinshasa to determine malaria prevalence, anaemia, history of fever, bed net ownership and use among children 6–59 months. Geo-referenced data for key parameters were mapped at the level of the health area (HA) by means of a geographic information system (GIS). Results: Among 7517 children aged 6–59 months from 33 health zones (HZs), 6661 (3319 in 2009 and 3342 in 2011) were tested for both malaria (by Rapid Diagnostic Tests) and anaemia, and 856 (845 in 2009 and 11 in 2011) were tested for anaemia only. Fifteen HZs were sampled in 2009, 25 in 2011, with seven HZs sampled in both surveys. Mean prevalence for malaria and anaemia was 6.4 % (5.6–7.4) and 65.1 % (63.7–66.6) in 2009, and 17.0 % (15.7–18.3) and 64.2 % (62.6–65.9) in 2011. In two HZs sampled in both surveys, malaria prevalence was 14.1 % and 26.8 % in Selembao (peri-urban), in the 2009 dry season and 2011 rainy season respectively, and it was 1.0 % and 0.8 % in Ngiri Ngiri (urban). History of fever during the preceding two weeks was 13.2 % (12.5–14.3) and 22.3 % (20.8–23.4) in 2009 and 2011. Household ownership of at least one insecticide-treated net (ITN) was 78.7 % (77.4–80.0) and 65.0 % (63.7–66.3) at both time points, while use was 57.7 % (56.0–59.9) and 45.0 % (43.6–46.8), respectively. Conclusions: This study presents the first malaria risk map of Kinshasa, a mega city of roughly 10 million inhabitants and located in a highly endemic malaria zone. Prevalence of malaria, anaemia and reported fever was lower in urban areas, whereas low coverage of ITN and sub-optimal net use were frequent in peri-urban areas. Keywords: Malaria, Anaemia, Mosquito nets, DRC, Democratic Republic of Congo, Kinshasa Background Malaria is the leading cause of morbidity and death in children under 5 years in the Democratic Republic of Congo (DRC), accounting for an estimated 40 % of outpatient visits and 40 % of overall mortality [1]. Malaria is also a major public health issue in the capital city Kinshasa; an issue that has been studied since colonial times [2]. After Cairo and Lagos, Kinshasa is Africa’s third *Correspondence: [email protected] 2 University of Basel, Basel, Switzerland Full list of author information is available at the end of the article
largest city, with an estimated population of more than 10 million [3]. In 1979–1980, the average malaria parasite rate in a representative sample of children was 33 % [2]. Around the same time, malaria admissions comprised 29.5 % of consultations in 1983, then 38.2 % in 1985–1986 [4]. In 1986–1987, the mean prevalence rate of malaria in six districts of Kinshasa was 50 %, with a higher prevalence in the peripheral districts [5]. This reflected the distribution pattern of the main vector Anopheles gambiae, which was less present in the city centre than in the periphery [6, 7]. The latest study in 2000 confirmed the general prevalence distribution pattern, with lower
prevalence in the city centre (parasite rate 4 %) than in peri-urban areas (46 %) [8]. A first insecticide-treated net (ITN) distribution campaign in 2007 achieved a 15.9 % rate of ITN ownership and a 12.6 % rate of use among children under five [9]. In 2008, the World Bank financed the acquisition and distribution of two million ITNs in Kinshasa through the PURUS project (Programme d’Urgence de Réhabilitation Urbaine et Sociale). The National Malaria Control Programme (NMCP), along with technical and logistic support from Population Services International (PSI), distributed two ITNs per household. Eight months after that distribution, the Kinshasa School of Public Health (KSPH) conducted a survey on basic malaria indicators to assess the impact of the intervention in 15 health zones (HZs) of the city. In 2011, the Swiss Tropical and Public Health Institute (Swiss TPH), in collaboration with the KSPH, conducted a second survey to evaluate the coverage and use of key malaria indicators, prevalence of malaria by Rapid Diagnostic Test (RDT), anaemia and fever in the 23 HZs excluded from the 2009 survey. Kinshasa has expanded very rapidly in the past 20 years, thus updating and consolidating these data was urgently required for general malaria control purposes and for planning specific further research projects. Using geo-referenced prevalence data, this study aimed to generate the first map of malaria risk among children 6–59 months in Greater Kinshasa, down to the lowest level of the health system in DRC, the health area (HA). These maps will enable researchers and implementers to identify HZs of high priority for malaria control in Kinshasa.
Methods Study area
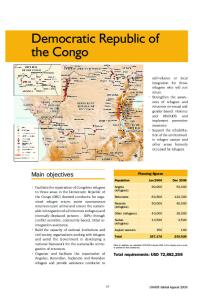
The study was conducted in Kinshasa, the capital of the DRC. The city is located along the southern bank of the Congo River, directly opposite the city of Brazzaville, capital of the Republic of the Congo. The climate is hot and humid (AW4 according to the Koppen classification), with a rainy season lasting from October to May [10]. Characterized in the north by the Pool Malebo and by a marshy area in the north-east along the river Congo, Kinshasa extends across a plain delimited to the south by hills with heights varying between 350 and 750 meters. The plain is crossed by three rivers (Ndjili, Nsele and Mai-Ndombe) and many smaller streams [11, 12]. The northern and central parts of the city include the old colonial neighbourhoods (ville), some of which represent the most industrialized and commercial areas. To the south lies the cité, consisting of more recent, large, residential districts. The land use pattern is heterogeneous, with densely populated areas separated by large semi-rural areas where urban agriculture is practiced.
Page 2 of 16
The most heavily inhabited area of Kinshasa covers 583 square km [13], of which 80 % is actually semi-rural. Administratively, Kinshasa has the status of a province, divided into four districts, which are further divided into 24 communes (municipalities). The organization of the health system differs from the administrative system and comprises six health districts, divided into 35 health zones (HZs). These represent the primary operational units of the health system in DRC. An HZ usually covers a population of 100,000–150,000 inhabitants in rural areas and 200,000–250,000 in urban centres. They include a general referral hospital, some health centres and a dozen lower-level health facilities. Each HZ is further divided into 15 health areas (HAs), on average, which represent the lowest level of the health system. Each HA is clearly delimited and defined by the Ministry of Health and usually includes a population of 10,000–15,000 inhabitants. In Kinshasa Province, the three most eastern HZs are completely rural in nature, while the remaining 32 HZs are semi-rural or urbanized [14]. The study area only consisted of the 32 non-rural HZs because of the practical issues involved in including the three eastern HZs. Details of the sampled HZs can be found in Table 1. Study design and sampling procedure
Two cross-sectional household surveys were conducted. The first survey was carried out at the end of the dry season between mid-September and end of October 2009 in 15 HZs, eight months after the first large ITN distribution campaign. The second survey was conducted at the end of the rainy season from mid-April to early June 2011 and covered 25 non-rural HZs. Seven HZs were sampled in both studies, including five HZs for which malaria prevalence was not measured in 2009 and two HZs for which prevalence was measured previously in 2009. The detailed list of HZs surveyed in 2009 and 2011 is presented in Table 1. For both surveys, a multi-stage cluster sampling design was adopted to select households for inclusion, using the HZ as a primary sampling stage and the HA as a secondary sampling stage. 2009 survey
Fifteen HZs were selected using a probability proportional to size (PPS) sampling method, so that more populated HZs had a higher probability of being selected. Of these 15 HZs, 10 were selected by simple random sampling for the determination of malaria by rapid diagnostic test (RDT). In the remaining five HZs, only haemoglobin (Hb) was measured and malaria preventive measures were investigated using a pre-tested, structured questionnaire. In each HZ, data collection took place in half of the HAs, selected again with PPS. In case of an odd number of HAs per HZ, (n + 1)/2 HAs were selected. In a third
Ferrari et al. Malar J (2016) 15:27
Page 3 of 16
Table 1 List of health zones in Greater Kinshasa surveyed in 2009 (KSPH/NMCP) and 2011 (KSPH/Swiss TPH) and corresponding populations Health zone
Environment
Population
Year survey
Bandalungwa
Urban
147.252
2011
Barumbu
Urban
115.780
2011
Binza Meteo
Urban
325.446
2009a/2011
Binza Ozone
Urban
317.731
2011
Biyela
Urban
174.232
2009a/2011
Bumbu
Urban
316.188
2009
Gombe
Urban
22.732
2011
Kalamu I
Urban
112.915
2011
Kalamu II
Urban
100.782
2011
Kasa-Vubu
Urban
102.856
2009
Kikimi
Urban
198.997
2011
Kimbanseke
Urban
217.772
2011
Kingabwa
Urban
162.323
2009
Kingasani
Urban
171.538
2011
Kinshasa
Urban
135.665
2011
Kintambo
Urban
81.026
2011
Kisenso
Urban–rural
335.265
2009
Kokolo
Urban
336.086
2009
Lemba
Urban
249.292
2009a/2011
Limete
Urban
145.331
Lingwala
Urban
66.595
2011
Makala
Urban
238.088
2011
Maluku I
Urban
149.040
Excluded
Maluku II
Rural
54.158
2009
Masina I
Urban
258.687
2011
Masina II
Urban
214.401
2009a/2011
Matete
Urban
223.248
2009
Mont Ngafula I
Urban–rural
196.810
2011
Mont Ngafula II
Urban–rural
111.921
2011
N’djili
Urban
249.310
2009
Ngaba
Urban
140.861
2011
Ngiri Ngirib
Urban
125.634
2009/2011
Nsele
Rural
387.486
Excluded
Police
Urban
93.910
Selembaob
Urban
269.498
2009a/2011
2011 2009/2011
a
Surveyed for malaria preventive indicators and prevalence of anaemia
b
Surveyed for malaria prevalence in both years and for all age groups in 2011
stage, a list of all streets with their approximate population number was obtained for each selected HA. Streets with fewer than 200 inhabitants were excluded and three streets were selected by simple random sampling. Households with at least one child aged 6–59 months were listed by community health workers (CHW) for each of the three streets. From this list, 25 eligible households were randomly selected, proportional to the size of each street. The target sample size of 325 children was
calculated based on an estimated prevalence of anaemia of 69.2 % in children aged 6–59 months. Assuming 1.3 children aged 6–59 months per household, a sample size of 260 households was set as the target per health zone [9].
2011 survey From mid-April to early June 2011, the remaining 23 HZs were sampled, including the five HZs for which malaria prevalence had not been measured in the 2009 survey. In all 23 HZs, a questionnaire was administered to households and malaria parasite prevalence and the Hb concentration were measured in children aged 6–59 months. Two additional HZs already investigated in 2009 were resampled in 2011 among children 6–59 months for both malaria and anaemia. To obtain the epidemiological age profile for all age groups in these latter HZs only, individuals older than five were also included. In all, 25 HZs were sampled in the 2011 survey. The primary outcome measure was documented malaria in study children, as measured by RDT. The sample size was calculated based on the prevalence estimate for 2009 survey (6.4 %) during the dry season, and increased to 10 % to take into account the seasonal variation. In each HZ, the aim was to measure children’s malaria with a precision of ±8 absolute percent. The sample size calculation indicated the need for 55 children in each HZ. With a design effect accounting for clustering of two, this number increased to 110. With an average 1.3 children under 5 years in households in Kinshasa, 87 households needed to be selected [9]. To account for losses in the study process, we aimed for 100 households in each of the 25 HZs. Hence, the total number of households sampled in Kinshasa in 2011 was 2500, including 3250 children aged 6–59 months. HA and household selection followed the same methodology applied in the 2009 survey (described above). An average of 25 households was set per HA. Data collection Household survey questionnaire
In 2009, survey data were collected using a paper-based questionnaire. In 2011, survey data were collected using smartphone technology. For the 2011 survey, a validated electronic semi-quantitative questionnaire was developed on an HTC smartphone running Google’s Android operating system. Eight teams of three field workers (one interviewer, one laboratory technician, one community liaison person) were trained in using the electronic questionnaire, in general interviewing skills and in administering informed consent during simulated interviews sessions. Each of the eight teams visited, on average, 25 households per day in each selected HA. The 2011 questionnaire was a simplified version of the one used
Ferrari et al. Malar J (2016) 15:27
in 2009, which was adapted from the standard Malaria Indicator Survey Household Questionnaire from the Roll Back Malaria Partnership. All questions retained from the 2009 survey form were kept as they were in 2011 to ensure comparability between both surveys. The questionnaire was developed in French with oral translation into Lingala (the second lingua franca in Kinshasa) and field tested prior to the survey. Prior to administering the questionnaire, a signed informed consent form was obtained from the head of the household or his/her representative. Participation was entirely voluntary. Respondents were asked about demographic information of usual residents, educational level, factors indicating the household’s socio-economic status, household construction material, presence and type of mosquito bed net (verified by direct observation), use of mosquito bed net and ITN in the night prior to the survey, history of fever (past 2 weeks), whether fever was present on the day of the survey and health seeking behaviour in case of a fever episode. During the 2011 survey, the coordinates (longitude and latitude) of all investigated households were recorded on-site using the integrated Global Positioning System (GPS) of the data collection devices. Households were revisited if no one was available for interview on the first attempt; if no one was available after two attempts, the interviewer continued to the next randomly selected household on the list until the desired number of households was obtained. Blood testing
For each selected participant who gave signed informed consent, the same laboratory procedures as in 2009 were adopted during the 2011 survey. They included measuring axillary temperature with a digital thermometer, collecting peripheral blood by standard finger prick to test for malaria parasites with an RDT for Plasmodium falciparum-specific histidine rich protein 2 (HRP2) and other Plasmodium species (Pan pLDH for Plasmodium vivax, Plasmodium malariae and Plasmodium ovale) (Paracheck pf in 2009 and SD Bioline Malaria Antigen P.f/Pan in 2011) and assessing Hb level using a blood haemoglobin photometer (HemoCue 201 plus, Ängelholm, Sweden). In two HZs in 2011, Selembao and Ngiri Ngiri, individuals of all ages (not only children) were surveyed. RDTs were used for on–site diagnosis of malaria and treatment with artesunate-amodiaquine, the official first-line malaria treatment at the time of the survey, was offered as needed. The HemoCue was validated by running a weekly high and low Hb liquid control (HemoCue–HemoTrol). Statistical analysis
To ensure consistency and integrity of data collected during the 2009 survey, all paper forms were rechecked
Page 4 of 16
by team supervisors in the field at the end of each day. Incomplete entries were sent back to be filled the next day. Questionnaires were first checked for completeness, and the information was manually coded and entered using EpiData and crosschecked using EpiInfo (v. 6.04). Statistical analyses were performed using SPSS software for Windows (version 16.0), NCSS, and STATA (version 10). Data collection devices used in the 2011 survey (HTC phones) were equipped with Open Data Kit (ODK) software (University of Washington and Google Foundation) to allow for data entry in the field. ODK programming also allowed for systematic range and consistency checks. Data in xml format were downloaded every evening from the HTC smartphones and then converted on the ODK Aggregate Server into tabular format (ODK aggregate). Statistical analyses were performed using Stata version 12.1 (Stata Corp, College Station, Tx, USA). Analysis and mapping for the 2011 survey were based on georeferenced prevalence data at the level of the HA. Since households could not be georeferenced in 2009, HA spatial coordinates were assigned to the HA’s mean malaria prevalence. Maps were produced using ArcGIS version 10.0 (Environmental Systems Research Institute Inc. Redlands, USA). A centroid for every HA was first generated (for 2009 the centroid was generated at the centre of the HZ, since GPS coordinates of the households were not collected). The standardized prevalence data were then assigned to the centroids of the surveyed health zone. The next step involved using the IDW interpolation to get prevalence estimates at un-surveyed HZs. Lastly, the interpolated prevalence estimates were extracted using the centroids (points data) of the HZs. These estimates were subsequently used to map out the prevalence at HZs level (polygons data). Boundaries (shape files) were initially available at the level of the HZ only, from the Health Monitoring Information System Unit of the Ministry of Health (MoH). By using images developed by the Japan International Cooperation Agency (JICA) and through collaborating with a team of experts from the Institut géographique du Congo (IGC), it was possible to develop shape files at the level of the HA. The most eastern rural HZs (Maluku I and II and Nsele) were excluded from the final map due to the great effort that drawing boundaries in remote HAs would have entailed. This was beyond the means and the scope of this study. Ethical consideration
For both surveys, ethical clearance was obtained from the Ethics Committee of the KSPH, at the University of Kinshasa. In addition, the 2011 survey received authorization from the ethical committees in Basel (Ethikkommission beider Basel, Basel-Stadt) as well as clearance
Ferrari et al. Malar J (2016) 15:27
Page 5 of 16
from Swiss TPH’s internal research commission. Signed informed consent to participate was obtained from parents or guardians on behalf of the enrolled children or by the adult participants themselves. Precautions to minimize the risk of secondary infection during blood collection were taken. All tested participants with a positive RDT but no evidence of severe illness were diagnosed as having uncomplicated malaria and given a voucher for treatment, free of charge, as per the DRC national malaria treatment policy (artesunate-amodiaquine or artemether-lumefantrine), at the nearest health facility. Drugs were provided to the relevant facilities one day before the household visits started in the area, to ensure drug availability for treatment. Participants diagnosed with severe anaemia and those with severe illnesses were excluded from the study and immediately referred to the nearest health facility for diagnosis and management, as recommended by national guidelines.
Results Characteristics of the study population
Household and individual characteristics of the study populations in 2009 and 2011 are shown in Table 2. A total of 3896 households distributed throughout 15 HZs were included in the 2009 survey, while 2,512 household in 25 HZs were sampled in 2011. The age distribution of individuals was similar between surveys, as were the proportions of men and women. Overall, 27,371 people were surveyed in 2009, including 12,761 men and 14,610 women. Of these, 47.1 % were under 15 years of age, while the percentage of children 6–59 months was
Table 2 Characteristics of study households and individuals in the 2009 and 2011 surveys, Kinshasa, Democratic Republic of Congo Survey 2009 Survey 2011 Household characteristics Number of households sampled
3896
Mean (SD) household size
2512
7.1
5.9 (2.1)
Number of persons in sampled households
27,371
15,005
Median Age years (90 % central range)
–
17
Individual characteristics
20 (4.2 %), 10–14 (1.4 %) and 6–59 months (0.0 %). In Selembao, malaria prevalence was highest among the groups aged 5–9 (34.2 %) and 15–19 (28.3 %) years, followed by those 6–59 months (26.2 %), 10–14 years (25.0 %) and over 20 years (17.6 %). All-ages malaria prevalence was 3.8 % (2.4–5.8) in Ngiri Ngiri and 23.8 % (20.4–27.6) in Selembao. To prepare the data for mapping, direct standardization was used to make prevalence rates of malaria comparable between surveys, accounting for the two different years and seasons. The standardization was done according to the following formula:
Ps =
Age groups
≥20 years (%)
24 %. In addition, 302 pregnant women also participated. The 2011 survey included 15,005 people; 6770 men and 8235 women. Of these, 44.7 % were under 15 years of age, while the percentage of children 6–59 months was 24.9 %.
0.9
p1 n1 p¯ 1
n1 + p2 n2 p¯ 2 n2 n1 + n2
where, Ps is the overall standardized prevalence for surveys 2009 and 2011, p1 is the prevalence rate in survey 1 (2009), p2 is the prevalence rate in survey 2 (2011), n1 is the number of study participants in survey 1, n2 is the number of study participants in survey 2, p¯ 1 is the overall prevalence rate for survey 1, p¯ 2 is the overall prevalence