A Fuzzy Regional-Based Approach for Detecting Cerebrospinal Fluid Regions in Presence of Multiple Sclerosis Lesions Francesc Xavier Aymerich1,2, Eduard Montseny2, Pilar Sobrevilla3, and Alex Rovira1 1
Unitat RM Vall Hebron (IDI). Hospital Vall Hebron, 08035 Barcelona, Spain {xavier.aymerich,alex.rovira}@idi-cat.org 2 ESAII Departament, Universitat Politècnica de Catalunya, 08034, Barcelona, Spain {xavier.aymerich,eduard.montseny}@upc.edu 3 MAII Departament, Universitat Politècnica de Catalunya, 08034, Barcelona, Spain
[email protected]
Abstract. Magnetic Resonance Imaging (MRI) is an important paraclinical tool for diagnosing and following-up of Multiple Sclerosis (MS). The detection of MS lesions in MRI may require complementary information to filter false detections. Given that MS lesions cannot be located within cerebrospinal fluid (CSF), detection of this region is very helpful for our purpose. Although T1-weighted images are usually chosen to detect CSF regions, the gray level similarity between some MS lesions and CSF regions difficult this task. With the aim of discriminating CSF region within intracranial region, but considering aforementioned drawback, we propose a fuzzy-based algorithm that involves the regional analysis of the fuzzy information obtained from a previous local analysis. The proposed algorithm introduces location, shape and size constraints in CSF detection, and provides confidence degrees associated with the possibility of including MS lesion pixels. Keywords: Magnetic resonance imaging, brain, multiple sclerosis, cerebrospinal fluid, fuzzy sets, regional analysis.
1 Introduction Multiple sclerosis (MS) is a disease of the central nervous system (CNS) characterized by the destruction of the myelin that encases the axons. This demyelinating process results in an inhibition of neural transmission and causes the appearance of several clinical symptoms, such as motor and sensory disturbances, paralysis or visual alterations [1]. The diagnosis and follow-up of this disease involves the use magnetic resonance imaging (MRI), which is recognized as the imaging method of choice for examination of CNS disorders [2]. In the study of MS, MRI also plays a relevant role as diagnostic criteria [3][4]. Among all the different weighted images that can be obtained by MRI, T1weighted images are the preferred choice for the analysis of the intracranial region. This is due to its high degree of anatomic information, and because they show good contrast between the parenchyma region and the cerebrospinal fluid (CSF) [5]. E. Hüllermeier, R. Kruse, and F. Hoffmann (Eds.): IPMU 2010, Part II, CCIS 81, pp. 552–561, 2010. © Springer-Verlag Berlin Heidelberg 2010
A Fuzzy Regional-Based Approach for Detecting Cerebrospinal Fluid Regions
553
Although several algorithms have been proposed for the analysis of the intracranial region in T1-weighted images, most of them are focused on segmentation considering healthy volunteers [6][7] or other pathologies [7][8]. Consequently, these methods do not take into account the problems that the presence of MS lesions can introduce in the segmentation process. In MS patients, the analysis of the intracranial region considering T1-weighted images is focused on tasks such as the measurement of brain volumes [9], the evaluation of black holes [10], and filtering false detections. Most of these tasks require the differentiation of the encephalic parenchyma in relation of its environment to achieve an accurate segmentation. In spin-echo or gradient-echo T1-weighted images, the similarity of gray-level values between CSF and MS hypointense lesions can introduce misclassifications of MS lesions as CSF instead of as parenchyma [11]. Recently we proposed an algorithm [12] for detecting CSF regions in presence of MS lesions considering a single T1-weighted scan. This algorithm carried out a local fuzzy analysis based on gray-level and texture features associated with CSF regions that allowed representing the intrinsic vagueness of the CSF features. However we observed the necessity of introducing a further analysis to take into consideration some location, shape and size constraints that the local analysis could not include. So, in this work we propose a regional fuzzy-based algorithm that allows taking into account aforementioned constraints. The use of fuzzy techniques will allow dealing with the vagueness of the CSF features, and will provide confidence degrees associated with the possibility that detections could correspond to MS lesions.
2 Definition of the CSF Regions We considered axial slices acquired in a Siemens 1.5T Magnetom Vision MR System (Erlangen, Germany) using a T1-weighted spin-echo sequence (TR/TE/NEX/FA 667ms/14ms/1/70°) to cover a field of view of 250 mm in each 3 mm slice. Based on the analysis of the anatomical structures of these images, in [12] we observed that CSF regions, such as the sulci or the ventricular regions, can be divided according to its width as follows: 1. Wide CSF regions (WFR): fluid regions whose width is equal to or greater than 5 pixels. 2. Narrow CSF regions (NFR): fluid regions whose width is lower than 5 pixels. Due to MS lesions contiguous to CSF may be difficult to differentiate from CSF regions, we also differentiated inner and peripheral wide and narrow CSF regions. These regions were described based on gray level and texture features as follows: 1.1 Inner Wide Fluid Region (IWFR): region whose pixels show dark gray level – dwgl- and homogeneous texture –ht-. 1.2 Peripheral Wide Fluid Region (PWFR): region whose pixels show medium-dark gray level –mdgl- and micro-grainy texture –mgt-. 2.1 Inner Narrow Fluid Region (INFR): region whose pixels show dark gray level – dngl- and very micro-grainy texture –vmgt-.
554
F.X. Aymerich et al.
(a)
(b)
(c)
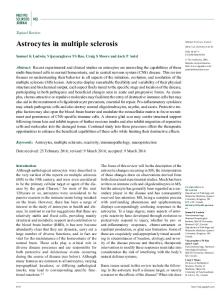
Fig. 1. Detail of the different CSF regions considered. (b) is the original image, (a) is a zoomed area that shows IWFR dark region surrounded by PWFR (solid white line), and (c) shows a zoomed area of the INFR dark regions surrounded by PNFR (solid white line).
2.2 Peripheral Narrow Fluid Region (PNFR): region whose pixels show mediumdark gray level –mdgl- and very micro-grainy texture –vmgt-. Figure 1 depicts the locations of the regions above described. Image (a) shows that PWFR surround IWFR, whereas having a look at image (c) it can be appreciated that pixels in narrow regions labeled as PNFR do not require the proximity of INFR.
3 Local Analysis within Intracranial Region Local analysis involved the study of perceptual features, gray level and texture, within intracranial region. This study required of two preprocessing tasks: Extraction of the intracranial region using a previously developed algorithm [13]; and normalization of the gray-level values to increase the gray-level uniformity among different slices. Given the vagueness associated with the considered perceptual features, the local analysis carried out in [12] was based on the definition of the fuzzy sets FIWFR, FPWFR, FINFR and FPNFR associated with the four regions introduced at previous section, which were obtained aggregating the antecedent fuzzy sets –Fdngl, Fdwgl, Fmdgl, Fvgt, Fgt and Fht- associated with the perceptual features dngl, dwgl, mdgl, vgt, gt and ht as follows: μIWFR(pij)= 0.7 μdwgl (pij)+ 0.3 μht(pij); μPWFR(pij)= 0.8 μmdgl(pij)+ 0.2 μgt(pij);
μPWFR(pij)= 0.8 μmdgl(pij)+ 0.2 μgt(pij) .
(1)
μPNFR(pij)=min(μmdgl(pij),μvgt(pij)) .
(2)
Where μdngl and μmdgl were obtained through the evaluation of the normalized gray levels; μdwgl by assigning the mean gray level of pixels inside a 3x3 raster window to the central pixel; and texture membership functions, μht, μvgt, and μgt, were obtained analyzing the differences among the gray levels of the central and surrounding pixels within square raster windows of size 3x3 for ht, 7x7 in the cases of vgt and gt.
4 Algorithm and Methodology As we are interested in detecting CSF region within images containing MS lesions, the proposed algorithm takes into account CSF regional constraints to improve the
A Fuzzy Regional-Based Approach for Detecting Cerebrospinal Fluid Regions
555
results obtained by previously described local analysis. So, regional analysis consisted of obtaining new membership functions related to the fuzzy sets FIWFR, FPWFR, FINFR and FPNFR by considering the regional constraints of the regions given in section 2. 4.1 Obtaining Improved IWFR Membership Function Analyzing the outcomes of local algorithm, it was appreciated that some IWFR pixels had low μIWFR values due to noise or image non-homogeneity. To avoid this problem it was considered that: “A pixel pij is IWFR if it is surrounded by pixels of IWFR, although there can be some very small neighboring regions that are not IWFR”. Given the characteristics of IWF regions, to implement previous property we considered four masks: A circular mask of 1.5 pixel radius, M1; a circular ring, M2, with radii 1.5 and 2.5 pixels; a circular ring, M3, with inner and outer radii 1.5 and 3.2 pixels, divided into four regions ( {M 3k }k =1 ), each having 7 pixels; and a circular 4
mask, M4, of 3.2 pixel radius divided into 4 inner regions ( {M 4k I }k =1 ), with 2 pixels 4
k each, and 4 outer regions ( {M 4O }k =1 ) that match the ones of previous mask. 4
Then, once mask Mk is centered on pixel pij, μM k ( pij ) is obtained aggregating the
membership values of the pixels covered by Mk using OWA operators [14] as follows: WM1 = (0,0,0,0,1,0,0,0) and WM2 = (0,0,0,0,0,0,0,0,0,1,0,0) are the weighting vectors applied for getting μM 1 ( pij ) and μM 2 ( pij ) respectively. -
Weighting vector WM k = (0,0,0,0,0,1,0) are the used for obtaining the member3
ship values μM k ( pij ) (1≤k≤4). Then, these values are aggregated by using 3
WM3 =(0,0,1,0) for obtaining μM 3 ( pij ) .
-
WM k = (0,1) and WM k = (0,0,0,0,0,1,0) are the weighting vectors applied for 4I
4O
getting μM k ( pij ) and μ M k ( pij ) . Then, for each k (1≤k≤4), we get μM k ( pij ) 4I
4O
4
using WM k = (0,1), and finally these values are aggregated by using WM4 = 4
(0,0,1,0) for obtaining μM 4 ( pij ) . Then, the improved fuzzy set FIWFR is given by the membership function: if μ IWFR ( pij ) > 0.75 ⎧ μ IWFR ( pij ) . ⎩ max( μ M 1 ( pij ), μ M 2 ( pij ), μ M 3 ( pij ), μ M 4 ( pij )) otherwise
η IWFR ( pij ) = ⎨
(3)
4.2 Obtaining Improved PWFR Membership Function
Regionally, a PWFR is a thin and closed region surrounding a IWF region. So, to improve the outcomes of local algorithm, we first considered the contiguity of PWFR and IWFR. To do it, for each pixel pij the membership values, μIWFR(pkl), of the pixels pkl covered by a circular mask of 2 pixel radius (M5), centered in pij, were aggregated using an OWA operator of weighting vector W5 = (0,1,0,0,0,0,0,0,0,0,0,0). In this way
556
F.X. Aymerich et al.
we obtained a new membership value μ M 5 ( pij ) , that was used for getting the improved PWFR membership function given by equation (4). The values of the parameters in this equation were obtained taking into account that a pixel of PWFR must show a high enough membership degree to FPWFR, and FIWFR in its neighborhood. Since a pixel of PWFR requires the presence of a minimum number of pixels belonging to IWFR in its near neighborhood showing high μIWFR value, we gave more relevance to the parameter associated with μ M 5 ( pij ) . Then, we obtained the values by heuristic analysis of the PWFR region at different locations. (An analogous process was applied for obtaining the parameters of next equations.) ⎧⎪0.15μ PWFR ( pij ) + 0.85μ M 5 ( pij ) ⎪⎩μ PWFR ( pij )
μ PFWR ( pij ) = ⎨
if μ PWFR ( pij ) > 0.4 otherwise
(4)
.
Analyzing the results of the local algorithm, it was observed that the values of μPWFR and μIWFR were too low for some pixels adjacent to IWFR. To overcome this drawback we applied a morphological dilation -δc1- to previous values using a circular structuring element of radius 1. Then, the improved membership function defining and δ cPWFR are the values obtained by FPWFR is given by equation (5), where δ cIWFR 1 1 applying δc1 on the values given by μIWFR and μPWFR, respectively. 1 ⎧ max( μ PWFR ( pij ), δ c1IWFR ( pij )) if δ c1IWFR ( pij ) > 0.5 . ⎪ 1 ηPFWR ( pij ) = ⎨ min(1 − η IWFR ( pij ), δ c1IWFR ( pij )) if {min(δ c1IWFR ( pij ), δ c1PWFR ( pij )) > 0.5 and μPWFR ( pij ) ≤ 0.5} ⎪μ 1 otherwise ⎩ PWFR ( pij )
(5)
4.3 Obtaining Improved INFR Membership Function
Because of pixels within Inner Narrow Fluid regions can not be connected with central locations of wide fluid regions, to improve the outcomes of local algorithm we considered that: “If pixel pij is INFR and is connected to any pixel that is PWFR or IWFR in a central location of the intracranial region, then pij is not INFR”. To implement the central location property, given the set Rcent that contains the 60% of more inner pixels within the intracranial region, we defined the membership function μWCR(pij) as equal to the maximum of ηIWFR(pij) and ηPWFR(pij) for all the pixels of Rcent, and equal to zero otherwise. For implementing the connectivity we considered the binary image IB such that IB(i,j)=1 if max(μWCR(pij), μINFR(pij))>0.5, and IB(i,j)=0 otherwise. Then, if C(pij) is the set of pixels 8-connected to pij in IB, we define mwr(pij) as the mean value of μWCR evaluated on C(pij). Moreover we considered the connectivity function CF(pij,μWCR, 0.5) that counts the number of pixels within a 8-neighborhood of pij, whose values in μWCR are greater than 0.5. Using these expressions the improved membership function is given by: ⎧⎪ min( μ INFR ( pij ), 1 − mwr ( pij ) if {μ INFR ( pij ) > 0.5 and CF ( pij , μWCR , 0.5 ) > 0} otherwise ⎪⎩ μ INFR
η INFR ( pij ) = ⎨
.
(6)
A Fuzzy Regional-Based Approach for Detecting Cerebrospinal Fluid Regions
557
4.4 Obtaining Improved PNFR Membership Function
As a result of improvements on INFR, we need to review the peripheral narrow fluid regions in the proximity of pixels where ηINFR(pij) 0 otherwise ⎩ μ PNFR ( pij )
ηPNFR = ⎨
.
(7)
4.5 Introduction of Confidence Degrees in the Detection
Since misclassification of MS lesion pixels as CSF pixels highly depends on pixel location, we considered that exists confidence in the detection of a pixel as CSF if it presents a low possibility of misclassification as MS lesion pixel based on its location. The definition of confidence was based on the aggregation of the fuzzy sets FPWFR, FIWFR, FPNFR and FINFR considering location and size constraints of the regions involved, and the possibility that lesion is present at them. Taking into account that narrow and wide fluid regions have different regional characteristics, we defined four new fuzzy sets: FCNFR, and FCWFR, which provide the possibility of a pixel to be detected as CSF in areas of narrow and wide fluid regions where there exists confidence in the detection; and FNCNFR and FNCWFR that are associated with areas in which there exists a higher possibility of misclassification. The membership functions that define FCNFR and FNCNFR are given by: ⎧ min(max(ηPNFR ( pij ),η INFR ( pij )), μ MPNFR ( pij )) ⎪⎪ ⎧CF ( pij ,η INFR , 0.5) > 0 and . μCNFR ( pij ) = ⎨ if ⎨ ⎩ max(η PNFR ( pij ),η INFR ( pij )) > 0.5 ⎪ otherwise ⎪⎩ min(η PNFR ( pij ),η INFR ( pij ),ηMPNFR ( pij ))
(8)
μ NCNFR = min(max(η PNFR ,η INFR ),1 − μCNFR ) .
(9)
where μMPNFR(pij)=max(μPNFR(pij), μINFR(pij)) if pij belongs to a region, R, whose pixels satisfy that max(μPNFR(•), μINFR(•))>0.5, and at least a 60% of the pixels within R are in the 20% most outer pixels of the intracranial region; and, μMPNFR(pij)=0 otherwise. As previously said, unlike narrow fluid regions, in wide CSF regions the higher possibility of correct detection is based on size constraints. Thus, if IWFR is the binary image such that IWFR (i,j)=1 if pij belongs to a region with a minimum width of 5 pixels whose pixels satisfy that max(ηPWFR(pij), ηPNFR(pij))>0.5, and IB(i,j)=0 otherwise. Then, the membership functions defining FCWFR and FNCWFR are given by: ⎧0.4
μCWFR = ⎨ ⎩η IWFR
if η IWFR (i, j ) > 0.5 and IWFR (i, j ) = 0 . otherwise
(10)
558
F.X. Aymerich et al.
⎧0.2
μ NCWFR = ⎨ ⎩η PWFR
if η IWFR (i, j ) > 0.5 and IWFR (i, j ) = 1 . otherwise
(11)
Finally, the degrees of confidence and no confidence in the detection were given by aggregation of previous membership functions according following expressions: ⎧ ⎧(max(μCWFR ( pij ), μCNFR ( pij )) > 0.5) and ⎪ ⎪ ⎪ ⎪(max(μ NCWFR ( pij ), μ NCNFR ( pij )) > 0.5) and if ⎨ ⎪0.5 μCFR ( pij ) = ⎨ ⎪(max(μCWFR ( pij ), μCNFR ( pij )) ≤ ⎪ ⎪ max(μ NCWFR ( pij ), μ NCNFR ( pij )) − 0.1) ⎩ ⎪ ⎪max( μ otherwise CWFR ( pij ), μ CNFR ( pij )) ⎩
.
⎧ ⎧(max(μ CWFR ( pij ), μ CNFR ( pij )) > 0.5) and ⎪ ⎪ ⎪ ⎪(max(μ NCWFR ( pij ), μ NCNFR ( pij )) > 0,5) and if ⎨ ⎪0.5 . μ NCFR ( pij ) = ⎨ ⎪(max(μ CWFR ( pij ), μ CNFR ( pij )) > ⎪ ⎪ max( μ NCWFR ( pij ), μ NCNFR ( pij )) − 0.1) ⎩ ⎪ ⎪max( μ otherwise NCWFR ( pij ), μ NCNFR ( pij )) ⎩
(12)
(13)
4.6 Defuzzification and Quality Measures
The defuzzification process focused on obtaining the CSF region applying α-cuts to CFR and NCFR fuzzy sets. Then, the crisp representation of the CSF was obtained adding the binary results obtained for CFR and NCFR. To determine the appropriate α-cuts we defined a detection quality factor, QDFR, obtained evaluating the efficiency in the detection of CSF regions, EFRP, and considering two reliability factors: RFRP, related to the number of CSF pixels detected; related to the number of MS lesion pixels. So, if NDFRP is the number of detected CSF pixels, NNDFRP is the number of non-detected CSF pixels, NFDFR is the number of false detections detecting CSF pixels, NDLP is the number of detected MS lesion pixels, and NLP is the total number of MS lesion pixels, the efficiency in the detection and the reliability factors were defined by equations (14) and (15). Then the quality factor, QDFR, is given by equation (16). E FRP = 2 RFRP =
N DFRP . 2 N DFRP + N NDFRP + N FDFR
N DFRP ; N DFRP + N NDFRP
+ RFRP ⎛E QDFR = 0.6 ⎜ FRP 2 ⎝
RNDLP = 1 −
N DLP . N LP
⎞ ⎟ + 0.4RNDLP . ⎠
(14)
(15)
(16)
A Fuzzy Regional-Based Approach for Detecting Cerebrospinal Fluid Regions
559
CSF and MS lesion masks were manually obtained using Dispimage software [15]. The α-cuts had to provide a commitment between correct detection of fluid regions and avoiding misclassification. So for selecting the more suitable we studied the results obtained for α-cuts in the interval [0.55, 0.95] for the training images.
5 Results The proposed algorithm was evaluated considering a training set compounded by 6 images acquired from two patients, and a test set constituted by 138 images acquired from three patients. All images were acquired using the T1-weighted sequence described in section 2. From the study of the results obtained applying nine α-cuts in the interval [0.55, 0.95] to the values of μCFR for the training images, we selected the value 0.55 because it provided the higher CFR quality detection outputs, without misclassifications as MS lesions. Then, we considered the union of the binary image obtained applying this á-cut to μCFR and the binary images obtained applying the nine α-cuts to μNCFR. Next, we obtained their quality indexes, QDFR, and analyzing the results we observed that the optimal value was gotten when the α-cut for μNCFR was 0.55. Having a look at columns 3 and 4 of Table 1, it can be appreciated that the indexes related to detection of CSF pixels, EFRP and RFRP, obtained considering the union improved the results obtained for the CFR, whereas we detected a reduced number of MS pixels. Moreover, looking at column 6 of Table 1 can be appreciated that global quality QDFR achieved an improvement around of 10% when NCFR is considered. It must be pointed out that the introduction of regional analysis represented a significant improvement of the results over local analysis in the CFR, because EFRP and RFRP quality indexes increased around of 10-16%. In the case of RNDLP and QDFR quality indexes, their values kept in the same range with absence of misclassifications and a slight better QDFR in the regional analysis. The results obtained for the test images are shown at Table 2. As can be appreciated, the values of all quality factors obtained for the regional analysis (rows 2 and 4) improved the obtained with local analysis (rows 3 and 5). Differences in relation to Table 1. Quality results obtained considering the training set images after regional analysis Region CFR CFR∪NCFR
α-cut 0.55 0.55
EFRP 0.673 0.724
RFRP 0.580 0.832
RNDLP 1.0 0.951
QDFR 0.776 0.847
Table 2. Summary of quality results obtained for CFR∪NCFR considering the test set images after regional analysis Region CFR CFR∪NCFR
Regional Local Regional Local
EFRP 0.557 0.469 0.726 0.696
RFRP 0.430 0.338 0.708 0.651
RNDLP 0.999 0.999 0.925 0.886
QDFR 0.696 0.642 0.800 0.758
560
F.X. Aymerich et al.
(a)
(b)
(c)
Fig. 2. Different levels of detection corresponding to different anatomical locations. (a) Original images. (b) Detection mask corresponding to CFR overlaid on the original images. (c) Detection mask corresponding to CFR∪NCFR overlaid on the original images.
the analysis of the images included in the training set showed, mainly, a reduction of CSF detection for CFR, whereas the capability of avoiding misclassifications was very close to the obtained for the training set. These results can be appreciated in Fig. 3 that shows some examples of results in the analysis of the test set corresponding to different anatomical locations. To conclude, in this paper we have presented an algorithm which allows discriminating cerebrospinal fluid regions inside the intracranial region, providing confidence degrees that match with the possibility of including pixels associated to MS lesions. This work has focused on the introduction of a regional analysis in order to improve detections levels obtained after local analysis based on perceptual features. Thereby, the proposed algorithm has considered location, shape and size constraints, and has divided the results in function of the level of confidence in avoiding misclassification of MS pixels as CSF detections. The results show good CSF detection levels, and the values of the quality factors point out that CFR is free or practically free of misclassifications, whereas NCFR helped to improve CSF detection level without increasing significantly the number of misclassifications. The introduction of regional analysis has allowed improving both CSF detection levels and confidence in avoiding misclassifications in relation to previous local analysis. It must be also emphasized the improvements in values of RNDLP quality factors and in the quality levels obtained considering the test set. Finally, the results obtained suggest that this algorithm, particularly images resulting of detecting CFR regions, can be applied to filter false detections of MS lesions due to misclassifications of these lesions as CSF. An improvement of the work here presented may be the introduction of an alternative approach to obtain the values of the parameters based on an optimization procedure; which would also help to carry out a robustness study.
A Fuzzy Regional-Based Approach for Detecting Cerebrospinal Fluid Regions
561
Acknowledgments. This work has been partially supported by the Spanish CICYT project TIN2007-68063.
References 1. Edwards, M.K., Bonnin, J.M.: White Matter Diseases in Magnetic Resonance Imaging of the Brain and Spine. In: Atlas, S.W. (ed.) Magnetic Resonance Imaging of the Brain and Spine, pp. 467–477. Raven Press (1991) 2. Edelman, R.R., Hesselink, J.R.: Clinical Magnetic Resonance Imaging. W.B. Saunders Company, Philadelphia (1990) 3. McDonald, W.I., Compston, A., Edan, G., Goodkin, D., Hartung, H.P., Lublin, F.D., McFarland, H.F., Paty, D.W., Polman, C.H., Reingold, S.C., Sandberg-Wollheim, M., Sibley, W., Thompson, A., van den Noort, S., Weinshenker, B.Y., Wolinsky, J.S.: Recommended Diagnostic Criteria for Multiple Sclerosis: Guidelines from the International Panel on the Diagnosis of Multiple Sclerosis. Ann. Neurol. 50(1), 121–127 (2001) 4. Tintoré, M., Rovira, A., Río, J., Nos, C., Grivé, E., Sastre-Garriga, J., Pericot, I., Sánchez, E., Comabella, M., Montalban, X.: New Diagnostic Criteria for Multiple Sclerosis: Application in first Demyelinating Episode. Neurology 60(1), 27–30 (2003) 5. Miller, D.H., Barkhof, F., Frank, J.A., Parker, G.J.M., Thompson, A.J.: Measurement of Atrophy in Multiple Sclerosis: Pathological Basis, Methodological Aspects and Clinical Relevance. Brain 125(8), 1676–1695 (2002) 6. Boesen, K., Rehm, K., Schaper, K., Stoltzner, S., Woods, R., Lüders, E., Rottenberg, D.: Quantitative comparison of four brain extraction algorithms. Neuroimage 22(3), 1255– 1261 (2004) 7. Lemieux, L., Hammers, A., Mackinnon, T., Liu, R.S.N.: Automatic Segmentation of the Brain and Intracranial Cerebrospinal Fluid in T1-weighted Volume MRI Scans of the Head, and its Application to Serial Cerebral and Intracranial Volumetry. Magn. Reson. Med. 49(5), 872–884 (2003) 8. Anbeek, P., Vincken, K.L., van Bochove, G.S., van Osch, M.J.P., van der Grond, J.: Probabilistic Segmentation of Brain tissue in MR imaging. Neuroimage 27(4), 795–804 (2005) 9. Sastre-Garriga, J., Ingle, G.T., Chard, D.T., Cercignani, M., Ramió-Torrentà, L., Miller, D.H., Thompson, A.J.: Grey and White Matter Volume Changes in Early Primary Progressive Multiple Sclerosis: a Longitudinal Study. Brain 128(6), 1454–1460 (2005) 10. Datta, S., Sajja, B.R., He, R., Wolinsky, J.S., Gupta, R.K., Narayana, P.A.: Segmentation and Quantification of Black Holes in Multiple Sclerosis. Neuroimage 29(2), 467–474 (2006) 11. Sharma, J., Sanfilipo, M.P., Benedict, R.H.B., Weinstock-Guttman, B., Munschauer, F.E., Bakshi, R.: Whole-Brain Atrophy in Multiple Sclerosis Measured by Automated versus Semiautomated MR Imaging Segmentation. AJNR 25(6), 985–996 (2004) 12. Aymerich, F.X., Montseny, E., Sobrevilla, P., Rovira, A.: FLCSFD- a Fuzzy Local-Based Approach for Detecting Cerebrospinal Fluid Regions in Presence of MS Lesions. In: ICME International Conference on Complex Medical Engineering, pp. 1–6 (2009) 13. Aymerich, F.X., Sobrevilla, P., Montseny, E., Rovira, A., Gili, J.: Automatic Segmentation of Intracraneal Region from Magnetic Resonance Images. Magnetic Resonance in Physics, Biology and Medicine 11(S1), 141 (2000) 14. Yager, R.R.: Families of OWA Operators. Fuzzy Sets and Systems 59, 125–148 (1993) 15. Plummer, D.L.: Dispimage: a Display and Analysis Tool for Medical Images. Riv. Neuroradiol. 19, 1715–1720 (1992)