A Dozen Facts You Should Know About Antitrust and the Oil Industry By Timothy J. Muris Former Chairman of the Federal Trade Commission (2001 - 2004)
Richard G. Parker Former Director of the Federal Trade Commission's Bureau of Competition (1999 - 2001)
JUNE 2007
ABOUT THE AUTHORS Both Timothy J. Muris and Richard G. Parker have long and distinguished careers in protecting America’s consumers. Each has held leadership roles in the antitrust field, most notably at the Federal Trade Commission (FTC) but also within the antitrust bar, in the private sector, and in academia. Both have received accolades as leading antitrust practitioners and frequently publish in antitrust and other legal journals.
TIMOTHY J. MURIS Mr. Muris served as Chairman of the FTC under President George W. Bush from 2001 to 2004. Perhaps most notably, Muris oversaw the creation and implementation of the National Do Not Call Registry. Earlier in his career, Muris served as the Director of the FTC’s Bureau of Competition (1983-1985), and as the Director of the FTC’s Bureau of Consumer Protection (1981-1983). While at the FTC, Muris guided the application and enforcement of the federal antitrust and consumer protection laws across a broad array of industries. While Chairman, Muris undertook several initiatives designed to further the development of sound enforcement policies with respect to the petroleum industry. Under Muris’ leadership, the FTC sued Unocal for unlawfully distorting California’s procedures relating to the adoption of low emissions reformulated gasoline standards. Before the FTC approved the Chevron/Unocal merger in 2005, the agency required Chevron to consent to foregoing enforcement of the Unocal patents, saving consumers billions of dollars. In addition, the FTC prepared a major report on oil mergers that analyzed structural change and other evolving issues in the industry. During Muris’ tenure, the Commission also instituted a gasoline price monitoring program that enables the FTC to work with state and federal agencies to identify price fluctuations and their causes. While Chairman, Muris testified before Congress on a broad array of antitrust and consumer protection issues, including those involving energy. While Director of the FTC’s Bureau of Competition during the 1980s, Muris oversaw a number of antitrust investigations in the oil industry, including Chevron/Gulf and Texaco/Getty, two merger cases in which the Commission obtained substantial relief. Mr. Muris is currently Foundation Professor at the George Mason University School of Law. In addition, Muris is Of Counsel in O’Melveny & Myers LLP’s Washington, DC office and serves as co-chair of the firm’s Antitrust/Competition practice. In the private sector, Muris has represented clients before the FTC, the U.S. Department of Justice, other U.S. agencies, and competition authorities in other jurisdictions on a variety of antitrust matters, including mergers and non-merger investigations.
A-1
RICHARD G. PARKER Richard G. Parker served at the FTC under President William J. Clinton as Director (1999-2001) and Senior Deputy Director (1998-1999) of the FTC’s Bureau of Competition. During his FTC tenure, Parker led the agency’s investigation of Exxon/Mobil, which resulted in the largest divestitures ever ordered by the FTC. He also managed the investigation of and the challenge to BP Amoco/ARCO, which also resulted in substantial relief. In addition, Parker oversaw the agency’s investigation into gasoline price increases in the Midwest in the late spring and early summer of 2000, and led the agency’s efforts to assist the Northeastern State Attorneys General in their investigation of petroleum product price increases in Northeastern markets during the winter of 1999-2000. Parker has testified before Congress on oil industry mergers, energy pricing investigations and issues, and antitrust issues involving myriad other industries. Mr. Parker is a Partner in O’Melveny & Myers LLP’s Washington, DC office and serves as co-chair of the firm’s Antitrust/Competition practice. He successfully has litigated mergers in both the public and private sectors, a rare accomplishment in the antitrust field. While in public service, Parker served as co-lead counsel for the FTC in obtaining a federal court injunction against two simultaneous mergers in the drug wholesaling industry. At O'Melveny & Myers, Parker led a successful defense of the Arch Coal/Triton Coal merger (on behalf of Triton Coal) against the FTC in federal court. He is the recipient of the FTC’s Distinguished Service Award, presented by Chairman Robert Pitofsky.
ABOUT THE MONOGRAPH Authored by Clinton and Bush appointees, this monograph reflects a bipartisan consensus regarding antitrust and the oil industry. This consensus is a notable one because, while few industries affect consumers as much as petroleum, few industries labor under so many misconceptions or calls for industry-specific antitrust legislation. By describing the U.S. oil industry as it actually exists – intensely competitive, innovative, and subject to more scrutiny and tougher antitrust standards than any other industry – the authors hope to provide decision makers with the tools to make wise decisions that will benefit consumers and lower prices at the pump.
ACKNOWLEDGEMENTS The authors gratefully acknowledge the financial support of the U.S. Chamber of Commerce in preparing this monograph. In addition, the authors thank Maryanne Kane, Ben Labow, Haidee Schwartz, Bilal Sayyed, Christine Wilson, and Kevin Yingling for assistance in drafting the monograph; Diane Berliner for typing, revising, and compiling the drafts; Courtney Dyer for editing the final monograph; and Jennifer DeJesus, Caitlin O’Connell, Jayne Sabolinski, and Michelle Woo for their research assistance. Finally, the authors acknowledge with appreciation the comments of Mary Coleman, Managing Director, LECG, on earlier drafts.
A-2
EXECUTIVE SUMMARY A DOZEN FACTS YOU SHOULD KNOW ABOUT ANTITRUST AND THE U.S. OIL INDUSTRY Few industries affect consumers as much as petroleum. Yet, few industries labor under so many misconceptions or calls for industry-specific antitrust legislation. This report describes the U.S. oil industry as it actually exists: intensely competitive, innovative, and subject to more scrutiny and tougher antitrust standards than any other industry. Following are a dozen facts to inform the current debate over regulating this vital part of our economy.
FACT 1:
ECONOMIC LEARNING AND ANTITRUST ENFORCEMENT HAVE EVOLVED: WE NOW KNOW THAT BIG IS NO LONGER NECESSARILY BAD.
Antitrust enforcement through much of the 1970s was premised on the notion that “big is bad.” As economic learning evolved, this simplistic notion was replaced with modern antitrust analysis that combines sophisticated economic theory with careful analysis of the complex factual issues that arise in individual investigations. This modern analysis considers many facts, including the number and size of firms in the industry, their behavior toward one another, the extent to which new entry or expansion of existing facilities has occurred or likely will occur, and whether historical conduct in the industry has been noncompetitive. While there are no hard and fast rules, the courts and the enforcement agencies tend to be most concerned about industries with a history of anticompetitive conduct and a lack of innovation, entry, and expansion. The ability of competitors in distant geographic locations to influence price and behavior in the areas of concern is also highly relevant. Measured by these criteria, the domestic petroleum industry is highly competitive. The size of the firms is small relative to the mammoth size of the industry, and many competitors populate each level of the business. Despite the virtual impossibility of building new refineries in the United States, firms have been innovative in adding capacity. Moreover, many firms have entered in recent years, particularly in refining and retailing. In addition, mergers have lowered costs and increased innovation.
FACT 2:
THE ANTITRUST AUTHORITIES SCRUTINIZE THE PETROLEUM INDUSTRY MORE CLOSELY THAN ANY OTHER.
Energy consumption is woven into the fabric of daily life in America. Despite the competitive nature of the domestic oil industry, supply shocks result in price increases that can be economically painful. For these reasons, petroleum firms receive greater scrutiny from antitrust authorities than do others. Since 1973, the FTC has conducted well over 100 investigations examining every facet of the oil industry.
i
•
Investigations of Proposed Mergers: Since 1981, the FTC has reviewed hundreds of mergers in the oil industry, has investigated dozens of them in detail, and has challenged 21. These challenges resulted in divestitures, court-issued injunctions, abandoned transactions, and conditions on future conduct.
•
Non-Merger Investigations: The FTC aggressively polices anticompetitive non-merger activity in the petroleum industry. The agency has conducted several exhaustive investigations in recent years, including (1) a nine-month investigation into the price increases following Hurricanes Katrina and Rita; (2) a year-long investigation into Shell’s 2004 decision to close its Bakersfield refinery, based on concerns that the closure was motivated by a desire to remove capacity from the market; (3) an investigation into zone pricing and redlining on the West Coast in the late 1990s to 2001; and (4) an investigation into the Midwest gasoline price spike in 2000. In none of these investigations did the FTC find evidence of collusion or market manipulation.
•
Continued Monitoring of Industry Developments: The agency reviews daily data on
•
Conferences, Reports, Papers, and Testimony: To deepen its understanding of the industry’s dynamics, the FTC has organized conferences, conducted research, and published working papers and reports. These efforts equip the agency to provide informed guidance on policy issues to Congress and the public.
retail gasoline and diesel prices for 360 major cities, and wholesale prices for 20 major urban areas, to identify (and investigate if necessary) unusual movements in gasoline prices. These efforts have generated several investigations of pricing anomalies, but the FTC has not found that illegal conduct caused any of the anomalies.
FACT 3:
THE AMERICAN PETROLEUM INDUSTRY IS NOT HIGHLY CONCENTRATED.
Perhaps because it receives significantly more scrutiny than any other industry, the American petroleum industry is not highly concentrated. •
Exploration and Production: Individually, oil companies hold very small shares of world crude oil production and reserves, and world concentration in crude oil and natural gas liquids has fallen since 1985. Recent mergers among major U.S. oil companies have had little impact on concentration in this sector, which remains low both domestically and globally.
•
Refining: A 2006 FTC investigation found that the refining industry is relatively unconcentrated; no refiner holds a substantial capacity share either nationally or regionally. Nationally, Valero had the largest share with 13 percent, ConocoPhillips had 12.9 percent, and ExxonMobil had 11.4 percent. Shares at more local levels, while somewhat higher, also appear modest.
ii
•
Retail Gasoline: Most states are either unconcentrated or only moderately concentrated. Moreover, independents and hypermarkets, such as Costco and Wal-Mart, are now significant competitors in the retailing market.
In Congressional testimony earlier this year, the FTC stated that, despite some increases over time, concentration for most sectors of the industry remains low to moderate. Thus, using concentration as an initial screen, modern antitrust practitioners would conclude that the vast majority of the oil industry is unlikely to present competitive problems. Even when concentration is relatively high, it remains only an analytical starting point. Other facts, including entry conditions and the nature of competition among industry firms, are more important. Compared to many other U.S. industries, oil industry concentration is significantly lower. Although refining and retailing are more concentrated than exploration and production, the top four oil firms have far smaller shares than the top four firms in many other industries. In gasoline retailing, for example, the average share of the four largest firms across states is 62 percent, and the regional refining average is 59 percent. In contrast, the averages are higher for many other industries, including automobiles (74 percent), light bulbs (77 percent), carpets (84 percent), brewing (84 percent), and carbonated soft drinks (95 percent).
FACT 4:
REFINERS HAVE EXPANDED DOMESTIC AND GLOBAL CAPACITY SIGNIFICANTLY.
World light product production has increased in the last decade through the construction of new refineries and the expansion of existing ones. Recently constructed refineries, and those currently proposed, are largely situated in fast-growing, emerging markets like the Far and Middle East, rather than in the slower-growing, mature economies of the United States and Western Europe where the cost to construct and operate a new refinery is generally much higher. Despite higher costs in the United States, domestic refinery capacity expansion has kept pace with global capacity growth. From 1994 to 2004, U.S. refiners increased domestic crude distillation capacity by 12 percent, and light petroleum product production by 16 percent. (We use 2004 as the endpoint for many refining statistics in this monograph because the effects of Hurricanes Katrina and Rita tend to distort more recent data.) The industry added the equivalent of 20 new, average-sized refineries during this period. Further capacity expansion is expected: the Energy Information Administration recently noted that domestic refiners will add the equivalent of another eight refineries by 2012. America’s refining capacity has grown through enhancements to existing refineries. Although some assert that the lack of new, grassroots refineries is evidence of the refiners’ restriction of U.S. capacity, this assertion ignores the relative costs and benefits of incremental expansion. Building a new refinery is extraordinarily expensive and time consuming, given the significant costs of permitting and constructing the refinery and ancillary infrastructure (not to mention the risks of litigation and public opposition). Adding capacity to existing facilities is faster and far more cost-effective. Grassroots refinery capacity in the United States iii
conservatively can cost $19,000 per daily barrel of output. Substantial capacity expansion projects typically cut that cost considerably, and minor expansions cost even less. These facts explain U.S. refiners’ preference for capacity growth through innovative, incremental expansion. U.S. refiners have devoted tens of billions of dollars in recent decades not only to increase refining capacity, but also to improve output and meet environmental requirements. For example, innovations in refining technology have allowed U.S. refineries to increase their yield of light petroleum products from the same volume of inputs. On average, a barrel of crude and other inputs processed by U.S. refineries yielded 0.816 barrels of light petroleum products in 2004, exceeding the 0.788 barrels yielded in 1994. Refiners also have invested billions to modify plants to produce many new boutique fuels and comply with other government mandates. Current domestic refining capacity is the largest in history, and substantial capacity expansions are underway. In addition, the United States enjoys unprecedented access to a global market for crude and refined products. Importing refined products is a cost-effective means of satisfying growing U.S. demand, and provides a needed alternative source when supply disruptions arise in the United States. Following Hurricanes Katrina and Rita, for example, the swift diversion of foreign-refined products to the United States helped mitigate supply shortages.
FACT 5:
REFINERIES OPERATE AT OR NEAR THEIR PRACTICAL MAXIMUM UTILIZATION RATES.
Despite assertions that refiners manipulate refinery capacity utilization to reduce supply and raise prices, the record reveals precisely the contrary. U.S. refineries generally operate at or near their practical maximum utilization rates, running at approximately 93 percent from 1994 to 2004. (Seasonal changes in the refining production mix, scheduled maintenance to insure safe and reliable refinery operations, and unplanned outages make 100 percent utilization impossible.) These high utilization rates are even more impressive given the significant modifications and resultant operating disruptions to refining infrastructure in recent years – not only to expand capacity, but also to modify plants to produce many new boutique fuels and comply with other government mandates.
FACT 6:
INVENTORY PRACTICES HAVE REDUCED COSTS AND BENEFITED CONSUMERS.
Like other firms, petroleum companies cut costs by reducing inventory while maintaining high reliability of supply for their customers. Industry inventories of crude oil have declined significantly, avoiding substantial costs without sacrificing reliability. •
The number of days of crude oil supply for all U.S. commercial stocks (the “days supply”) dropped by 23 percent from 1994 to 2004, while the number of days supply at U.S. refineries dropped by 12.5 percent.
iv
•
The industry achieved similar declines in the inventory levels of light refined petroleum products generally and motor gasoline specifically during this period, as days supply at all locations dropped by 21 percent and 19 percent, respectively.
These lower inventory levels have reduced inventory costs substantially. Using 2004 prices and volumes, annual savings in industry carrying and storage costs total approximately $1.9 billion, or 33 percent of the current inventory carrying and storage costs. Notably, these substantial cost savings are obtained without sacrificing reliability of supply. The FTC’s 2006 report on gasoline prices observed that because refiners interact repeatedly with their customers, they have a strong incentive to maintain product reliability, both to maintain existing business and to win future contracts. The FTC’s 2006 report also acknowledged and categorically rejected the assertion that petroleum firms, either unilaterally or collectively, have manipulated inventory levels to elevate prices during market disruptions. Instead, the FTC concluded that inventories had declined because maintaining them is expensive, and that reducing inventory costs is an important goal of modern manufacturing. Some have asked whether maintaining larger inventories would help mitigate price increases during supply disruptions. In answering this question, one should recognize that the reduction in inventories of gasoline held at all U.S. terminals since 1994, while resulting in significant cost savings, exceeds only slightly one day of normal supply. Further, higher stock levels would be meaningless if those stocks could not be accessed because of personnel evacuations, power outages, and damage to facilities. Industry members and, ultimately, consumers would bear additional daily costs of carrying excess inventory without necessarily deriving any of the intended benefits during supply disruptions.
FACT 7:
THE PROFITABILITY OF THE PETROLEUM INDUSTRY IS COMMENSURATE WITH OTHER INDUSTRIES OVER THE LONG RUN.
The petroleum industry ranks among the most capital intensive industries. Substantial long-term investments are required in capacity, technology, and research and development; continual expenditures are needed to meet changing environmental and other government requirements. •
Between 1992 and 2006, the U.S. oil industry invested more than $1.25 trillion in longterm energy initiatives, an amount which far outpaced its net income of $900 billion.
•
In 2006, new investment by the U.S. oil industry exceeded $174 billion, and the industry plans $183 billion in new projects in 2007.
Although the petroleum business is cyclical, these substantial investments are made annually. While requiring sizeable investment, the petroleum industry historically has experienced highly variable rates of return, with many periods of low or negative returns. v
•
Between 1995 and 2005, the return on investment for the refining sector was 10 percent, about 4.7 percent less than returns realized by the S&P Industrials.
•
Over the longer period of 1977 to 2005, oil industry returns averaged less than seven percent, compared to nine percent for durable goods and more than 11.5 percent for the S&P Industrials.
The oil industry’s earnings typically have been commensurate with those of other industries. During the 1990s and in other industry “bust” periods, U.S. oil earnings fell well below those of other industries. In recent years, greater than forecasted demand and other factors, including massive supply disruptions from natural disasters, have generated above average industry earnings. From 2002 to 2006, earnings per dollar of sales equaled 6.4 cents for all manufacturing industries and 7.4 cents for the oil industry. For 2006, all manufacturing industries averaged annual earnings of 8.2 cents on each dollar of sales, while the oil industry averaged 9.5 cents. Critics have excoriated the oil companies for these recent increases in industry returns on investment and profits, claiming they indicate noncompetitive performance. Economists, however, no longer believe that high profits necessarily signal a noncompetitive industry. In any event, viewed over time, petroleum firms’ profits and returns do not differ significantly from those of other industries. Strong returns and profits in recent years follow years of significantly below average returns and profits.
FACT 8:
THE FTC APPLIES TOUGHER STANDARDS TO MERGERS IN THE OIL INDUSTRY THAN TO MERGERS ELSEWHERE.
Like many other industries, the petroleum sector has undergone significant restructuring, especially during the merger wave of the 1990s. Many resulting transactions enabled the merging firms to achieve economies of scale and scope in research and development, production, distribution, and marketing. Evidence indicates that recent merger activity also produced significant cost savings, improved resource management, and increased innovation and technology diffusion. These cost savings and technological advances have not come at the expense of consumers. The FTC examines any conduct in the industry that may decrease competition and thus harm consumers of gasoline and other petroleum products. The agency has been especially vigilant in investigating proposed mergers. Indeed, the FTC applies the Horizontal Merger Guidelines standards more strictly to this industry than to others, and requires divestitures in the petroleum industry at far lower levels of concentration than elsewhere. •
More than 60 percent of petroleum merger enforcement takes place in markets involving five or more significant competitors, while substantially all merger enforcement in other industries occurs in markets with four or fewer competitors.
vi
•
Of all merger enforcement actions at concentration levels below an HHI of 1800,1 97 percent involved the oil industry. Similarly, this industry accounted for 77 percent of merger enforcement actions at concentration levels below 2400. Oil is the only industry in which the government undertakes significant enforcement actions at or below that level.
•
The average post-merger concentration level for mergers requiring divestitures is significantly higher in every other industry investigated by the FTC or the DOJ Antitrust Division – including grocery, chemicals, pharmaceuticals, telecommunications, banking, dairy, or waste disposal – than for the petroleum industry.
The FTC’s heightened scrutiny of petroleum mergers has led to significant remedies. Statistics on merger enforcement in the oil industry show that, from 1981 to 2007, the FTC challenged 21 oil mergers. In almost all of these cases, the parties either abandoned the transaction or agreed to significant divestitures.
FACT 9:
EMPIRICAL ANALYSES OF THE PRICE EFFECTS OF OIL MERGERS PROVIDE NO BASIS FOR APPLYING MORE STRINGENT MERGER STANDARDS.
Oil industry critics rely on a 2004 report by the Government Accountability Office (GAO) to assert that a few oil industry mergers have increased gas prices. The GAO report can support no such claim. GAO based its report on fundamentally flawed analyses, using models with major methodological mistakes that make its quantitative analysis unreliable at best, and invalid in most instances. Markets are misspecified, estimations are inconsistent, and critical variables are omitted. FTC tests show that the GAO model failed to generate results consistent with the report’s conclusions. Moreover, the agency examined some of the same mergers analyzed by GAO. After extensive econometric analyses of pricing data and review of internal company documents, FTC staff found no reliable evidence that these mergers had harmed consumers. Despite lacking an empirical basis for doing so, some legislative proposals favor abandoning the antitrust agencies’ well-tested approach in favor of novel and unique standards for oil mergers. The bipartisan Antitrust Modernization Commission observed earlier this year that there exists a general consensus that the agencies’ approach to merger review is sound. The current system is not broken: agencies can and do challenge transactions at low thresholds of anticompetitive effects. Moreover, replacing the current system with industry-specific rules threatens to politicize merger policy, encourage rent-seeking behavior, create judicial confusion, and generate high administrative burdens. The effectiveness of the existing merger review
1
Industry concentration is determined by calculating the Herfindahl-Hirshman Index, which can range from 0 (in an industry with thousands of companies, none of whom has an appreciable market share) to 10,000 (in an industry with a monopolist). An industry with 5 equally-sized firms has an HHI of 2000.
vii
system, coupled with the harms threatened by proposed alternatives, creates a high burden for proponents of wholesale change – a burden that simply has not been met. Proposals to shift the burden of proof to the merging parties would not have prevented the government’s recent loss in FTC v. Foster. In Foster, the FTC unsuccessfully sought to enjoin the acquisition of Giant Industries by Western Refining, alleging that the deal would reduce the bulk supply of gasoline to New Mexico. The court found that the FTC made a prima facie case under the Merger Guidelines, and shifted the burden to the defendants. The defendants successfully rebutted the FTC’s case by showing that there were many additional actual or potential competitors in the market, that these competitors could easily replace lost capacity resulting from the merger, and that market factors would prevent the defendants from unilaterally increasing prices. Foster is simply an example of the FTC’s aggressive enforcement in the petroleum industry; the facts of the case, not the burden of proof, determined the outcome.
FACT 10: MARKET FORCES PROVIDE THE MOST EFFECTIVE MECHANISM FOR QUICKLY AND EFFICIENTLY ALLEVIATING PRICE SPIKES. Competitive markets function efficiently as suppliers and consumers respond to price changes. A particularly compelling example of the effectiveness of market forces in responding even to massive supply shocks involves Hurricanes Katrina and Rita. These hurricanes caused unprecedented damage to the U.S. oil industry. They severely impacted product production and distribution in the Gulf Coast and throughout the United States, substantially reducing U.S. supply for an extended period. Firms responded to these extensive disruptions by quickly restoring production and logistics capabilities and by locating alternative supply sources, including increased imports. Even though production of crude oil and refined products was greatly tested, prices returned to pre-hurricane levels within four weeks after Rita hit. In short, market forces triggered a rapid industry response that swiftly restored equilibrium. The primary lesson from Katrina and Rita is that markets work, if we let them. Indeed, the consumer impact of this massive supply disruption was limited to temporary price increases – there were no widespread product outages, and there was no need for rationing or price controls. Instead, the market, left to function according to the laws of supply and demand, efficiently reestablished equilibrium as elevated gasoline prices suppressed consumer demand and provided incentives for suppliers around the world to increase shipments to the United States.
FACT 11: PRICE-GOUGING LEGISLATION WOULD HARM, RATHER THAN BENEFIT, CONSUMERS. When demand exceeds supply, prices increase, consequently attracting additional supplies and reducing demand. Following the supply shortfall triggered by Hurricanes Katrina and Rita, higher prices for light products attracted additional supplies from less affected areas of the United States and from overseas. Absent these price signals, the substantial efforts to rebalance supply and demand made by oil companies would not have been as successful or, in some cases, even possible. Moreover, after an initial increase in demand from “panic buying,” consumers faced with higher prices reduced demand for gasoline. viii
If price-gouging legislation were effective, it would prevent prices from rising as high as they otherwise would in response to supply shocks. Thus, effective price-gouging legislation would create the same effects as price controls. Some may speculate that such controls would reduce the impact of future supply disruptions. But history reveals that such measures provide false comfort for consumers. The price controls of the 1970s did little to mitigate supply shortages, instead resulting in long lines, product outages, and rationing. It is inescapable that any attempt to impose price controls, either directly or through price-gouging statutes, will result in unintended and harmful effects for consumers and the economy. Instead of benefiting consumers, price controls would: •
Lead to Run-Outs: Prices rise after a supply disruption because, without replacement supplies, there is only so much to go around. Replacements cost more than they would in the absence of the emergency. Firms will not purchase replacement supplies unless they can cover their costs, which price-gouging legislation could prevent. Thus, consumers would be unable to buy gasoline at any price.
•
Tend to Hit Consumers in Rural Areas the Hardest: Price controls reduce the incentives for producers to ship product to remote areas. Yet consumers in these remote, sparsely populated areas often need gasoline most because, without well-developed public transportation systems, they travel by automobile to obtain basic goods and services.
•
Waste Resources: The welfare loss of rationing by queuing in California over seven months during the price controls of the 1970s totaled about $2.5 billion in 2005 dollars.
•
Create Market Distortions: For example, the Nixon Administration’s price control board did not regulate the prices of imports. As a result, some firms shipped supplies to Canada and then back to the United States for sale. Other firms built new, inefficient refineries because gasoline from new refineries could be sold at higher prices than identical gasoline from older ones.
•
Encourage Inefficiencies That Cause Regulated Prices to Exceed Market Prices: For instance, price control regulations in the 1970s permitted refiners to increase their ceiling price to recoup increased costs. Thus, refiners had an incentive to use production methods that allowed the greatest cost recoupment even if those methods were not otherwise the most efficient. Under price controls in which producers are incentivized to increase costs and pass them along to consumers, the price of gasoline could exceed the price that consumers would pay in a competitive, unregulated market.
•
Diminish Refiners’ Incentives, Over the Long Run, to Invest in Refining Capacity: Refiners must receive prices above cost during periods of tightness to earn an adequate return on investments. By creating an expectation of reduced returns on refining operations, price controls would reduce refining capacity investment. The likely
ix
consequence would be to increase dependence on foreign imports and reduce capacity available to compensate for refinery outages and other supply interruptions.
FACT 12: THERE ARE CONSTRUCTIVE LEGISLATIVE ALTERNATIVES THAT WILL BENEFIT CONSUMERS. Instead of pursuing market-distorting initiatives that would harm consumers, the government should remove constraints on industry members to respond quickly to future supply disruptions and eliminate state laws that needlessly increase gasoline prices. Several initiatives would help consumers: •
Continue Vigorous and Objective Antitrust Scrutiny At All Levels of This Industry: Since 1973, the FTC has scrutinized the oil industry more closely than any other, conducting well over 100 investigations into every facet of the industry. The FTC should continue vigorously to enforce the antitrust laws to help maintain the U.S. industry’s competitive state. A recent example of the FTC’s highly effective enforcement in this industry is the relief obtained in the Chevron/Unocal merger. In 2005, the FTC required Chevron to forego enforcement of certain Unocal patents, which the FTC, in a separate case, had alleged Unocal was enforcing unlawfully.
•
Eliminate State Laws That Increase Gas Prices: Many states and the District of Columbia have laws that harm consumers by increasing pump prices. These laws include: (1) Minimum pricing laws, which prohibit retailers from selling below often vague definitions of cost; (2) Divorcement laws, which prohibit efficient vertical integration in the gasoline production and distribution supply chain; and (3) Full-service laws, which impose full-service costs on all consumers by prohibiting them from pumping their own gas. Laws that harm consumers by increasing gas prices should be repealed; federal antitrust law is sufficiently robust to detect and condemn anticompetitive conduct in the oil industry.
•
Limit the Number of Boutique Fuels: Regulatory authorities currently mandate at least 17 different fuel types. Limiting the number of mandated specifications would increase supply flexibility and product fungibility across geographic regions, facilitating rapid responses to local supply shocks.
•
Expedite Waiver Processes During Supply Disruptions: The existence of numerous motor gasoline specifications hampers oil companies’ ability to respond quickly to supply disruptions. Modifications to the waiver process would facilitate more rapid responses. For example, the EPA could be given the authority to waive both federal and state fuel specifications during periods of supply shortage. In addition, the Jones Act waiver process should be reviewed to establish transparent and clearly articulated standards for permitting exemptions.
x
•
Streamline the Refinery Permitting Process: Because expanding existing refineries is much more cost-effective than building new ones, future additions to U.S. refining capacity will occur through such expansions. Government regulations, such as the EPA’s New Source Review (“NSR”), can impede refinery expansion without appreciably improving the environment. As originally conceived, a facility owner seeking to construct a new major source or make major modifications was subject to NSR. Through a later reinterpretation of the program, however, the EPA significantly expanded the program to apply even to small changes to existing sources. Streamlining NSR thus would help mitigate a potential disincentive to refinery investment.
*
*
*
*
We explore these twelve facts in greater detail in this monograph. The Foreward sets the stage for the remainder of the monograph and provides more detail on Facts 1 and 2. Chapter 1 provides a factual basis for understanding the industry and the market forces that shape it, and provides more information on Facts 3 through 7. Specifically, this Chapter examines concentration levels in the industry relative to other industries, U.S. refining capacity growth, the relationship between U.S. and global supply and demand, the capital-intensive nature of the industry in the United States, and the history of profitability. Chapter 2 explores mergers in the petroleum industry, including a discussion of the FTC’s studies and enforcement actions in this area. The information in this Chapter pertains to Facts 8 and 9. Chapter 3 provides greater detail on Facts 10 through 12 by examining the complex factors that affect gasoline prices, provides illustrations of market responses to supply shocks, summarizes the FTC’s investigative findings that price increases are based on market forces, explains why price gouging and other laws that attempt to protect consumers actually harm them, and discusses legislative ideas that would benefit consumers.
xi
TABLE OF CONTENTS
EXECUTIVE SUMMARY………………………………………………………………..……..i FORWARD: SETTING THE STAGE.…………………………………………………......…1 A.
Economic Learning and Antitrust Enforcement Have Evolved: We Now Know That Big Is No Longer Necessarily Bad………………………………………………………..1
B.
The Antitrust Authorities Scrutinize the Petroleum Industry More Closely than any Other………………………………………………………………………………………5
CHAPTER ONE: KEY ANTITRUST FACTS ABOUT THE OIL INDUSTRY...................9 A.
The American Petroleum Industry Is Not Highly Concentrated………………………...10 1.
Concentration Levels Are Low to Moderate…………………………………….10 a.
Exploration and Production……………………………………………...11
b.
Crude Oil Bulk Transport………………………………………………..14
c.
Refining…………………………………………………………………..14
d.
Refined Petroleum Product Transport…………………………………....16
e.
Retailing/Gasoline Marketing …………………………………………....16
2.
Other U.S. Industries Are as or More Concentrated……………..……………....17
3.
Recent Merger Activity Has Occurred Largely at the Exploration and Production Level, the Most Unconcentrated Level of the Industry………………………….19
4.
The Petroleum Industry Has Become Less Vertically Integrated as Asset Dispositions and Entry Have Occurred…………………………………………..21
5.
Concentration in the Petroleum Industry Is Not at Levels Likely to Impact Competition and Prices……………………………………………………….…..23
TOC-1
B.
C.
Refiners Have Expanded Domestic and Global Capacity Significantly………………....23 1.
U.S. Refiners Recently Have Added the Equivalent of 20 New Refineries……..26
2.
Refineries Retired in the Last Decade Produced Little Gasoline…………….…..27
3.
Expansion of Existing U.S. Refineries Is Considerably More Cost-Effective than New Construction………………………………………………………………..29 a.
Building A New U.S. Refinery Costs Substantially More than Expanding An Existing One…………….…………………………………………...30
b.
Recent Announcements Demonstrate the Cost-Effectiveness of Expansion Versus Greenfield Build..………………………………………………..31
c.
“Debottlenecking” Projects Have Added Significant Refining Capacity..31
d.
Summary Comparison of Construction and Expansion Costs…………...33
4.
Anticipated Refinery Expansions Will Add Substantial New Capacity…………34
5.
Refineries Operate at or near Their Practical Maximum Utilization Rates…..….35 a.
Measuring Crude Distillation Capacity Utilization…………….………...35
b.
Refineries Have Increased Their Light Product Production Capabilities..37
6.
High Utilization Rates Have Been Achieved Despite Numerous Obstacles…….38
7.
The FTC’s 2006 Investigation of the Industry Found No Manipulation of Gas Pricing by Refiners………………………………………………………………38 a.
Refinery Capacity Utilization……………………………………………39
b.
Refinery Determination of Product Slate and Quantities………………..39
c.
Product Exports…………………………………………………………..40
d.
Investment in Refinery Capacity…………………………………….…...40
U.S. Refined Product Supply Has Become Increasingly Integrated with Global Markets…………………………………………………………………………………..41 1.
Growing Global and U.S. Crude Oil Demand Places Pressure on Supply………41 TOC-2
2. D.
E.
F.
Growing Imports Cost-Effectively Meet Growing U.S. Demand……………….42
Inventory Practices Have Reduced Costs and Benefited Consumers……………………46 1.
Petroleum Firms Have Reduced Inventories and Reduced Costs Substantially…47
2.
A Recent FTC Investigation Found that Petroleum Firms Do Not Adjust Inventory Levels to Manipulate Gasoline Prices………………………………...52
3.
Requiring Excess Inventory Would Be Costly and Ineffective………………….53
The Profitability of the Oil Industry Is Commensurate with Other Industries Over the Long Run……………………………………………………………………………………….53 1.
Returns on Investment Generally Have Been at or Below the Average for Other Industries…………………………………………………………………………54
2.
Over Time, the Petroleum Industry’s Earnings Have Been Commensurate with Earnings in Other Industries……………………………………………………..57
Conclusion……………………………………………………………………………….58
CHAPTER TWO:
ANTITRUST SCRUTINY OF MERGERS IN THE OIL INDUSTRY…………………………………………………………….60
A.
Merger Activity During the 1990s Was Driven by the Pursuit of ― And Has Achieved ― Significant Efficiencies…………………………………………………………………..61
B.
The FTC Applies Tougher Standards to Mergers in the Oil Industry than to Mergers Elsewhere………………………………………………………………………………...64
C.
Empirical Analyses of the Price Effects of Oil Mergers Provide No Basis for Applying More Stringent Merger Standards……………………………………………………..…70
D.
1.
The GAO Report……………………………………………………....................70
2.
FTC Merger Retrospectives……………………………………………………....75
Creating Industry-Specific Merger Standards Is Poor Public Policy and Unnecessary….76
TOC-3
E.
The Outcome of the Western Refining Case Would Not Have Been Different under Proposals to Shift the Burden of Proof…………………………………………………..78
F.
Conclusion……………………………………………………………………………….79
CHAPTER THREE: SUPPLY SHOCKS AND MARKET RESPONSES……………..….81 A.
Numerous Factors Affect Retail Gasoline Prices………………………………………..81
B.
Market Forces Provide the Most Effective Mechanism for Quickly and Efficiently Alleviating Price Spikes………………………………………………………………….82
C.
D.
1.
Hurricanes Katrina and Rita Had an Unprecedented Impact on U.S. Petroleum Production and Logistics Capacity………………………………………………83
2.
Firms Reacted Quickly to Alleviate Supply Problems Caused by the Hurricanes………………………………………………………………………..87
3.
The Industry’s Mitigation Efforts Resulted in Lower Prices than Would Have Occurred Otherwise……………………………………………………………...90
The FTC’s Oil and Gas Industry Investigations Repeatedly Have Concluded that Market Forces Cause Price Spikes……………………………………………………………….91 1.
The FTC Found that Market Forces Drove Prices Higher Following Hurricanes Katrina and Rita………………………………………………………………….91
2.
The FTC Found No Evidence of Price Gouging or Market Manipulation in Its Midwest Gas Investigation………………………………………………………94
3.
After Investigation of Other Gasoline Price Increases, the FTC Has Concluded that They Are Attributable to Market Forces……………………………………94
4.
Market Forces Are Responsible for the 2007 Price Increases…………………...95
Price-Gouging Legislation Would Harm, Rather than Benefit, Consumers…………….96 1.
Inherent Problems Exist in Attempting to Define Price Gouging……………….96
2.
Prior U.S. Experience Unmistakably Demonstrates that Price Controls Harm Consumers………………………………………………………………………..98
TOC-4
E.
F.
G.
3.
Price Controls Generate Harmful Short-Term Effects………………………….100
4.
Price Controls Cause Harmful Effects Over the Long Run…………………….102
There Are Constructive Legislative Alternatives that Will Benefit Consumers……......103 1.
The Federal Antitrust Authorities Should Continue Their Vigorous Enforcement of the Antitrust Laws…………………………………………………………...103
2.
Government Should Consider Repealing Laws that Harm Consumers by Raising the Cost of Gas at the Pump……………………….………………….………...104
3.
Reducing the Number of Boutique Fuels Would Benefit Consumers………….106
4.
Expediting the Waiver Process During Supply Disruptions Would Quicken the Response of Industry Participants………………………………………………107
5.
Streamlining the Refining Permitting Process Would Enhance Incentives to Expand Capacity………………………………………………………………..108
NOPEC Presents Enforcement Difficulties and Will Result in Harmful Unintended Consequences…………………………………………………………………………...109 1.
Sovereign Immunity and Act of State Doctrine Raise Foreign Policy Issues…..109
2.
Antitrust Suits Aimed at OPEC Raise Practical Enforcement Challenges…...…110
Conclusion...……………………………………………………………………….…....111
TOC-5
FOREWARD: SETTING THE STAGE Few industries affect consumers as much as petroleum. Indeed, energy consumption is woven into the fabric of daily life in the United States, and supply shocks can cause price increases that result in very real economic pain. Not surprisingly, these price spikes prompt citizens to look to the government for answers. Those answers can take many forms, including legislation to regulate the conduct of oil companies. Before considering legislative answers to consumers’ concerns, however, we should understand the role of antitrust enforcement in preserving competition in this and other industries, as well as various important – and often misunderstood – characteristics of the oil industry. In this Foreward, we set the stage for subsequent chapters by discussing the evolution of economic learning and antitrust enforcement, and by providing an overview of the FTC’s vigorous enforcement of the antitrust laws in the petroleum industry. A.
Economic Learning and Antitrust Enforcement Have Evolved: We Now Know that Big Is No Longer Necessarily Bad.
The economics literature provides no basis for concluding that market power exists based largely on concentration levels. Relying on this fundamental insight of modern economics, the antitrust enforcement agencies recognize that factors other than concentration are relevant in analyzing the competitive effects of conduct and mergers, even in highly concentrated markets. The following statements convey the representative views of economists on this issue:
2
•
The “empirical evidence is too inexact to allow us to determine the correct market-share standards that should trigger enforcement concerns and … theory gives us little if any guidance in choosing specific market-share or concentration levels that are likely to lead to poor economic performance.”2
•
“In evaluating antitrust policy … practitioners will need to combine a knowledge of the technical niceties with a sound understanding of the workings of actual markets.”3
Paul Pautler, The Economic Basis for A Broad Based Horizontal Merger Policy, 28 ANTITRUST BULL. 571 (1983).
3
Drew Fundenberg and Jean Tirole, NonCooperative Game Theory for Industrial Organization: An Introduction and Overview, in HANDBOOK OF INDUSTRIAL ORGANIZATION 259, 322 (Schmalensee and Willig eds., 1989).
1
•
There is no credible study indicating there ought to be a presumption of market power in markets with HHIs over 1800.4 “Determinants of … behavior are varied and complex and … a simple change in premerger and postmerger concentration levels provides little basis for predicting changes in market conduct and performance.”5
•
“You have to be very wary in drawing an inference between the vigor of competition and concentration. Highly concentrated industries can be very competitive and industries with low concentration can be very noncompetitive.”6
The history of the movement away from structural to more qualitative considerations is instructive. Through the early 1970s, most economists believed that high levels of concentration were harmful. Numerous studies had shown that large firms in concentrated industries earned higher (accounting) profits, and thus it seemed sensible to attack high or growing levels of concentration as a threat to economic well being.7 Many economists, public officials, and legislators supported legislation and cases to dismantle corporations in concentrated industries into smaller units. These groups felt that corporations had too much power in a wide range of industries, including computers; automobiles; many grocery manufacturing sectors, including cereals, detergents, and soft drinks; steel; and petroleum refining.8 This attack on concentration was premised on theoretical and empirical flaws. Competition was hypothesized to be a function of the number of firms in an industry. The perfect competition model taught in basic economics textbooks was said to provide the basis for this proposition. In economic theory, dating back to the works of Edward Chamberlain in the 1930s,9 competition was thought only to occur when there were numerous (“atomistic”) sellers.
4
Barry C. Harris & David D. Smith, The Merger Guidelines vs. Economics: A Survey of Economic Studies, in PERSPECTIVES ON FUNDAMENTAL ANTITRUST THEORY, 23, 27 (Jul. 2001). 5
Harris and Smith, supra note 4.
6
See Fed. Trade Comm’n Conference, Estimating the Price Effects of Mergers and Concentration in the Petroleum Industry: An Evaluation of Recent Learning 94 (Jan. 14, 2005) (comments by Dennis Carlton, Professor of Econ., Univ. of Chicago) (hereinafter “Recent Learning”) at http://www.ftc.gov/ftc/workshops/oilmergers/50114foilmergertrans.pdf. 7
These studies and the concentration debate are summarized in INDUSTRIAL CONCENTRATION: THE NEW LEARNING (Harvey J. Goldschmid, et. al. eds., 1974). 8
The 1970s Federal Trade Commission views are summarized and criticized in Wesley J. Liebeler, Bureau of Competition: Antitrust Enforcement Activities, in THE FEDERAL TRADE COMMISSION SINCE 1970: ECONOMIC. REGULATION AND BUREAUCRATIC BEHAVIOR 65 (Kenneth W. Clarkson and Timothy J. Muris eds., 1981). 9
E.H. CHAMBERLAIN, THE THEORY OF MONOPOLISTIC COMPETITION (1st ed. 1933).
2
Strictly speaking, this argument’s focus on levels of market concentration is incorrect. In the perfect competition model, a firm that restricts output will not raise the industry price. Of course, a reduction of one unit must raise price – albeit by a tiny amount – if the total market is large enough. The mere existence of numerous competitors, however, is not the reason that price will be unchanged. Instead, firms in the perfectly competitive market must act to increase output, thus returning price (in the “wink of an eye”) to its previous level. This action, not merely the presence of a large number of firms, creates competition. Although it is easy to envision that a large number of competitors would facilitate such action, focusing on behavior rather than numbers provides a fundamentally different emphasis. A wide range of variables influence this behavior. The number of firms may or may not be one of the more significant variables, depending on the circumstances. A second theoretical flaw of the attack on concentration involves the nature of demand facing an individual firm. In the perfect competition model, firms are price takers. Because they have flat demand curves, they lose all of their sales if they raise prices. In the real world, when firms raise prices, they retain some sales. Virtually all firms, even very small ones, face such a downward sloping demand curve. Although these theoretical flaws were relevant in the debate on concentration, the deconcentration movement foundered primarily on empirical evidence. Among the most important contributions were those of Harold Demsetz.10 For the sake of argument, he accepted as true the widely held belief that large firms in concentrated industries earned higher rates of return. If the reason was market power exercised through higher prices, he hypothesized, then smaller firms in concentrated industries should earn higher rates of return than smaller firms in unconcentrated industries. The smaller firms in concentrated industries would benefit from the lack of competition. If the larger firms in concentrated industries were more profitable because they were more efficient, however, the smaller firms in concentrated industries that lack the efficiency of their larger competitors would not enjoy higher profits than smaller firms in unconcentrated industries. In fact, the evidence supported the efficiency hypothesis. The concentration emperor was found to be without clothes. The most significant book published in the history of the economics of antitrust was Industrial Concentration: The New Learning, a 1974 publication printing the proceedings of a 1973 conference, including the Demsetz paper summarized above. Although a majority of antitrust economists and legal scholars prior to this debate probably believed that concentration was a major problem, that consensus collapsed. The consequences of this lack of consensus reverberate today, particularly in merger policy. Concentration alone is no longer a sufficient premise for attacking horizontal mergers or supporting a claim that a firm has market power. The available empirical evidence supports a concern about concentration itself only at levels significantly above those found in the petroleum industry.
10
Demsetz, supra note 3.
3
The courts and agencies have responded to the shift in economic thinking. Consider merger policy. In the 1950s and 1960s, merger enforcement relied heavily on concentration statistics and structural presumptions. Cases such as United States v. Philadelphia National Bank11 and United States v. Von’s Grocery,12 stood for the proposition that “big is bad” and that mergers in concentrated markets are almost always unlawful. A major shift took place in 1974 with the Supreme Court’s decision in United States v. General Dynamics Corp.13 In General Dynamics, the Court looked past concentration statistics and approved a merger between two of the top ten coal producers in the United States based on facts that undermined the significance of the government’s market share evidence. Following General Dynamics, antitrust enforcers emphasized facts over concentration statistics and structural presumptions. Indeed, “[s]tubborn facts are what changed antitrust law and enforcement after the 1970s.”14 The shift to a fact-based approach to antitrust enforcement was reflected in the U.S. Department of Justice’s 1982 Merger Guidelines. The new Guidelines were a milestone. They incorporated an economically sound analytical structure that was workable in practice and provided clear guideposts for businesses and antitrust practitioners. The 1982 Guidelines laid the foundation for today's merger enforcement. Although improved over the years, the core analytical structure remains the same. Today, “[m]erger analysis depends heavily on the specific facts of each case.”15 Mergers that once would have been ruled unlawful based solely on concentration statistics might now be viewed as procompetitive after fully considering the competitive dynamics at issue. Indeed, modern antitrust analysis requires a thorough assessment of the competitive effects of a transaction.16 A proper analysis of competitive effects must take into account, among other things, merger-related efficiencies, the strengths and weaknesses of each competitor in the market, and the ease of entry into the market. An assessment of these factors requires the application of sophisticated economic principles to complex facts.
11
374 U.S. 321 (1963).
12
384 U.S. 270 (1966).
13
415 U.S. 486 (1974).
14
Timothy J. Muris, Chairman, Fed. Trade Comm’n, Prepared Remarks Before American Bar Association, Antitrust Section, Antitrust Enforcement at the FTC: In a Word - Continuity (Aug. 7, 2001) at http://www.ftc.gov/muris/murisaba.shtm.
15
U.S. Dep’t of Justice and Fed. Trade Comm’n, COMMENTARY ON THE HORIZONTAL MERGER GUIDELINES, Introduction (Mar. 2006) at http://www.usdoj.gov/atr/public/guidelines/215247.htm#5.
16
Id.
4
This fact-based approach to antitrust analysis has been applied to the petroleum industry for decades.17 As the FTC has noted, “Some [petroleum] mergers have led to increased concentration. An increase in concentration from a merger, however, is not by itself a sufficient basis for finding that a merger is anticompetitive. Where concentration changes raise concerns about potential competitive harm, the FTC conducts a more detailed investigation.”18 As noted in the discussion that follows, the FTC's more detailed investigations of oil mergers have examined not only concentration levels but also the likely actions of other competitors in the market, the ease of entry, any merger efficiencies, and other factors relevant to determining a merger’s likely competitive effects in the product and geographic markets at issue. B.
The Antitrust Authorities Scrutinize the Petroleum Industry More Closely than any Other.
The petroleum industry receives closer scrutiny from antitrust authorities than any other industry. Indeed, the FTC has conducted well over 100 investigations into the petroleum industry since 1971 and “has devoted substantial resources to investigating and studying the industry. For example, during the period of large oil industry mergers in the late 1990s, the Bureau of Competition spent almost one-fourth of its enforcement budget on investigations in energy industries.”19 These investigations have examined every facet of the industry and consist of (1) investigations into mergers, (2) investigations into alleged anticompetitive conduct, and (3) reports and studies on the competitive dynamics of the industry. Merger Investigations. Since 1981, the FTC has reviewed hundreds of mergers in the oil industry, has investigated dozens of them in detail, and has challenged 21. These challenges have resulted in divestitures, court-issued injunctions, abandoned transactions, and conditions on future conduct.20 In 2007 alone, the FTC has challenged two mergers in the petroleum industry. •
On March 14, 2007, the FTC approved a final consent order relating to a $22 billion deal in which energy transportation, storage, and distribution firm Kinder Morgan, Inc. (KMI) would be taken private by KMI management and a group of investment firms. The investment firms already held significant positions in Magellan Midstream, a major competitor of KMI in some regions. Consequently, the FTC alleged that “[t]he proposed transaction would threaten competition between KMI and Magellan in eleven metropolitan areas in the Southeast, likely resulting in higher prices for gasoline and
17
See, e.g., FTC REPORT, MERGERS IN THE PETROLEUM INDUSTRY (Sept. 1982) (report summarizing two FTC empirical studies on acquisitions by large petroleum companies from 1971 through 1981) at http://www.ftc.gov/os/2004/08/040813mergersinpetrol82.pdf. 18
Prepared Statement of the FTC before the Joint Economic Comm. of Congress, On Petroleum Industry Consolidation 9 (May 23, 2007) (presented by Michael A. Salinger, Dir., FTC Bureau of Econs.) (hereinafter “Salinger 2007”) at http://www.ftc.gov/os/testimony/070523PetroleumIndustryConsolidation.pdf.
19
Id. at 8.
20
Id. at 5-6.
5
other light petroleum products.”21 To ensure that KMI and Magellan Midstream continued to operate independently and compete, the FTC consent order required the investment firms to convert their interests in Magellan Midstream into passive investments, with additional safeguards.22 •
Less than a month later, the FTC unsuccessfully sought a preliminary injunction in federal court to block Western Refining’s proposed acquisition of Giant Industries, which the agency alleged “would lead to reduced competition and higher prices for the bulk supply of light petroleum products to northern New Mexico.”23
Despite these recent challenges, the FTC continues to note that “most sectors of the petroleum industry generally remain unconcentrated or moderately concentrated.”24 Conduct Investigations. The FTC has expended significant resources investigating allegations of anticompetitive conduct in the petroleum industry. For example, in 2003, the FTC filed a complaint against the Union Oil Company of California (“Unocal”) alleging that Unocal made misrepresentations to the California Air Resources Board (“CARB”) in connection with regulatory proceedings to develop reformulated gasoline (“RFG”) standards that CARB adopted. According to the FTC, Unocal asserted that certain technology was nonproprietary and in the public domain, while simultaneously pursuing patents that would enable it to charge substantial royalties if CARB mandated the use of Unocal’s technology in the refining of CARB-compliant summertime RFG. The FTC obtained its desired relief – Unocal’s agreement to refrain from enforcing its patents – in conjunction with Chevron’s subsequent purchase of Unocal.25 The FTC has conducted other exhaustive investigations into alleged anticompetitive conduct in the oil industry in recent years, including: (1) a nine-month investigation into the price increases following Hurricanes Katrina and Rita; (2) a year-long investigation into Shell’s 2004 decision to close its Bakersfield refinery, based on concerns that the closure was motivated 21
Press Release, FTC, FTC Challenges Acquisition of Interests in Kinder Morgan, Inc. by The Carlyle Group and Riverstone Holdings, (Jan 25, 2007) at http://www.ftc.gov/opa/2007/01/kindermorgan.shtm.
22
TC Group, L.L.C., et al., File No. 0610197 (Mar. 14, 2007) (decision and order) at http://www.ftc.gov/os/caselist/0610197/0610197c-4183_decisionorder_PV.pdf.
23
Press Release, FTC, FTC Files Complaint in Federal District Court Seeking to Block Western Refining’s Acquisition of Rival Energy Company Giant Industries, Inc., (Apr. 12, 2007) at http://www.ftc.gov/opa/2007/04/westerngiant_tro.shtm.
24
Prepared Statement of the FTC before the S. Comm. on the Judiciary, On Petroleum Industry Consolidation (Feb. 1, 2006) (presented by William E. Kovacic, Comm’r, FTC) (hereinafter “Kovacic 2006”) at www.ftc.gov/speeches/kovacic/testimonyrepetroleumindustryconsolidation.pdf. 25
See Press Release, FTC, FTC Charges Unocal With Anticompetitive Conduct Related to Reformulated Gasoline (Mar. 4, 2003) at http://www.ftc.gov/opa/2003/03/unocal.shtm; FTC, Statement In re Union Oil Company of California and In re Chevron Corp. and Unocal Corp. (Aug. 2, 2005) at http://www.ftc.gov/os/adjpro/d9305/050802statement.pdf.
6
by a desire to remove capacity from the market; (3) an investigation into zone pricing and redlining on the West Coast in the late 1990s to 2001; and (4) an investigation into the Midwest gasoline price spike in 2000. In none of these investigations did the FTC find evidence of collusion or market manipulation. Reports and Studies. When Congress created the Federal Trade Commission (FTC) in 1914, it recognized that antitrust regulation involved more than simple rules, and that antitrust problems had to be analyzed with greater sophistication.26 As a result, the FTC’s mandate to protect consumers extends well beyond law enforcement to include information gathering and reporting on major antitrust policy and enforcement issues.27 The FTC has a rich history of competition research and development. By initiating studies, holding workshops, and drafting reports, the Commission has been able not only to explore current competition policy issues, but also to address quickly the issues that have arisen on its agenda.28 The FTC has expended significant resources analyzing policy and enforcement issues in the petroleum industry. Most recently, in April 2007, the FTC organized and hosted a public conference titled “Energy Markets in the 21st Century: Competition Policy in Perspective,” which brought together leading experts from government, industry, consumer groups, and academia “to exchange information and ideas about critical issues related to energy development.”29 Additionally, in June 2005, the Commission issued a report titled “Gasoline Price Changes: The Dynamics of Supply, Demand, and Competition,” which analyzed the many factors that influence fluctuations in the prices of retail gasoline. Indeed, the Commission has issued a number of reports on gasoline prices and market concentration dating back to the early 1980s.30 Consumers have benefited from the FTC’s application of modern antitrust analysis to the petroleum industry, which is characterized by intense competition, innovation, and generally low levels of concentration. Nonetheless, because the industry impacts consumers and the U.S. economy in important ways, the FTC has expended significant resources to examine and analyze the industry carefully to ensure that it remains competitive. In doing so, the FTC relies on sophisticated economic tools and comprehensive fact-gathering techniques to ensure that it can properly assess the competitive effects of activity in the industry and its impact on consumers.
26
Interview with Robert Pitofsky, Former Chairman, FTC, in Washington, D.C. (Sept. 22, 2004).
27
Marc Winerman, The Origins of the FTC: Concentration, Cooperation, Control, and Competition, 71 ANTITRUST L. J. 1, 93 (2003). 28 29
Id. Salinger 2007, supra note 18.
30
See FED. TRADE COMM’N, GASOLINE PRICE CHANGES: THE DYNAMIC OF SUPPLY, DEMAND AND COMPETITION 19 (2006) (hereinafter “GASOLINE PRICE FACTORS REPORT”).
7
*
*
*
*
With this overview of the legal and economic framework, we now turn to specific characteristics of the industry that require further illumination. Chapter 1 provides a factual basis for understanding the industry and the market forces that shape it. Specifically, this Chapter examines concentration levels in the industry relative to other industries, U.S. refining capacity growth, the relationship between U.S. and global supply and demand, the capitalintensive nature of the industry in the United States, and its history of profitability. Chapter 2 explores mergers in the petroleum industry, including a detailed discussion of the FTC’s studies and enforcement actions in this area. Chapter 3 examines the complex factors that affect gasoline prices, provides illustrations of market responses to supply shocks, summarizes the FTC’s investigative findings that price increases are based on market forces, explains why price gouging and other laws that attempt to protect consumers actually harm them, and discusses legislative proposals that would benefit consumers.
8
CHAPTER ONE: KEY ANTITRUST FACTS ABOUT THE OIL INDUSTRY As with any other industry, facts are crucial for applying modern antitrust analysis to the petroleum industry. This Chapter focuses on the key economic issues and characteristics of the industry that have attracted scrutiny from regulators and legislators. We address the primary misconceptions used to justify legislative intervention: that the oil industry is highly concentrated, that it limits production and/or fails to make significant investments in capacity to maintain supracompetitive prices, and that it earns profits significantly out of proportion to those earned in other industries. By detailing industry concentration levels, refining capacity, global supply and demand, inventory management, and industry investment, this Chapter provides a factual basis for understanding the industry and the market forces that shape it. As an overview, the data provided in this Chapter reveal that: •
The merger wave of the late 1990s and early 2000s only slightly increased concentration, and most levels of the oil industry remain largely unconcentrated or only moderately concentrated. Indeed, oil industry concentration, including in the refining and retailing segments, remains well below the levels of many other competitive U.S. industries.
•
U.S. refiners consistently have invested billions of dollars to increase refining capacity, improve output, and meet environmental requirements. As a consequence of these investments, domestic refining capacity expansion has kept pace with global capacity growth. From 1994 through 2004, the industry added the equivalent of 20 new, average-sized refineries, and industry analysts anticipate that domestic refiners will add the equivalent of another eight such refineries by 2012. U.S. refineries generally operate at or near their practical maximum utilization rate.
•
The United States benefits from access to a global market for crude oil and refined products. The importation of refined products from outside the United States has provided a cost-effective means of satisfying growing U.S. demand.
•
The oil industry has maintained inventory levels to ensure high supply reliability, while using modern strategies to manage inventory storage and carrying costs more efficiently.
•
Oil industry profits and rates of return on investment (“ROI”) are cyclical, with industry profits and ROI at or below levels for other industries over time. Recent relatively high oil industry ROI and profits have followed years of significantly below average ROI and profits in the 1990s.
9
Finally, the Chapter discusses the extensive investigations of petroleum industry practices that the Federal Trade Commission (“FTC” or “Commission”) has undertaken, and describes the Commission’s findings that there is no evidence that the U.S. oil industry seeks to restrain capacity through reduced refinery investment, refinery utilization run rates, or manipulation of inventories. To the contrary, based on its investigations, the Commission found that the industry has invested in increasing U.S. refinery capacity, sought to maximize refinery utilization rates, and maintained inventories consistent with “best practices” across industries. Section A provides a detailed analysis of oil industry concentration at various levels, as well as a comparative view of oil industry concentration relative to other U.S. industries. Section B describes U.S. refinery capacity growth and capacity utilization rates. Section C explains the interrelated nature of the U.S. and global crude oil and refined product markets, and the manner in which imports cost-effectively address growing U.S. demand. Section D examines inventory strategies that petroleum firms have employed to lower costs while maintaining high supply reliability levels. Section E concludes the Chapter with a review of oil industry investment, rate of return, and profits. A.
The American Petroleum Industry Is Not Highly Concentrated
The American petroleum industry is not highly concentrated. Indeed, compared to a wide range of other U.S. industries, oil industry concentration is significantly lower. Using concentration as an initial screen, modern antitrust practitioners would conclude that the vast majority of the oil industry is unlikely to present competitive problems. Further, even when concentration is relatively high, it remains only an analytical starting point. Other facts, including entry conditions and the nature of competition between industry firms, are more important. In the discussion that follows, we provide data on concentration for the different levels of the oil industry, and offer a comparative view of concentration in the gasoline refining and retailing segments relative to concentration in other industries. A discussion of recent merger activity statistics and the trend toward less vertical integration in the industry follows. We conclude this section with a brief summary of modern antitrust and economic thinking on using concentration levels to assess market power. 1.
Concentration Levels Are Low to Moderate
In 2004, the FTC released its third report on mergers and structural changes in the petroleum industry. The Commission concluded “that mergers of private oil companies have not significantly affected worldwide concentration in crude oil, and that concentration for most levels of the petroleum industry has remained low to moderate.”31 In testimony before Congress 31
Market Forces, Competitive Dynamics, and Gasoline Prices: FTC Initiatives to Protect Competitive Markets before the Subcomm. on Oversight and Investigations of the H. Comm. on Energy and Commerce 22 (May 22, 2007) (presented by William E. Kovacic, Comm’r, Fed. Trade Comm’n) (hereinafter “Kovacic Market Forces 2007”) at http://www.ftc.gov/os/testimony/070522FTC_%20Initiatives_to_Protect_Competitive_Petroleum_Markets.pdf.
10
earlier this year, the FTC reiterated this conclusion, stating that “[d]espite some increases over time, concentration for most levels of the United States petroleum industry has remained low to moderate.”32 The U.S. antitrust agencies measure the concentration of an industry by using the Herfindahl-Hirscchman Index (“HHI”), which equals the sum of the squared market shares of all market participants in what the agencies determine as the relevant product and geographic markets. Concentration levels range from 1 (in an infinitely atomistic market) to 10,000 (in a monopoly market). The agencies consider a market with an HHI of 1,000 or less “unconcentrated,” a market with an HHI between 1,000 and 1,800 “moderately concentrated,” and a market with an HHI above 1,800 “highly concentrated.”33 Concentration levels (in a properly defined antitrust market) remain only the starting point for merger (and market power) analysis, as the antitrust agencies and the courts recognize that other factors are more important for determining the ability of firms to exercise unilateral or collective market power. As the Horizontal Merger Guidelines state, “because the specific standards set forth [here] must be applied to a broad range of possible factual circumstances, mechanical application of those standards may provide misleading answers to the economic questions raised under the antitrust laws.”34 As antitrust enforcement has progressed, merger and market power analysis has relied significantly less on concentration data and more on qualitative analysis of various factors, including ease of entry or expansion, the ability to restrict supply output without engendering increased output by competitors, and the effect that cost savings and efficiencies have on a firm’s willingness to restrict output. a.
Exploration and Production
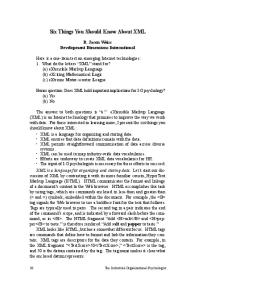
As Table 1-1 reveals, individually, oil companies hold very small shares of world crude oil production and reserves, and world concentration in crude oil and natural gas liquids (‘NGL”) has fallen since 1985.35 Concentration studies of crude oil production use either current production or reserves and employ either a company or country basis.
32
Id. at 5. See also Salinger 2007, supra note 18. (“Most sectors of the petroleum industry generally remain unconcentrated or moderately concentrated.”)
33
As examples, an industry with 10 equally-sized firms has an HHI of 1000; an industry with five equally-sized firms has an HHI of 2000. U.S. Dep’t of Justice and Fed. Trade Comm’n, 1992 Horizontal Merger Guidelines (Section 4 on Efficiencies revised April 8, 1997), reprinted in 4 Trade Reg. Rep. (CCH) ¶¶ 13, 104 (hereinafter “Merger Guidelines”).
34
Id. at § 0.
35
FED. TRADE COMM’N, THE PETROLEUM INDUSTRY: MERGERS, STRUCTURAL CHANGE, AND ANTITRUST
ENFORCEMENT 132 (Aug.
2004) (hereinafter “OIL MERGER REPORT”). In most circumstances, the market for crude oil production and reserves is likely to be global. See Id. at 129-131.
11
Table 1-1 Crude Oil and NGL Production and Reserves: Concentration Levels 1990
2002
World Production / Company
527
276
World Production / Country
610
417
World Crude Reserves / Company
1100
769
World Crude Reserves / Country
1052
812
Source: FTC Oil Merger Report, Tables 5-3, 5-4, 5-6; sourced from Petroleum Intelligence Weekly and EIA, International Energy Annual, Table G1.
•
Based on company ownership, world production concentration decreased from an HHI level of 527 in 1990 to 276 in 2002; and the U.S. share of world crude oil production declined from 11.5 percent in 1990 to 8.3 percent in 2002.36
•
Based on country ownership (to reflect the importance of national ownership), the HHI for world production concentration declined from an HHI level of 610 in 1990 to 417 in 2002.37
•
Measuring reserves, the concentration of company ownership of world crude oil reserves has decreased from 1,100 in 1990 to 769 in 2002.38
•
Using a country basis for crude oil reserves, the HHI decreased from 1,052 in 1990 to 812 in 2002.39
Thus, concentration levels in exploration and production have fallen in the unconcentrated ranges. Recent large mergers among major U.S. oil companies have had little impact on concentration in world crude oil production and reserves.
36
Id. at 135, 145, Table 5-3.
37
Id. at 148, Table 5-4.
38
Id. at 151, Table 5-6.
39
Id. at 153, Table 5-7.
12
•
When Exxon and Mobil combined in 1998, they held market shares of worldwide crude oil production of 2.1 percent and 1.3 percent respectively.40 In 2002, the combined ExxonMobil’s share of the worldwide crude oil market was 3.3 percent.41 The merger increased the HHI from 288 to 293.42
•
The 1998 merger of BP and Amoco combined their 1997 worldwide production shares of 1.7 percent and 0.9 percent respectively, increasing the HHI from 314 to 317. Adding the subsequent acquisition of ARCO in 2000 (inclusive of its divestiture of ARCO’s ANS assets to Phillips), the merged entity’s share reached 2.7 percent.43
•
The 2005 merger of Chevron and Unocal combined firms with only 2.7 percent of world crude oil production, 0.77 percent of world crude oil reserves, 11.3 percent of U.S. crude oil production, and 11.4 percent of U.S. crude oil reserves.44
While the world crude oil market has remained largely unconcentrated, OPEC’s share of world production has fluctuated, with its share of the market tied largely to the growth or decline in production of non-OPEC countries. OPEC’s share of world production fell from a peak of 54 percent in 1974 to 30 percent in 1985, with a subsequent increase to about 41 percent by 2000.45 OPEC’s market share of worldwide crude oil reserves has varied similarly, ranging from 67.2 percent in 1973 to a peak of 79.2 percent in 2000, with a subsequent decline to 67.5 percent in 2002.46 Domestic concentration in crude oil production has remained unconcentrated for both production and reserves. Between 1990 and 2002, ownership of U.S. crude oil and natural gas liquids (“NGL”) production remained at very low levels, with HHI levels of only 284 (1990) and 297 (2002).47 During the same time period, ownership of crude oil reserves in the United States remained very dispersed; concentration was 333 in 1990, and 366 in 2002.48
40 41 42 43
Id. at 5. Id. Id. at 135. Id.
44
Statement of the Federal Trade Commission In the Matter of Union Oil Company of California and In the Matter of Chevron Corporation and Unocal Corporation (Aug. 2, 2005) at http://www.ftc.gov/os/caselist/0510125/0510125.shtm. 45
Id. at 137-38.
46
Id. at 155, Table 5-9.
47
Id. at 140, 156, Table 5-10.
48
Id. at 140, 158, Table 5-11.
13
b.
Crude Oil Bulk Transport
Petroleum companies usually transport crude oil using crude oil tankers (for ocean transport) or pipelines (to transport product from domestic fields or from import centers/ports to refineries). Interstate crude oil pipelines generally remain highly regulated by the Federal Energy Regulatory Commission (“FERC”), which requires that interstate pipeline services be provided on a non-discriminatory basis;49 states impose similar regulations for intrastate lines. While difficult to assess concentration at this level, the following data provide general guidance. •
In 2001, the Oil and Gas Journal, which publishes an annual survey of U.S. crude oil and refined product pipelines, listed 80 pipeline companies that shipped crude oil in the United States, a number largely unchanged since 1985.50
•
On a national basis, the HHI for crude oil transport in the United States fell from 1,077 in 1985, to 964 in 1995, before increasing to 1,225 in 2001.51 c.
Refining
While relevant geographic markets for the downstream segments of the petroleum industry rarely correspond to the nation, PADDs,52 or states, concentration levels for these regions provide a starting point for assessing concentration and trends in these market segments. As Figure 1-1 reveals, refining concentration for the United States remains low, even after increasing modestly since 1996. As a first, albeit imperfect, approximation of relevant geographic markets, the table presents data individually for PADDs III, IV, and V, and on an aggregated basis for PADDs I and II, and PADDs II and III. Any investigation of refining activity in PADDs I or II likely would include refineries in PADD III because PADD III supplies both PADDs I and II, principally via pipelines. HHI concentration levels for refining remain in the unconcentrated or lower end of the moderately concentrated range.53
49
Proprietary pipelines that ship only owned product do not have to file tariffs with FERC, but remain subject to its jurisdiction.
50
OIL MERGER REPORT, supra note 35, at 166.
51
Id. at 175, Table 6-4.
52
The United States consists of five PADDs: PADD I is comprised of the East Coast; PADD II the Midwest; PADD III the Gulf Coast; PADD IV the Rocky Mountain region; and PADD V the West Coast plus Alaska and Hawaii.
53
OIL MERGER REPORT, supra note 35, at 205, Table 7-7; FED. TRADE COMM’N, INVESTIGATION OF GASOLINE PRICE MANIPULATION AND POST-KATRINA GASOLINE PRICE INCREASES 25, Table 1-4 (2006) (hereinafter “GASOLINE PRICE REPORT”). (Unless otherwise noted, all data for the PADD HHIs that follow come from these two references.)
14
•
For PADDs I and III combined, the concentration level has risen since 1985, but remains at the unconcentrated level – the HHI was 561 in 1990, 741 in 2000, and 991 in 2005.
•
For a combined PADD II and III the concentration level was 455 in 1990, 681 in 2000, and 1,080 in 2005.
•
The HHI level for PADD III was 578 in 1990, 851 in 2000, and 1,080 in 2005.
•
The HHI level for PADD IV has risen and then declined over time, starting at 1,080 in 1990 and rising to 1,179 in 2000, before declining to 935 in 2005.
•
The HHI level for PADD V has remained in relatively the same range, starting at 965 in 1990, rising to 1,148 in 2000, and remaining essentially the same at 1,194 in 2005.
Figure 1 - 1 Regional Refining Concentration Trends 1800 1600
Concentration Levels (HHI)
1400 1200
1990
1000
2000 800
2005
600 400 200 0 PADD III
PADD IV
PADD V Regions
15
PADDs I & III
PADDs II & III
Shares of refining capacity among U.S. firms remain low. At the national level, Valero has the largest share with 13 percent, ConocoPhillips has 12.9 percent, and ExxonMobil has 11.4 percent.54 Shares at the PADD level, while somewhat higher, also have remained modest. For example, Valero has its largest share in the combined PADDs I and III, at 15.8 percent.55 RoyalDutch/Shell has the largest share in PADD III at 18.5 percent, and different refining companies have the leading share for areas in Figure 1-1 at levels below this share.56 “Even in California, the largest refiner, ChevronTexaco, has only a capacity share of 25.1 percent, and faces competition from six other significant competitors.”57 In 2006, the FTC found that the refining industry had remained relatively unconcentrated, with no refiner holding a substantial share of refining capacity nationally or regionally.58 d.
Refined Petroleum Product Transport
Refineries ship the vast majority of their refined product to storage terminals from which trucks subsequently distribute the product to local gasoline stations.59 Refineries rely on pipelines for the majority of bulk transport of refined products to terminals within the United States, with transportation by water supplementing this transport for certain locations.60 From 1985 to 2001, the HHI for petroleum products pipelines remained essentially constant at around 530 from 1985 to 1995, and then increased to 734 in 2001, remaining in the unconcentrated category.61 According to the Oil and Gas Journal, in 2002, more than 70 companies with pipelines carried refined products within the United States, with joint ventures controlling many pipeline companies. e.
Retailing/Gasoline Marketing
Similar to other segments, data regarding concentration trends in appropriately defined relevant antitrust markets for retail gasoline is not available. Nevertheless, data show that most
54 55
GASOLINE PRICE REPORT, supra note 53, at 25, Table 1-4. Id.
56
Id. (including the combined PADDs I and III, and PADDs II and III).
57
Id. at 16-17.
58
Id.
59
OIL MERGER REPORT, supra note 35, at 209; Id. n.1 (most refiners also dispense small quantities of refined products into trucks at refinery racks for local wholesale and retail distribution). 60
Id. at 210 (shipment by pipeline has increased, while water shipments have declined over time).
61
Id. at 218, Table 8-3 (based on Oil and Gas Journal annual “Pipeline Economics” data).
16
states are unconcentrated or only moderately concentrated.62 Of the 49 continental states and the District of Columbia, only seven states have statewide retail concentration above 1800. Most states, 34, are only moderately concentrated, and eight are unconcentrated. (See Figure 1-2.) Moreover, independents and hypermarkets, such as Costco and Wal-Mart, have brought significant new competition into the retail gasoline market and gained substantial market share in only a few years. (See Section 1. A. 4. for additional detail.)
Number of States
Figure 1 - 2 Retail Gas Sales: State Level Concentration 40 35 30 25 20 15 10 5 0
34
8
7
Unconcentrated: Less than 1,000 Moderately Concentrated: 1,000 1,800
Highly Concentrated: Greater than 1,800
HHI Measure
2.
Other U.S. Industries Are as or More Concentrated
The U.S. refining and the retail gasoline industries rank among the least concentrated U.S. industries. The share of the four largest companies in the refining industry stands at 59.4 percent. The share of the four largest companies in the retail gasoline industry stands at 62 percent.63 As Figure 1-3 reveals, the share of the four largest companies in the fast food (66.9 percent),64 automobile (74.2 percent),65 light bulb (77.3 percent),66 carpet (84.4 percent),67 carbonated soft 62
Lundberg Taxable Sales Data, December 2004.
63
The available market share data for most industries are compiled using the assumption that the companies compete across the United States, rather than in regional or local markets. This assumption is reasonable for most industries listed and contained in the attached charts and table (e.g., automobiles). When applied to the oil industry, however, this assumption would understate concentration because retail and refining markets are not national. While the FTC views the geographic scope of retail markets as generally more localized than the state level, we use state level data because they are the only non-national retail data available, and the FTC itself has used these data to provide a more accurate picture of concentration levels than national data. For refining data, we use the PADD numbers. The refining and retail numbers are a weighted average. 64
Computed from Datamonitor data (Oct. 1, 2004).
65
Computed from Datamonitor data (Oct. 1, 2004). 17
drink (94.8 percent),68 and brewing (84.2 percent)69 industries, as well as many others, are more concentrated than either the refining or gasoline retail industries. Movie studios (52.2 percent)70 and pharmaceuticals (61.5 percent)71 rank among the few less concentrated sectors.
Figure 1-3 U.S. Petroleum Markets Are Not Highly Concentrated Combined U.S. Market Shares of Largest 4 Firms 120
Four Firm Concentration Ratio
100
80
60
40
20
66
Computed from IBIS World (2003).
67
Computed from Floor Covering Weekly (July 15/25, 2005).
68
Computed from Beverage Digest (Mar. 4, 2005).
69
Computed from Beverage Marketing (Aug. 1, 2005).
70
Computed from BoxOfficeMojo.com (figures for Jan. 1, 2005 through Oct. 23, 2005).
71
Computed from Epsicom Business Intelligence Pharmaceuticals (Feb. 1, 2005).
18
s Ti re
or es Cl ea ne Bo rs ok St or es Fa st Fo od Au to m ob ile s Li O gh ffi ce tB ul Su bs pp ly St or es Di st ille rie s Br ew er ie s La C un ar dr pe y ts Ap pl ia nc C es ar C bo i ga na re te tte d s So ft D rin ks uu
m
St
lin g y
Va c
Re
ta i
tic in e
ol as G
To
al s
ng in i
ac eu
ar m
St
or es O
g ru D
il Re f Ph
M
ov
ie
St
ud i
os
0
Concentrations based on industry HHIs at the “national” level show similarly that gasoline refining (HHI of 1264)72 and gasoline retailing (HHI of 1250)73 have concentration levels significantly lower than those found in other industries, such as brewers (HHI 3,141),74 carbonated soft drinks (HHI 3,109),75 carpets (HHI 2,564),76 pharmaceuticals (HHI 1,294),77 and automobiles (HHI 1,660),78 among others. 3.
Recent Merger Activity Has Occurred Largely at the Exploration and Production Level, the Most Unconcentrated Level of the Industry
Approximately 2,600 transactions occurred across all segments of the U.S. petroleum industry in the 1990s.79 The overwhelming majority of these merger transactions, 85 percent, occurred in the upstream segment of exploration and production, a segment which critics and proponents of the industry alike consider highly competitive.80 Mergers in the downstream segment of refining and marketing of petroleum accounted for only 13 percent, with the midstream segment, transportation, accounting for about two percent.81 Additionally, most of these transactions were not significant. Instead, they consisted of small asset transfers or the acquisition of small business units, none of which was likely to raise concentration levels dramatically. About 80 percent of these merger transactions involved one company’s purchase of a business segment or asset of another, with only 20 percent involving
72
The “national” refinery HHI is an average of the HHIs of the five PADDs, weighted by PADD capacities. We believe this “national” concentration figure provides a more accurate depiction of refinery concentration in the United States than treating the nation as the relevant geographic market. The weighted average is superior because it eliminates the downward bias on concentration that would otherwise result from the limited geographic presence of most refiners. The FTC uses a “national” HHI of 797 for the refining industry, while also providing the HHI for individual and combined PADDs. We reference the FTC’s unweighted “national” figure in the text to provide information on the “national” unweighted trend over time.
73
Computed using Lundberg Taxable Sales data, by state, for December 2004 (weighted average of all states).
74
Computed from Beverage Marketing (Aug. 1, 2005).
75
Computed from Beverage Digest (Mar. 4, 2005).
76
Computed from Floor Covering Weekly (July 15/25, 2005).
77
Computed from Epsicom Business Intelligence Pharmaceuticals (Feb. 1, 2005).
78
Computed from Datamonitor data (Oct. 1, 2004).
79
Energy Markets: Factors that Influence Gasoline Prices before the H. Subcomm. on Oversight and Investigations, Comm. on Energy and Commerce 7 (May 22, 2007) (statement of Thomas McCool, Director Applied Research and Methods, Gov. Accountability Office) at http://www.gao.gov/new.items/d07902t.pdf.
80 81
Id. Id. at 8.
19
the acquisition of one company’s total assets by another.82 The vast majority of reported transaction values were below $50 million, with the overwhelming majority valued at less than $10 million.83 Further, the U.S. Energy Information Administration (“EIA”) identifies only a small number of meaningful refinery purchases and sales outside of whole company transactions,84 and the FTC carefully scrutinizes such refinery transactions. A key determinant of whether a merger will be anticompetitive is whether output will be restricted. Notably, over the last decade, even as the merger wave crested, refinery capacity has increased dramatically, as Figure 1-4 reveals.
Figure 1 - 4 Total Capacity (mmbd) of Operable U.S. Refineries from 1985 - 2006 17.3 16.8 16.3 15.8 15.3
82
20 05
20 03
20 01
19 99
19 97
19 95
19 93
19 91
19 89
19 87
19 85
14.8
ENERGY MARKETS: EFFECTS OF MERGERS AND MARKET CONCENTRATION IN THE U.S. PETROLEUM INDUSTRY, General Accounting Office, at 7 (GAO-04-96, 2004) (hereinafter “GAO REPORT”). Subsequent to the issuance of this report, the General Accounting Office became the Government Accountability Office.
83
Id. at 39.
84
See GASOLINE PRICE REPORT, supra note 53, at 27, Table 1-6.
20
4.
The Petroleum Industry Has Become Less Vertically Integrated as Asset Dispositions and Entry Have Occurred
In the past two decades, the petroleum industry has become less vertically integrated, with companies operating at fewer levels of the production to retailing continuum. This change has occurred as more companies enter (and operate) at only one level of the industry, and as asset dispositions increased among large petroleum companies.85 Consumer advocates and others concerned about increasing vertical integration have their facts wrong. While they may be concerned that integrated refiners will limit supply to independent retailers, or that producers will limit crude oil to unaffiliated refiners, trends in the disaggregation of ownership of industry assets, as well as low levels of concentration generally, suggest this concern is misplaced. Vertical integration between crude oil production and refining has declined among the major oil companies. Spot and future markets have reduced the risks of acquiring crude oil through market transactions, diminishing refiners’ incentives to rely on vertical integration.86 Additionally, as domestic crude oil production has fallen, refiners have tended to depend less on their own crude oil production and increasingly more on foreign imports. Significant refiners such as Valero, Sunoco, and Tesoro have no crude oil production.87 These three large nonintegrated refiners accounted for 21.1 percent of U.S. refining capacity in 2005.88 On the other side of the coin, crude oil producers such as Anadarko and Devon own no refineries. Through its review of merger transactions and its analysis of the industry, the FTC has observed that several major, integrated firms have restructured to concentrate on one or more segments of the industry, and other unintegrated refiners or retailers have entered.89 Additionally, “[s]ome significant independent refiners have built market share by acquiring refineries that were divested from integrated majors pursuant to FTC enforcement orders.”90
85
OIL MERGER REPORT, supra note 35, at 20-21 (from 1991 to 1996 asset dispositions were more prevalent than acquisitions among large petroleum companies); Kovacic 2006, supra note 24, at 3 (“A number of major integrated firms have restructured to concentrate on one or more segments of the industry, and a number of unintegrated refiners or retailers have entered.”). 86
Id. at 11, 140 (more freely traded and available product has generated more certainty and alternative supply sources).
87
Id. at 11.
88
API Basic Petroleum Data Book, § VIII, Table 11 (2007).
89
Salinger 2007, supra note 18.
90
Id. at 7.
21
Within the storage, transportation, and marketing segment, disaggregation of ownership has occurred. For example, many refiners and marketers have sold terminals: Conoco and Murphy Oil sold six terminals to Colonial Pipeline in 1998; BP Amoco sold a Michigan terminal to Buckeye Partners in 2000; Shell sold five product terminals to Kinder Morgan in 2003; and Shell sold six product terminals to Magellan Midstream partners in 2004.91 Additionally, the FTC frequently has required the sale of product terminals when it has had evidence that a merger of two petroleum companies with overlapping terminals likely would lessen competition.92 Further, since 2000, firms such as Kinder Morgan and Enterprise, with no refining or marketing assets, have acquired refined petroleum product pipelines.93 The growth of independents and hypermarkets at the gasoline marketing wholesale and retail levels has been especially noteworthy.94 New entrants began emerging in the 1980s and accelerated in the 1990s, with independents such as WaWa, QuikTrip, RaceTrac, Sheetz, and many others using the model of a large convenience store with multiple fuel islands and product dispensers. As private brand retailers with high-volume, low-price gasoline, these independents captured significant retail market share from traditional branded gasoline outlets.95 Thus, today refiners and marketers are selling less gasoline at stations they own in most geographic regions. Independent retailers, such as WaWa and Sheetz, purchase significant quantities of refined product on the open market. Moreover, outside of the West Coast, the percentage of gasoline sold by refiners at owned stations has declined, and the share sold at terminals to jobbers96 has increased.97 Moreover, hypermarkets, mass-merchandise retailers (notably Wal-Mart), and membership clubs (notably Costco) gained significant market share in the late 1990s, capturing nearly six percent of U.S. retail gasoline sales in the five years ending in 2002.98 Hypermarket sites can sell 500,000 to 1,000,000 gallons of fuel in a month, five to ten times the volume of a 91
GASOLINE PRICE REPORT, supra note 53, at 116.
92
The FTC has required numerous terminal sales, including in the following mergers: Valero/Kaneb (2005), Magellan/Shell (2004), Phillips/Conoco (2002), Exxon/Mobil (1999), BP/Amoco (1998), Shell/Texaco (1997), and Texaco/Getty (1984).
93
OIL MERGER REPORT, supra note 35, at 213.
94
Salinger 2007, supra note 18, at 9.
95
OIL MERGER REPORT, supra note 35, at 232.
96
A jobber is “someone who purchases refined products at the wholesale level and then transfers or resells the product at the retail level. The retail level sale/transfer can occur at facilities owned by the jobber, independent dealers, or commercial accounts.” OPIS.net, glossary of terms at http://www.opisnet.com/market/glossary.asp#J.
97
OIL MERGER REPORT, supra note 35, at 11-12 (nationally, the share of gasoline distributed by jobbers increased from 55 percent to 61 percent between 1994 and 2002). 98
Id. at 233, 239 (as of fourth quarter 2002).
22
typical gasoline retailer,99 and thus can substantially impact a market. As of July 2006, hypermarkets had an approximately 9.2 percent share of the total U.S. market; by 2008, hypermarkets are projected to sell 12.6 to 15.4 percent of the motor fuels purchased in the United States.100 5.
Concentration in the Petroleum Industry Is Not at Levels Likely To Impact Competition and Prices
As the previous discussion illustrates, concentration levels within the petroleum industry remain at low to moderate levels. While the merger wave of the 1990s impacted the oil industry, the overwhelming majority of these mergers occurred in the exploration and production sector, which remains unconcentrated. In segments such as refining in which concentration increased modestly, concentration generally remains below the levels found in other competitive industries. Additionally, new entry has occurred within the petroleum industry, expanding competition in several segments, most notably retailing. Further, irrespective of the oil industry’s modest concentration levels, the economics literature does not provide a firm rationale for finding market power based largely on concentration levels. Consistent with this literature, the Merger Guidelines recognize that factors other than concentration are relevant in analyzing the competitive effects of mergers even in highly concentrated markets. Thus, the antitrust enforcement agencies and leading economists have reduced their reliance on market concentration levels to assess market power. Moreover, at the low to moderate HHI levels found in the petroleum industry, the modern antitrust and economic literature provides no empirical support for market power concerns. While concentration levels remain a starting point for antitrust analysis, the antitrust agencies have, and continue to, delve much further to analyze oil industry mergers and company conduct/practices – examining market forces and firm behavior in relevant geographic and product markets. As discussed in the Foreward, based on intensive review of oil industry mergers, as well as in-depth examinations and investigations of the industry, the FTC has found no relationship between concentration changes and gasoline prices. B.
Refiners Have Expanded Domestic and Global Capacity Significantly
World light petroleum products production continues to increase through both the construction of new refineries and the expansion of existing facilities. Recently built refineries and proposed new ones are situated largely in fast-growing, emerging markets such as the Far and Middle East, not in the slower-growing, mature economies of the United States and Western Europe. The total costs of constructing and operating a new refinery (including the costs of permitting) are generally lower in these emerging markets.
99 100
Id. at 239. Outlook for U.S. Fuels Bus. & Hypermart in Retail Bus. Study, Energy Analysts Int’l (2006).
23
Despite higher costs in the United States, domestic refinery capacity expansion has kept pace with capacity growth in the rest of the world. From 1994 to 2004, investments by U.S. refiners increased domestic crude distillation capacity by 12 percent and light petroleum product production by 16 percent.101 The industry added the equivalent of 20 new, average-sized refineries in the United States during this period.102 That U.S. petroleum companies have increased capacity in the United States through the expansion of existing refineries, rather than through the construction of greenfield facilities, should not detract from the significance of these expansions. Building a new U.S. refinery is extraordinarily expensive and time consuming. The significant costs associated with greenfield construction include approvals, building new infrastructure, and bearing the risks of litigation and public opposition. In contrast, U.S. petroleum companies can add capacity to existing facilities faster and more cost-effectively. Public announcements indicate that while greenfield refinery capacity in the United States can cost conservatively as much as $19,000 per daily barrel of output, substantial capacity expansion projects typically cut that cost considerably, and minor expansions cost significantly less. The cost metrics for expansion versus new build explain U.S. refiners’ preference for capacity growth through expansion and innovation. U.S. refiners have invested tens of billions of dollars in recent decades not only to increase refining capacity, but also to improve output and meet environmental regulations. For example, U.S. refineries have used innovations in refining technology to increase the yield of light petroleum products obtained from the same volume of inputs. On average, a barrel of crude oil and other inputs processed by U.S. refineries yielded 0.816 barrels of light petroleum products in 2004, exceeding the 0.788 barrels produced in 1994.103 U.S. refiners also have
101
See Table 1-26. In the mid-1990s, projected growth in U.S. demand for this period was only 14 percent. Demand subsequently increased by 21 percent, and growing imports complemented U.S. production to satisfy the increased demand. Much of the data used in this section compares petroleum firm operations from 1994 to 2004. We chose this period to illustrate recent operational changes and trends in the industry because the massive impacts of Hurricanes Katrina and Rita, discussed in Chapter Three, distort many statistics for 2005 and 2006. Thus, we believe the ten-year period from 1994 to 2004 provides a more accurate picture of trends in the petroleum industry. 102
The average-sized refinery produces 125,000 barrels per day. By “average-sized” we assume a refinery of 125,000 (slightly greater than the average-sized refinery in 2005). 103
See Figure 1-6. Light crude oil yields a greater percentage of higher value products such as gasoline and distillate through simple distillation than does heavy crude oil. Sweet crude oil has less sulfur and corrosive elements than sour crude oil. Technology improvements enable refineries effectively to utilize lower-cost, heavier sour crude oils and handle different feedstocks on short notice.
24
invested billions of dollars to modify plants to produce an array of new boutique fuels and to comply with other product quality specifications mandated by government authorities.104 U.S. refineries generally operate at or near their practical maximum utilization rates, running at approximately 93 percent from 1994 to 2004. A refinery cannot safely and efficiently operate all of its equipment 100 percent of the time for several reasons, including seasonal changes in the product mix, routine maintenance, major maintenance every three to seven years,105 and unplanned equipment failures. The sustained high utilization rates of U.S. refineries are particularly noteworthy given the significant modifications to refining infrastructure that have been undertaken in recent years. While beneficial, and in many instances mandatory, these modifications impact utilization rates. In 2006, as part of the investigation that Congress directed the FTC to conduct concerning gasoline pricing and refinery issues, the Commission examined closely many aspects of refinery operations — notably whether refiners restricted supply by running refineries below capacity, altering their product slate or quantities, or diverting gasoline to markets outside the United States. The Commission also analyzed investment in refinery capacity. The Commission concluded that refiners operated at full sustainable capacity, used complicated computer models to maximize their product slates and quantities, and exported a very limited amount of gasoline that was tied to long-term supply contracts or was unusable in the United States. Moreover, the Commission found that while investment in refinery expansion had not kept lock-step with increases in demand, capacity expansion was still significant. The FTC also concluded that refiners make investment decisions based on internal financial criteria and long-term forecasts about market conditions, not as part of a coordinated effort to act anticompetitively. The information that follows provides greater detail on the dimensions of U.S. refinery capacity, including refinery expansions (Part B.1), closings (Part B.2), the comparative costbenefit structure of expansions versus new greenfield builds (Part B.3), and projected increases in refinery capacity (Part B.4). Parts B.5 and B.6 examine U.S. refinery capacity utilization rates and the challenges that U.S. refiners have faced in sustaining high utilization rates due to changing gasoline, environmental, and other requirements. In Part B.7, the section concludes with a summary of the FTC’s 2006 investigation of U.S. refinery operations, and the 104
According to the American Petroleum Institute (“API”), U.S. refiners spent $47.4 billion from 1994 through 2003 to bring their refineries into compliance with environmental regulations requiring cleaner production processes and the production of cleaner fuels. API, U.S. Refinery Industry: A System Stretched to the Limit (June 6, 2005) at http://api-ep.api.org/industry/index.cfm?objectid=5C1AE70F-0129-449F-A6CEF327E2A0000F &method=display_body&er=1&bitmask=002007004000000000. This outlay included $15.9 billion in capital costs and $31.4 billion in operating and maintenance costs. Id. The investments required to meet the new low sulfur regulations for motor gasoline and diesel fuel are expected to total about $17 billion in addition to the $4 billion already spent to meet California’s low sulfur standards. Id. 105
Major maintenance can occur every three to seven years and reduces refinery operations for a longer period of time than does routine maintenance. To minimize the impact of routine and major maintenance on refinery utilization, refiners typically try to schedule maintenance during relatively low-demand periods — e.g., not during the summer peak-demand season.
25
Commission’s findings that U.S. refinery operations were driven and dictated by competitive market forces. 1.
U.S. Refiners Recently Have Added the Equivalent of 20 New Refineries
U.S. refiners have increased refinery capacity dramatically in recent years. As Table 1-2 presents, despite the retirement of several inefficient refineries, U.S. crude distillation capacity increased by 12 percent between 1994 and 2004. 106 The expansion of existing refineries resulted in increased gross capacity equivalent to the addition of approximately 20 new, average-sized refineries.107 Additionally, during the same period, U.S. refineries’ production of light products increased by 16 percent. Table 1-2 Capacity Growth of U.S. Refineries 1994 – 2004 1994 (bpd)
2004 (bpd)
Change (bpd)
Change Percent
Crude Distillation Capacity
15,034,000
16,894,000
1,860,000
12
Light Refined Products Production
11,795,000
13,627,000
1,831,000
16
79
81
2
-----
Light Product Production As A Percentage of Crude Distillation Capacity
Note: Light refined products are defined to include motor gasoline, gasoline blendstocks, distillate, and jet fuel. Includes operating and idle capacity as of January 1st of the year. Source: EIA Crude Distillation Capacity figures, see http://tonto.eia.doe.gov/dnav/pet/hist/8_na_8d0_nus_4a.htm; EIA Light Refined Products Production figures, see http://tonto.eia.doe.gov/dnav/pet/pet_pnp_refp_dc_nus_mbbl_a.htm.
As Table 1-2 indicates, between 1994 and 2004, the average annual growth of refining capacity was 1.2 percent, adding, on average, 190,000 barrels per day (“bpd”) of capacity each year. Moreover, the expansion of existing U.S. refineries resulted in not only significantly increased capacity, but also substantially more efficient and environmentally compliant capacity. 106
Crude distillation capacity does not reflect specific investments to increase the light products yield that spurred the more rapid expansion of production of these products. 107
With the retirement of 686,000 bpd, gross refinery expansion of 2,546,000 bpd resulted in a net increase of 1,860,000 bpd in refinery capacity between 1994 and 2004. The 686,000 bpd of capacity equals net shutdown capacity. This is total shutdown capacity less total reactivated capacity. See EIA, Petroleum Supply Annual 2005.
26
The recent increase in refinery capacity and light petroleum product production compares favorably to demand growth projections from the mid 1990s. At that time, EIA projected demand for all refined products to grow by 11 percent from 1994 to 2004, and for light refined products to grow by 14 percent during the same period. (See Table 1-3.) U.S. refining capacity growth (12 percent) and light refined products production growth (16 percent) exceeded demand projections, but fell short of actual demand growth. As discussed in Section 1. C, imports of light petroleum products increased during this same period to help meet demand. Table 1-3 Comparison of Actual and Expected Demand Growth for Refined Petroleum Products, 1994 – 2004 Percent Growth: 1994 – 2004 Refined Product
Actual
Projected by EIA in January 1996
Total Refined Products [1]
17.1
11
Light Refined Products [2]
20.8
14
Motor Gasoline
19.8
11
Distillate Fuel
28.3
13
Jet Fuel
10.1
28
Notes: [1] “Refined products” include unfinished oils, liquefied petroleum gases, pentanes plus, aviation gasoline, motor gasoline, naphtha-type jet fuel, kerosene-type jet fuel, kerosene, distillate fuel oil, residual fuel oil, petrochemical feedstocks, special naphthas, lubricants, waxes, petroleum coke, asphalt, road oil, still gas, and miscellaneous products. [2] “Light refined products” include motor gasoline, motor gasoline blendstocks, distillate fuel oil (diesel fuel and home heating oil), and jet fuel. Sources: Table I-9 EIA, Annual Energy Outlook 1996 With Projections to 2015, January 1996 at EIA, Archive Listing of Annual Energy Outlook Forecasts & Related Products at http://www.eia.doe.gov/oiaf/archive.html#aeo.
2.
Refineries Retired in the Last Decade Produced Little Gasoline
As Table 1-4 documents, refinery closings primarily have involved small facilities. EIA data identify 28 U.S. refineries that have closed since 1995. Sixteen of these refiners had capacities of less than 15,000 bpd; only five had capacities greater than 50,000 bpd. All of the closed refineries were less than 100,000 bpd. (Capacity of the average U.S. refinery is approximately 125,000 barrels per day). These 28 refineries, while representing 16 percent of the number of U.S. refineries, accounted for only about 4.6 percent of distillation capacity and 2.7 percent of downstream capacity.108 There were no refinery closings in 2005. 108
GASOLINE PRICE REPORT, supra note 53, at 18. The National Petroleum Council found that about half of the refineries closed between 1990 and 1999 did not have the ability to produce finished gasoline. 27
Table 1-4 Refinery Closures, 1995-2005* Year
Owner
Location
PADD
Crude Oil Distil. Capacity (bbl/cd)
1995
Indian Refining Cyril Petrochemical Corp. Powerine Oil Co. Sunland Refg. Corp.
1996
Downstream Charge Cap. (bbl/sd)
Lawrenceville, IL Cyril, OK Santa Fe Spr., CA Bakersfield, CA
II II V V
80,750 7,500 46,500 12,000
103,000 0 100,300 2,650
Barrett Refg. Corp. Laketon Refg. Total Petr. Arcadia Refg. & Mktg. Barrett Refg. Corp. Intermountain Refg.
Custer, OK Laketon, IN Arkansas City, KS Lisbon, LA Vicksburg, MS Fredonia, AZ
II II II III III V
10,500 11,100 56,000 7,350 8,000 3,800
0 0 74,840 6,700 0 2,000
1997
Gold Line Refg. Ltd. Canal Refg. Co. Pacific Refg. Co.
Lake Charles, LA Church Point, LA Hercules, CA
III II V
27,600 9,500 50,000
18,000 2,100 62,400
1998
Gold Line Refining Ltd. Petrolite Corp. Shell Oil Co. Pride Refg. Inc. Sound Refg. Inc.
Jennings, LA Kilgore, TX Odessa, TX Abilene, TX Tacoma, WA
III III III III V
12,000 600 28,300 42,750 40,000
0 750 33,500 40,500 45,200
1999
TPI Petro, Inc.
Alma. MI
51,000
63,300
2000
Calumet Lubricants Co. Berry Petroleum Co. Chevron U.S.A. Inc.
I III V
12,800 6,700 0
26,820 3,700 6,200
2001 2002
Premcor Refining Group Premcor Refining Group American International Foreland Refg.Corp. Tricor Refining LLC
Rouseville, PA Stephens, AR Richmond Beach, WA Blue Island, IL Hartford, IL** Lake Charles, LA Tonapah, NV Bakersfield, CA
II II III V V
80,515 64,000 30,000 0 0
124,500 116,700 15,000 3,000 14,400
2003
None
2004
Young Refg. Corp.
Douglasville, GA
I
5,400
0
Notes: bbl/cd = barrels per calendar day; bbl/sd = barrels per stream day Source: INVESTIGATION OF GASOLINE PRICE MANIPULATION AND POST-KATRINA GASOLINE PRICE INCREASES, Fed. Trade Comm’n, at 26, Table 1-5 (2006). Sourced from: Energy Information Administration (EIA), Petroleum Supply Annual, various years, Table 48 at http://www.eia.doe.gove/oil_gas/petroleum/data_publications/petroleum_supply_annual/psa_volume1/psa_volume1 _historical.html. In 1996, EIA reported that Tosco closed its 175,000 barrel/day Marcus Hook/Trainer, Pennsylvania refinery. We do not include this refinery in the table because Tosco reopened the refinery the following year, following extensive maintenance. As of 2006, it remained open. *There were no refinery closings in 2005. **ConocoPhillips purchased some of the assets of the refinery in July 2003 to allow its Wood River, Illinois refinery to process heavier, lower-cost crude oil.
28
Larger refineries (but those still smaller than the average U.S. refinery) likely were retired because of difficulties in making them compliant with boutique fuel requirements. Several California refineries were retired at about the time CARB109 gasoline requirements were imposed and appear to have been closed because they could not cost-effectively become CARB compliant.110 Similarly, refineries outside California appear to have been closed because of the expense of meeting new refined product specifications.111 3.
Expansion of Existing U.S. Refineries Is Considerably More CostEffective than New Construction
In capital intensive, slow-growing industries (including refining), increasing capacity by expanding existing facilities is generally far more cost-effective than building new facilities. U.S. refiners have increased their refining capacity through the expansion of existing facilities to take advantage of the numerous benefits of incremental growth. Expansion of existing facilities: •
reduces the cost and time involved in selecting a site, obtaining appropriate approvals, and building much of the refining infrastructure;112
•
reduces the need to build new port facilities and/or pipelines to deliver the crude oil and other inputs to the refinery, as well as to distribute the refined product output of the refinery;
•
enables the use of existing equipment at the refinery that would have to be added in a new refinery; and
•
creates a modern complex refinery with many units. (When the capacity of some refinery units is increased, other units may be used more fully, a process called “debottlenecking.”)
109
California Air Resources Board (“CARB”) gasoline is an ultra-low sulfur gasoline sold exclusively in California by mandate of the CARB. See Platt’s Oil Guide to Specifications, Product Specifications at http://www.emis.platts.com/thezone/guides/platts/oil/productspecs.html. 110
Deadline Looming for Cal. to Supply Phase II RFG, OIL & GAS J. 23-25 (Dec. 11, 1995) (“The high cost of regulatory compliance in California -- and not just with CARB specs -- has shrunk the number of refiners able to compete in the market in recent years. Two smaller independents who had once looked into producing CARB fuel -- Powerine Oil Co. and Pacific Refining Co. -- closed their doors during the past year after finding they would be unable to compete.”). 111
Joseph Loftus, et. al., Future U.S. Regulations, Prod. Demand Will Tighten Fuels Market, OIL & GAS CO. J., 5666 (Mar. 19, 2001) (Premcor shut down its 70,000-b/cd Hartford, IL refinery in early Oct. 2002, and likewise closed a 76,000-b/cd plant at Blue Island, IL, in 2001, citing as its reason “no economically viable method of reconfiguring the refinery to produce fuels meeting new specifications.”).
112
Refining infrastructure includes access roads, perimeter security, offices and other buildings, and electric power and other utility connections.
29
a.
Building A New U.S. Refinery Costs Substantially More Than Expanding An Existing One
Although total costs vary with local conditions, greenfield expansion generally costs substantially more and takes significantly more time than expansion of an existing facility. Because no new U.S. refineries have been built since Marathon’s Garyville, Louisiana refinery in 1976, little current information exists on the actual cost of constructing a new greenfield refinery. Nevertheless, publicly available information on a recent proposal to construct a new state-of-theart “clean” refinery provides useful guidance on the enormous costs of building a new refinery. Arizona Clean Fuels113 proposes to build a new refinery, located 40 miles east of Yuma, Arizona, with an atmospheric crude distillation capacity of 150,000 bpd, and a current cost estimate of $3.5 billion.114 The cost includes $650 million to construct an approximately 250 mile long crude oil pipeline from the west coast of Mexico (at Baja California or Sonora), with a marine off-loading facility and a pipeline origin terminal tank farm.115 Arizona Clean Fuels currently hopes to begin construction in 2008 and to be operational by 2011.116 The effort to site and fund this refinery already has been underway for years and has cost more than $30 million.117 Even if the refinery actually is operating by 2011, it will have taken 12 years to complete. With a cost of $3.5 billion, the construction cost per daily barrel of capacity will be $23,334.118 Even excluding the cost of $650 million for the crude pipeline construction — which might not be required for new refineries closer to crude sources — the construction cost would equal about $19,000 per daily barrel. (To be conservative, we use this latter estimate as a benchmark with which to compare the cost of refinery expansions.) Other estimates of the cost of refinery construction are based on a “hypothetical” refinery rather than an actual proposed project. In 2001, Turner Mason estimated the cost of constructing a hypothetical new 200,000 bpd refinery119 to be between $2.5-$3.0 billion120 or $12,500-$15,000 113
Arizona Clean Fuels is not affiliated with any of the major oil companies. Ken Alltucker, Refining Sw. Group Hopes to Build First Oil Refinery in 30 Years, ARIZ. REPUBLIC, June 26, 2005. 114
Id.; See Paul Davenport, Arizona Refinery Gets Boost: Mexico Would Allow Pipeline for Facility, ASSOCIATED PRESS, Nov. 23, 2005. See also Press Release, Ariz. Clean Fuels Yuma, Ariz. Oil Refinery Project Reaches Milestone with Proposed Crude Oil Pipeline (Nov. 22, 2005). Ariz. Clean Fuels has partnered with WesPac Pipelines to finance, construct, and operate the pipeline and associated facilities. 115
Richard Ducote, Op-Ed., Opinion by Richard Ducote: Refinery in Desert May not be Mirage, ARIZ. DAILY STAR (Nov. 23, 2005); Ken Alltucker, Refinery Project Moves Forward Mexico Agrees to Pipeline Plan, ARIZ. REPUBLIC (Nov. 23, 2005). 116
Davenport, supra note 114.
117
Jad Mouawad, No New Refineries in 29 Years? But Project Tries to Find a Way, N.Y. TIMES, AI (May 9, 2005).
118
Joyce Lobeck, Refinery Clears Another Hurdle, YUMA SUN (Mar. 27, 2007).
119
Joseph Loftus, et al., Future U.S. Regulations, Product Demand Will Tighten Fuels Market, OIL & GAS J. 55, 5860 (Mar. 19, 2001); see also NAT’L PETROLEUM COUNCIL, OBSERVATIONS ON PETROLEUM PRODS. SUPPLY (Dec. 2004). 30
per daily barrel. Adjusting for inflation, this cost equals between $13,700 and $16,500 in 2005 dollars. More recent estimates by Turner Mason also show a cost per daily barrel in the upper end of this range.121 The estimated $16,500 per daily barrel construction cost is less than the estimated cost for the Arizona Clean Fuels facility of $23,334 or $19,000 (excluding the pipeline costs) but, based on the public descriptions, does not appear to include infrastructure costs. Adding infrastructure costs required for a new refinery to Turner Mason’s numbers would likely make the two estimates comparable. b.
Recent Announcements Demonstrate the Cost-Effectiveness of Expansion Versus Greenfield Build
Publicly available materials provide information about a substantial capacity expansion effort currently being considered in Texas, which demonstrates the advantages of expanding capacity over building new capacity. Motiva Enterprises, LLC (“Motiva”)122 plans to expand its Port Arthur Refinery.123 The Port Arthur plan would increase the refinery’s atmospheric crude distillation capacity by 325,000 bpd, over twice the capacity of the new refinery proposed by Arizona Clean Fuels.124 The expanded facilities would include a coker and a desulfurization unit, allowing the refinery to process “the medium and heavy sour crudes Saudi Arabia can produce in abundance.”125 The company estimates its construction cost at $3.5 billion126 or $10,769 per daily barrel of incremental capacity, about half the cost associated with the Arizona Clean Fuels project and significantly less than Turner Mason’s estimate of $16,500, which likely excludes required infrastructure costs. Motiva would have the added advantage of using its capacity in its existing processing units. Motiva may also reduce costs by expanding the capacity of some of its existing processing units instead of constructing entirely new ones. c.
“Debottlenecking” Projects Have Added Significant Refining Capacity
A significant portion of the expansion in crude distillation and conversion capacity over the past decade is attributable to numerous small scale “debottlenecking” projects. Because of 120
Loftus, supra note 119, at 60.
121
See Malcolm M. Turner & Joseph Loftus, Turner Mason & Co., Presentation to OPIS Supply Conference, U.S. Refiners’ Crude Costs Traps (2002); Malcolm Turner, Turner & Mason & Co., Presentation to OPIS Supply Conference, U.S. Refinery Industry - Some Facts and Comments Regarding the “Golden Age” 47 (2004). 122
Motiva is a joint venture between Shell Oil Company and Saudi Refining Inc.
123
News Release, Motiva Selects Gen. Contractor for Proposed Expansion Project (Aug. 3, 2006).
124
Matt Piotrowski, Motiva to Double Port Arthur Capacity, OIL DAILY (Sept. 14, 2005).
125
Id.
126
Id.; Fiscal Notes: A More Refined Texas, Texas Comptroller of Public Accounts (April 2007) at http://www.cpa.state.tx.us/comptrol/fnotes/fn0704/refined.html.
31
the significant cost associated with shutting down refinery units, refiners usually implement these debottlenecking projects during scheduled or unscheduled shutdowns for maintenance. While the crude oil processing capacity increases from a debottlenecking project are usually relatively small, there are exceptions. For example, in April 2005, CITGO Petroleum Corporation (“CITGO”) completed a debottlenecking project at its Lake Charles, Louisiana refinery that added a crude vacuum distillation tower.127 This project cost $293 million and added 105,000 bpd of crude processing capacity to the existing 325,000 bpd capacity — at only $2,790 per daily barrel of incremental capacity.128 Table 1-5 highlights three other recent U.S. refinery debottlenecking projects. The cost per daily barrel for these three projects ranges from $5,085 to $11,538, with an average construction cost for incremental daily barrel of capacity of $7,500.129
127
David McCollum, CITGO’s Lake Charles Refinery Now 4th Largest in the United States of America, VHEADLINE.COM (Apr. 21, 2005) at http://www.vheadline.com/printer_news.asp?id=31300.
128
Id.
129
The construction costs for the last three debottlenecking projects appear to involve substantial refinery improvements that do not expand crude distillation capacity. These improvements likely allow the refineries to process less expensive heavy crude oil or to produce a higher percentage of light refined products from the crude oil that is processed.
32
Table 1-5 U.S. Refinery Debottlenecking Projects Recently Completed
Cost of Construction (Million Dollars)
Cost per Barrel (Dollars per Daily Barrel)
Refinery Location
Year Completed
Increased Crude Unit Capacity (kbd)
1. CITGO
Lake Charles, LA
2005
105
$293
$2,790
2. Shell
Deer Park, TX
2000
59
$300
$5,085
3. Marathon Oil Corp.
Detroit, MI
2005
26
$300
$11,538
4. Valero (Premcor)
Port Arthur, TX
2007
75
$600
$8,000
Company
d.
Source / Comments
Fuel Oil News, “Lake Charles Refinery nation’s fourth-largest” at http://www.fueloilnews.com/uploads/ newstrends/2005/0506_trends7.asp. Foster Wheeler News Release, “Foster Wheeler is Awarded Contract by Shell Oil Company for the Expansion of the Deer Park Refinery Delayed Coking Unit,” Dec. 21, 1998. Marathon Oil Corporation News Release, “Marathon Announces Anticipated Completion of Detroit Refinery,” Sept. 29, 2005. The Beaumont Enterprise, “600 Million Valero Expansion Complete,” Apr. 20, 2007; Newsbase Press Release, “Fitch Assigns ‘BB’ to New Premcor Refining Group Sr Notes,” June 5, 2003.
Summary Comparison of Construction and Expansion Costs
Table 1-6 compares the construction costs per bpd of incremental crude distillation capacity for new refinery construction, major refinery expansion, and debottlenecking projects. As previously noted, expansion of existing facilities is more cost effective than constructing a new greenfield refinery. These refinery expansions can be very substantial (the proposed Motiva project is the equivalent of adding more than two new 150,000 bpd refineries), yet still cost much less and arrive faster than a new greenfield refinery.
33
Table 1-6 Summary Comparison of the Construction Costs Per Daily Barrel of Incremental Capacity for New Refineries and for the Expansion of Existing Refineries Construction Cost Per Daily Barrel of Incremental Crude Processing Capacity ($/bpd)
Type / Description of Project 1. New Refinery Construction: Arizona Clean Fuels 150,000 bpd expansion (excluding pipeline construction)
$19,000
2. Major Refinery Expansion: Motiva 325,000 bpd expansion
$10,769
3. Debottlenecking: a. CITGO 105,000 bpd expansion
$ 2,790
b. Shell 59,000 bpd expansion
$ 5,085
c. Valero 75,000 bpd expansion
$ 8,000
d. Marathon Oil Corp. 26,000 bpd expansion
$11,538
4.
Anticipated Refinery Expansions Will Add Substantial New Capacity
The rate of expansion of U.S. refining capacity over the next decade is, not surprisingly, uncertain. Nevertheless, a number of domestic expansion projects already have been announced. Capacity expansion is expected globally as well, and new refineries are already under construction or have been announced.130 Petroleum companies have announced a number of U.S. refinery expansion projects.131 EIA estimates an increase of crude distillation capacity of approximately 1.05 million bpd, for projects announced and intended to be completed between 2007 and 2011.132 If completed, this 130
See Press Release, Reuters, TABLE-U.S. Refinery Expansion Plans (June 12, 2007) at http://uk.reuters.com/article/oilRpt/idUKN12EFINERY20070612; see also Worldwide Constr. Update, OIL & GAS J. (April 16, 2007); see also EIA, Are Refiners Entering a Golden Age or a Short Cycle 26 (April 2007) at http://www.eia.doe.gov/pub/oil_gas/petroleum/presentations/2007/spain2007/spain2007_files/frame.html. 131
For various reasons, not all announced projects are completed. However, not all capacity expansion projects undertaken, or likely to be undertaken, are announced. 132
Are Refiners Entering a Golden Age or a Short Cycle, supra note 130, at 25.
34
new capacity constitutes the equivalent of eight new average-sized refineries, and represents a six percent capacity increase.133 5.
Refineries Operate at or near Their Practical Maximum Utilization Rates a.
Measuring Crude Distillation Capacity Utilization
The simplest and most common method for approximating a refinery’s capacity utilization entails a comparison of (1) the rate at which crude oil is processed, or “run,” in the refinery’s atmospheric crude distillation units to (2) the refinery’s available atmospheric crude distillation capacity during the period in question.134 A refinery’s available, or “rated,” crude distillation capacity is typically approximated in any given month by the “stream day” atmospheric distillation capacity, published annually for each refinery in the EIA’s Annual Refinery Report. That report also shows refinery capacities in barrels per calendar day. These figures are calculated by subtracting an estimate of the pro rata annual share of scheduled downtime that might be expected over a long period of operation (e.g., five years) from “stream day” average capacities. A commonly-used estimate of a refinery’s capacity utilization would therefore be a ratio of the refinery’s average daily crude inputs divided by the refinery’s rated “calendar day” average crude distillation capacity (as reported in the EIA-820 “Annual Refinery Report”). Multiplying the ratio by 100 converts the expression to “% utilization.”135 As Figure 1-5 illustrates, U.S. refinery capacity utilization has been high, averaging 93 percent, between 1994 and 2004.
133
As of January 2007, U.S. operable crude oil distillation capacity was 17.455 million barrels per day (“mmbd”). See Refinery Utilization and Capacity Utilization data at http://tonto.eia.doe.gov/dnav/pet/pet_pnp_unc_dcu_nus_m.htm. 134
This method does not directly measure the utilization of units downstream from crude distillation units that are essential to the production of light products. For a high utilization of the crude distillation unit(s) to be attained, these downstream units also must be available to operate (i.e., be reliable). Further, refiners continuously work to improve the utilization rates of the individual downstream units to improve the overall efficiency of refineries (i.e., reduce per gallon refinery processing costs). A high crude capacity utilization rate is generally indicative of an overall efficient refinery.
135
The EIA uses this ratio.
35
Figure 1-5 U.S. Refinery Capacity Utilization Rate: 1994 Through 2004 100 90 80 70 92.6
92.0
94.1
95.2
95.6
92.6
92.6
92.6
90.7
92.6
93.0
1994
1995
1996
1997
1998
1999
2000
2001
2002
2003
2004
60 50 40 30 20 10 0
Note: This refinery capacity utilization rate measure equals the crude oil input to these refineries as a percentage of the atmospheric crude distillation capacity of these refineries. Source: EIA Annual Energy Review 2004.
Refinery utilization rates vary by season as the actual maintenance schedules will be different than the estimated average maintenance levels used to derive calendar day capacities from stream day capacities. Average utilization is lowest from January to March, when refineries usually perform routine annual maintenance and complete major maintenance projects.136 Utilization generally is highest during the summer as refineries typically try to avoid planned maintenance and thus maximize gasoline supply when demand is at its highest. Refiners also produce and store refined products in advance of peak demand periods to satisfy that demand and more fully use refining capacity throughout the year. For instance, motor gasoline production typically exceeds demand in April and May, as refineries build inventories for the peak summer demand. Refineries anticipating winter maintenance will tend to build inventories from September through early December. In addition to seasonal maintenance schedules and demand fluctuations, several other variables influence U.S. refinery utilization rates. Reported crude capacities reflect the ability of the crude distillation unit to process a specific crude slate at certain operating conditions into certain specified products. For other slates and conditions, 100 percent capacity utilization may not be feasible. In addition, refineries may have bottlenecks in downstream process units — depending on the types of crude inputs used and the product slate produced — that limit the
136
Because different refineries face different seasonal demand patterns and different constraints, some refineries may have maintenance later in the spring or during the fall. For example, some refiners perform routine maintenance in October, which keeps overall refining production rates below average in October.
36
ability to run the crude distillation unit at full capacity.137 Actual utilization rates also include unplanned outages and slowdowns that further reduce capacity utilization. b.
Refineries Have Increased Their Light Product Production Capabilities
U.S. refineries not only have maintained high utilization of crude distillation units, but also have increased the amount of light products that they produce from a barrel of crude. As shown in Figure 1-6, the capability of U.S. refiners to produce light refined product has increased relative to the crude oil and other inputs processed. In 1994, on average, 0.788 barrels of light refined products were produced by U.S. refineries for every barrel of crude oil and other inputs processed. By 2004 that number had increased to 0.816 barrels of light refined products. Figure 1-6 Light Refined Products Production Per Barrel of Refinery Inputs 0.820 0.815 0.810 0.805 0.800 0.795 0.811
0.790 0.805
0.806
2000
2001
0.816 0.809
0.785 0.780
0.788
0.792
0.793
0.792
0.792
1995
1996
1997
1998
0.795
0.775 0.770 1994
1999
2002
2003
2004
Notes: [1]: Light petroleum products include motor gasoline, motor gasoline blending components, distillate fuel oil (diesel fuel and home heating oil), and jet fuel. [2]: Refinery inputs include crude oil, products of natural gas processing plants, unfinished oils, other hydrocarbons and oxygenates, motor gasoline and aviation gasoline blending [3]: Refinery output of light products is net of components and finished petroleum products. Source: EIA Petroleum Navigator, Refinery & Blender Net Production (http://tonto.eia.doe.gov/dnav/pet/pet_pnp_refp_dc_nus_mbbl_m.htm).
137
See CANADIAN COMPETITION BUREAU, THE EFFECTS OF RECENT VOLATILITY IN INT’L PETROLEUM MARKETS ON CANADIAN WHOLESALE AND RETAIL GASOLINE PRICES 3-4 (2004) (discussing these capacity utilization considerations).
37
6.
High Utilization Rates Have Been Achieved Despite Numerous Obstacles
Various factors have hampered U.S. refiners’ ability to maintain high utilization rates over the past decade. First, new Clean Air Act standards have changed the product mix of U.S. refineries. There are now at least 17 different types of motor gasoline. To produce this variety of boutique fuels, substantial expensive upgrades have been made to U.S. refineries. Second, upgraded refineries now produce a higher percentage of light refined products. In addition, companies have modified refineries to process additional heavier sour crude oils without reducing light products production. To respond to these factors, U.S. refineries shut or slowed down to allow the new equipment to be installed and integrated, thus reducing their capacity utilization rates. Despite these significant obstacles, however, U.S. refiners have maintained high utilization rates, improved the reliability of refineries, and reduced maintenance downtimes. 7.
The FTC’s 2006 Investigation of the Industry Found No Manipulation of Gas Pricing by Refiners
In 2006, responding to Congressional directives, the FTC investigated (1) “whether the price of gasoline is being artificially manipulated by reducing refinery capacity or by any other form of market manipulation or price gouging practices,”138 and (2) nationwide gasoline prices and possible price gouging in the aftermath of Hurricane Katrina. The FTC published the results of its investigation in its report “Investigation of Gasoline Price Manipulation and Post-Katrina Gasoline Price Increases.”139 As part of this investigation, the FTC carefully analyzed various aspects of refinery operations to determine whether refiners manipulated, or tried to manipulate, gasoline prices. The FTC examined whether refiners restricted supply by running refineries below capacity, altering their product output, or diverting gasoline to markets outside the United States. The Commission also analyzed investment in refinery capacity, and its impact on longterm supply and prices. The FTC findings address allegations raised with regard to these four major aspects of refining operations: (1) refinery capacity utilization, (2) refinery determination of product slate and quantities, (3) product exports, and (4) investment in refinery capacity.140 As Chairman Majoras testified to Congress, “the staff’s investigation revealed no evidence to suggest that refiners manipulated prices through any of these means.”141 Highlights on these four issues follow. 138 139
GASOLINE PRICE REPORT, supra note 53, at i. Id.
140
FTC Investigation of Gasoline Price Manipulation and Post-Katrina Gasoline Price Increase before the Comm. on Commerce, Science, and Transportation 8 (May 23, 2006) (presented by Deborah Platt Majoras, Chairman, FTC) (hereinafter “Majoras Statement 2006”) at http://www.ftc.gov/os/testimony/0510243CommissionTestimonyConcerningGasolinePrices05232006Senate.pdf. 141
Id. at 8. 38
a.
Refinery Capacity Utilization
The FTC found that companies operate their refineries at full sustainable utilization rates. While capacity utilization was lower in the summer of 2005 than in the previous summer, capacity utilization in 2005 was in line with capacity utilization before 2004.142 Further, in studying the early summer of 2005, the agency found that capacity utilization was at or near record levels in June, but that Hurricanes Dennis and Emily, while less destructive than Hurricanes Katrina and Rita, “nevertheless interrupted crude oil supplies to the Gulf Coast and Midwest.”143 Thus, the FTC staff concluded that the data on capacity utilization in isolation provided no evidence of market manipulation.144 To investigate further, the Commission examined refiners’ downtimes. The FTC concluded that “the existence of internal concerns about unnecessary downtime, recognition that downtime has adverse effects on company profits, and decisions to schedule downtime during periods of low demand provide evidence that refiners do not use downtime to raise prices.”145 The FTC also found that internal company documents “reflected efforts to minimize unplanned downtime resulting from weather and other unforeseen calamities.”146 b.
Refinery Determination of Product Slate and Quantities
The FTC found that companies calculate the product quantities they produce to maximize profits, not to affect the market price for gasoline.147 The evidence indicated that refiners behaved competitively and responded to market prices by trying to produce the largest possible amount of higher-valued products.148 Further, the Commission concluded that refiners used computer models to determine the most profitable slate of products, including quantities, given refinery input costs and market-based price forecasts; that these models took market prices as a given; and that the models did not indicate an ability to influence price through short-run product decisions.149 In determining output volumes and product slates, companies considered the cost of crude oil, other refinery inputs, and energy, as well as the likely market value of the potential refinery products.150 142 143 144
GASOLINE PRICE REPORT, supra note 53, at 7. Id. Id.
145
Id. at 9.
146
Majoras Statement 2006, supra note 140, at 9.
147 148 149 150
Id. Id. GASOLINE PRICE REPORT, supra note 53, at 4. Id.
39
c.
Product Exports
The Commission investigation found that refined product exports from the United States are relatively rare.151 Additionally, the Commission staff identified the three circumstances when such exports occurred: (1) pre-existing supply commitments, (2) product unacceptable for use in the United States, and (3) overseas prices increased sufficiently over domestic prices to make such exports profitable.152 Further, the level of exported product was relatively low compared to imports and overall U.S. consumption. Moreover, the agency found that any attempt to increase U.S. prices by exporting product likely would result in more imports into the domestic market, defeating any intended pressure on supply.153 As we discuss below, imports to the United States have increased substantially. d.
Investment in Refinery Capacity
The FTC found that domestic refinery expansion, while significant, had not kept pace with rising demand over the past twenty years.154 The Commission noted, however, that the rate of capacity growth reflected competitive market forces that made further investment in refining capacity unprofitable, and that building greenfield refineries would have been uneconomical compared to expansion of existing facilities.155 Further, the investigation found that refiners appeared to make capacity decisions based on internal financial criteria and long-term forecasts about market conditions, not on any effect their capacity additions would have on prices.156 Moreover, the report concluded that for refiners: Reaching an agreement on capacity expansion would likely be even more difficult than reaching an agreement regarding short-run output decisions because the collusion would have to be maintained over many years and would even have to survive changes in ownership. For coordination to be profitable, the set of coordinating firms must have a large enough combined market share that any underinvestment designed to lead to higher prices is profitable. If firms outside the collusive group can expand sufficiently, the coordination will be unprofitable. Similarly, firms
151
Id. at 13.
152
Id. at 14.
153 154 155 156
Id. Id. at 4. Id. Id.
40
outside the market must not be able to import product economically and offset the capacity restrictions.157 In short, coordination to harm consumers is highly unlikely to occur. C.
U.S. Refined Product Supply Has Become Increasingly Integrated with Global Markets
The Middle East, Canada, Europe, Africa, and Latin America all ship crude oil to the United States and worldwide. Similarly, refined petroleum products are shipped from Canada, Europe, the Caribbean, and other countries to the United States and globally. Thus, U.S. and world markets that refine crude oil and use refined products operate interdependently. For this reason, disruptions in global or U.S. crude oil production and refining capacity impact the interrelated global and U.S. markets for both crude oil and refined petroleum products. In the past two decades, U.S. and worldwide demand for crude oil and refined petroleum products has increased significantly. To satisfy growing demand, global and U.S. companies have expanded refining capacity substantially. The United States also has used increased imports of refined petroleum products to help meet increased demand most cost-effectively. 1.
Growing Global and U.S. Crude Oil Demand Places Pressure on Supply
In the past two decades, global demand for crude oil has increased by approximately 38 percent, from 60.1 million bpd in 1985 to 82.6 million bdp in 2004,158 far outpacing industry and government demand projections. (See Figure 1-7.) Demand from rapidly developing economies (most notably China and India) and sustained strong U.S. demand will continue to place upward pressure on worldwide supplies. Together, the OPEC nations constitute the single largest producer of crude oil, although OPEC’s share of the worldwide export market has varied over time. OPEC’s share of world crude oil and NGL production peaked at 53.6 percent in 1974, declined to its low point of 30.1 percent in 1985, and has hovered around 40 percent more recently.159 Production from nonOPEC nations, such as Canada, Mexico, and Norway, has expanded to meet growing worldwide
157
Id.
158
GASOLINE PRICE FACTORS REPORT, supra note 30; EIA, MONTHLY ENERGY REV., 155 Table 11.2, (Apr. 2005) at http://tonto.eia.doe.gov/FTPROOT/multifuel/mer/00350504.pdf. 159
OPEC’s share of world crude oil and NGL production reached 41.5 percent in 2000, declined to 38.5 percent in 2002, and rose to 40.5 percent in 2004. OIL MERGER REPORT, supra note 35, at 154, Table 5-8 (sourced from 19802004: EIA, Int’l Energy Annual, Table G1, “World Production of Crude Oil, NGPL and Other Liquids”).
41
demand. U.S. crude oil production has declined, however, as U.S. crude oil reserves have been depleted.160 To offset this shortfall, U.S. refiners now import more than 60 percent of their input from foreign sources, compared to only 43 percent in 1978.161
Figure 1-7 2004 Predicted v. Actual Crude Oil Demand Increase Millions Barrels per Day
Source: Gasoline Price Changes: The Dynamics of Supply, Demand, and Competition, Fed. Trade Comm’n (2005), at Figure 2-6, EIA.
2.
Growing Imports Cost-Effectively Meet Growing U.S. Demand
From 1984 to 2004, average daily U.S. consumption of all refined petroleum products increased 1.4 percent per year on average, for a total increase of 30 percent.162 An increase in the consumption of gasoline in the United States in recent decades is consistent with this trend. In 2006, the United States consumed an average of 387 million gallons of gasoline per day. As the 160 161 162
GASOLINE PRICE FACTORS REPORT, supra note 30. Id. Id. at 19.
42
GAO noted in recent Congressional testimony, “[t]his consumption is 59 percent more than the 1970 average per day consumption of 243 gallons — an average increase of about 1.6 percent per year for the last 36 years.”163 As Table 1-7 indicates, domestic demand for refined products increased by 17 percent from 1994 to 2004. During this same period, domestic demand for light refined products increased by 21 percent. This growth in demand exceeded most industry and government projections (see Figure 1-7).
Table 1-7 U.S. Demand for Refined Petroleum Product 1994-2004
Refined Product Demand Components
1994 (bpd)
2004 (bpd)
Change (bpd)
Percent Change
All Refined Products
17,709,000
20,731,000
3,022,000
17
Light Refined Products
12,243,000
14,794,000
2,551,000
21
Motor Gasoline
7,601,000
9,105,000
1,504,000
20
Distillate
3,162,000
4,058,000
896,000
28
Jet Fuel
1,480,000
1,630,000
150,000
10
Source: U.S. consumption (product supplied) is obtained from EIA Petroleum Navigator, Supply and Disposition for each fuel at http://tonto.eia.doe.gov/dnav/pet/pet_sum_snd_c_nus_ep00_mbbl_m.htm. Note: “All refined products” include unfinished oils, liquefied petroleum gases, pentanes plus, aviation gasoline, motor gasoline, naphtha-type jet fuel, kerosene-type jet fuel, kerosene, distillate fuel oil, residual fuel oil, petrochemical feedstocks, special naphthas, lubricants, waxes, petroleum coke, asphalt, road oil, still gas, and miscellaneous products.
163
GAO REPORT, supra note 82, at 5 (the increase to 1.6 percent reflects the accelerated growth in demand of the past couple of years).
43
To help meet this increased demand for refined petroleum products, as Table 1-8 reveals, worldwide refining capacity increased by 13 percent and U.S. refining capacity increased by 12 percent between 1994 and 2004. During that same period, worldwide production of light petroleum products increased by 19 percent, and U.S. production of light petroleum products increased by 16 percent.
Table 1-8 Capacity of U.S. and Non-U.S. Refineries: 1994 and 2004 Crude Distillation Capacity 1994 (bpd)
2004 (bpd)
Change (bpd)
Percent Change
World
73,073,000
82,258,000
9,185,000
13
Non-U.S. Countries
58,039,000
65,364,000
7,325,000
13
United States
15,034,000
16,894,000
1,860,000
12
Region
Light Products Production 1994 (bpd)
2004 (bpd)
Change (bpd)
Percent Change
World
41,179,000
48,904,000
7,725,000
19
Non-U.S. Countries
29,384,000
35,277,000
5,893,000
20
United States
11,795,000
13,627,000
1,831,000
16
Region
Sources: Crude Distillation Capacity: World: EIA, Int’l Energy Database, Table 36. Non-U.S. Countries: World capacity less U.S. capacity. U.S.: EIA, Petroleum Supply Annual, Table 36. Light Products Production: World: Non-U.S. countries production plus U.S. production. Non-U.S. Countries: World consumption less U.S. production. World consumption is obtained from EIA, International Energy Annual 2003, Table 1.2. Consumption in 2004 is estimated using a 1.4% growth rate. U.S.: Refinery production of light products is obtained from EIA Petroleum Navigator, Supply and Disposition for each fuel at http://tonto.eia.doe.gov/dnav/pet/pet_sum_snd_c_nus_ep00_mbbl_m.htm.
44
For many years, the United States has used imports as an important and cost-effective complement to the expansion of U.S. refinery capacity. As Table 1-9 demonstrates, net imports of refined products rose as a share of domestic consumption from 1994 to 2004.164 Imports represent approximately 10 percent of all refined petroleum product demand, and more than seven percent of light petroleum product demand.165
Table 1-9 Net Imports as a Share of U.S. Demand 1994 and 2004 Imports as Percent Imports as Percent of U.S. Demand of U.S. Demand 1994 2004 All Refined Products
6
10
Light Products
3
7
Motor Gasoline
4
9
Distillate
-1
5
Jet Fuel
6
5
Sources: U.S. Demand: Product supplied obtained from EIA Petroleum Navigator, Supply and Disposition For Each Fuel at http://tonto.eia.doe.gov/dnav/pet/pet_sum_snd_c_nus_ep00_mbbl_m.htm. Net imports equals imports less exports. Imports and exports are obtained from EIA Petroleum Navigator, Supply and Disposition for each fuel at http://tonto.eia.doe.gov/dnav/pet/pet_sum_snd_c_nus_ep00_mbbl_m.htm. Imports and exports for motor gasoline include blendstocks. The category of all refined products includes light products, unfinished oils, liquefied petroleum gases, pentanes plus, aviation gasoline, naphtha-type jet fuel, kerosene, residual fuel oil, petrochemical feedstocks, special naphthas, lubricants, waxes, petroleum coke, asphalt, road oil, still gas, and miscellaneous products.
164
The EIA tracks imports and exports of refined products. See EIA, Topics for Petroleum Imports/Exports & Movements at http://tonto.eia.doe.gov/dnav/pet/pet_move_top.asp. Net imports (imports less exports) of light refined products increased from 335,000 bpd in 1994 to 1,093,000 bpd in 2004. Even though the United States is a net importer of refined products, the United States does export some refined products. These very limited exports are discussed in Section B.7(c) above.
165
Between 1994 and 2004, light petroleum product demand increased by 2,551,000 bpd. Net imports of light products grew by 758,000 bpd, or approximately 30 percent of the increase in demand.
45
Cost-effective imports of light refined petroleum products are available because non-U.S. production of light refined petroleum products grew faster than non-U.S. demand.166 Thus, nonU.S. refiners have had additional light refined products available for import to the United States. While not all non-U.S. refineries can meet U.S. specifications, many refineries in Canada, Western Europe, the Caribbean, the Far East, and elsewhere are capable of meeting U.S. specifications and therefore can export their products to the United States.167 D.
Inventory Practices Have Reduced Costs and Benefited Consumers
For decades, many U.S. industries have sought to manage inventories efficiently. Generally, firms seek to establish inventory levels that ensure continuous supply to customers, which entails holding inventories sufficient to meet anticipated changes – or unanticipated interruptions – in demand or supply. Carrying excess inventory requires firms to bear significant (and unnecessary) storage and carrying costs. By managing inventory levels more effectively, many firms have reduced these costs substantially. Petroleum firms, specifically refiners and terminal operators, behave like businesses in other industries. At a minimum, they must hold inventory sufficient to ensure safety and overall system viability. In addition, they also strive to establish stock levels that ensure high supply reliability for their customers. They assess numerous variables to determine optimal stock levels, including seasonal differences in demand, the historical volatility of demand, and the transit time required to restock from supply sources (e.g., refinery or port) via optimal modes of transportation (e.g., pipeline or ship). Thus, like firms elsewhere, petroleum companies seek to reduce costs by economically reducing inventory while maintaining reliability of supply for their customers. In its 2006 report on gasoline prices, the FTC acknowledged and categorically rejected the assertion that petroleum firms have manipulated inventory levels to elevate prices during market disruptions.168 Instead, the FTC concluded that petroleum firm inventory management practices are consistent with manufacturing firm inventory trends over the past four to five decades.169
166
Non-U.S. production grew by 21 percent, while non-U.S. demand grew by 18 percent. Non-U.S. demand for light refined petroleum products equals world consumption of light products (motor gasoline, diesel fuel and heating oil, kerosene, and jet fuel) less U.S. consumption. World consumption is obtained from EIA, Int’l Energy Annual 2003, Table 1.2. Consumption in 2004 is estimated using a 1.4 percent growth rate. U.S. consumption is obtained from EIA Petroleum Navigator, Supply and Disposition for each fuel (http://tonto.eia.doe.gov/dnav/pet/pet_sum_snd_c_nus_ep00_mbbl_m.htm). 167
The primary sources for U.S. finished motor gasoline imports from 2003-2005 included Canada (27.71 percent), Virgin Islands (20.66 percent), Netherlands (8.23 percent), United Kingdom (7.98 percent), Venezuela (6.49 percent), Belgium (4.45 percent), Argentina (2.84 percent), Italy (2.60 percent), Lithuania (2.16 percent), and France (1.92 percent). 168
GASOLINE PRICE REPORT, supra note 53, at 48-49.
169
Id. at 46.
46
1.
Petroleum Firms Have Reduced Inventories and Costs Substantially
Industry inventories of crude oil have declined significantly during the past decade, avoiding substantial costs without sacrificing reliability. Table 1-10 shows the number of days of crude oil supply for all U.S. commercial stocks and for stocks at U.S. refineries (the “days supply”).170 For all U.S. commercial stocks, the number of days supply dropped by 23 percent from 1994 to 2004, while the number of days supply in inventory at U.S. refineries dropped by 12.5 percent. Table 1-10 U.S. Days Supply of Commercial Crude Oil Stocks: 1994 and 2004 1994 Days Supply (Days)
2004 Days Supply (Days)
Percentage Reduction
All U.S. Commercial Stocks
24.3
18.7
23.0
Stocks at U.S. Refineries
7.2
6.3
12.5
Type of Stock
Sources: All U.S. commercial stocks: EIA Petroleum Navigator, Total Stocks at http://tonto.eia.doe.gov/dnav/pet/pet_stoc_wstk_dcu_nus_m.htm. Refinery stocks: EIA Petroleum Navigator, Refinery Stocks at http://tonto.eia.doe.gov/dnav/pet/pet_stoc_ref_dc_nus_mbbl_m.htm. U.S. refinery and blender net inputs of crude oil: EIA Petroleum Navigator, Supply and Disposition at http://tonto.eia.doe.gov/dnav/pet/pet_sum_snd_c_nus_epc0_mbblpd_a.htm. Note: Days supply is the average stock of crude oil (in thousands of barrels) divided by daily U.S. refinery and blender net inputs of crude oil (in thousands of barrels per day). Average stock is the average of the monthly stocks weighted by the number of days in each month.
The industry achieved similar declines in the inventory levels of light refined petroleum products during the same period. Table 1-11 shows the number of days of light refined petroleum product supply at all locations, including stocks in-transit, at refineries, and at terminals. From 1994 to 2004, the days supply at all locations dropped by 21 percent. Among 170
“Days supply” equals the number of days of demand that can be satisfied from inventories based on estimates of demand for a specific product or area. Thus, if the objective is to keep the days supply unchanged, inventory levels will increase as product demand increases. Using standard inventory analyses, the number of days supply held depends on factors such as the variability of demand, the number of days required to schedule a delivery, and the cost of holding the inventory.
47
the light refined products, distillate stocks declined by the greatest percentage between 1994 and 2004 (27 percent), while jet fuel declined the least (12 percent).
Table 1-11 U.S. Days Supply of Light Refined Petroleum Products At All Locations 1994 and 2004 1994
2004
Days Supply (Days)
Days Supply (Days)
All Light Products
31.1
24.6
21
Motor Gasoline
28.1
22.8
19
Distillate
39.8
28.9
27
Jet Fuel
27.4
24.0
12
Type of Light Product
Percentage Reduction
Sources: Stocks: EIA Petroleum Navigator, Stocks by Type at http://tonto.eia.doe.gov/dnav/pet/pet_stoc_typ_d_nus_SAE_mbbl_m.htm. Usage: EIA Petroleum Navigator, Supply and Disposition for Finished Motor Gasoline at http://tonto.eia.doe.gov/dnav/pet/pet_sum_snd_c_nus_epm0f_mbblpd_a.htm, Distillate Fuel Oil at http://tonto.eia.doe.gov/dnav/pet/pet_sum_snd_c_nus_epd0_mbblpd_a.htm, and Kerosene-Type Jet Fuel at http://tonto.eia.doe.gov/dnav/pet/pet_sum_snd_c_nus_epjk_mbblpd_a.htm. Note: Days supply is the average stock of product (in thousands of barrels) divided by daily U.S. usage (product supplied) of the product (in thousands of barrels per day). Average stock is the average of the monthly stocks weighted.
The decline in motor gasoline inventories portrayed in the preceding table began decades ago. Specifically, EIA data that track the total level of motor gasoline inventories relative to the total level of consumption reveal that this inventory ratio has been declining for 50 years (see Figure 1-8). The FTC examined this trend in inventory reduction and concluded, in its 2006 report on gasoline pricing, that inventory declines were not related to increases in gas prices.171
171
GASOLINE PRICE REPORT, supra note 53, at 48-49.
48
Figure 1-8 FTC Gasoline Pricing Investigation Report
Lower inventory levels reduce inventory carrying costs substantially. Using 2004 prices and volumes, annual savings in industry carrying costs are estimated to total nearly $1 billion, or more than one-quarter of the carrying cost of the total 2004 commercial crude oil and light refined products inventories. (See Table 1-12.)
49
Table 1-12 The 2004 Carrying Cost Savings Due To Reducing the U.S. Days Supply of Crude Oil and Light Refined Products Between 1994 and 2004172 Carrying Reduction in
Cost Savings
U.S. Stocks
(Millions of $)
Commercial Crude Oil
$382
Light Refined Products
$573
Total
$955
Sources: Change in Days Supply: Tables IV-1 and IV-2. Usage: U.S. refinery and blender net inputs of crude oil: EIA Petroleum Navigator, Supply and Disposition at http://tonto.eia.doe.gov/dnav/pet/pet_sum_snd_c_nus_epc0_mbblpd_a.htm. Products Usage: EIA Petroleum Navigator, Supply and Disposition for Finished Motor Gasoline at http://tonto.eia.doe.gov/dnav/pet/pet_sum_snd_c_nus_epm0f_mbblpd_a.htm, Distillate Fuel Oil at http://tonto.eia.doe.gov/dnav/pet/pet_sum_snd_c_nus_epd0_mbblpd_a.htm, and Kerosene-Type Jet Fuel at http://tonto.eia.doe.gov/dnav/pet/pet_sum_snd_c_nus_epjk_mbblpd_a.htm. Prices: Crude Oil: EIA Petroleum Navigator, Refiner Acquisition Cost of Crude Oil at http://tonto.eia.doe.gov/dnav/pet/pet_pri_rac2_dcu_nus_a.htm. Products New York Harbor Prices: EIA Petroleum Navigator, Spot Prices at http://tonto.eia.doe.gov/dnav/pet/pet_pri_spt_s1_a.htm. Distillate price is for No. 2 heating oil.
Table 1-13 estimates $950 million of annual storage cost savings from reductions in days supply of crude oil and light refined products at all commercial locations (i.e., excluding the Strategic Petroleum Reserve and government storage locations). These savings represents 42 percent of the total storage cost for 2004 U.S. commercial inventories of crude oil and light refined products.
172
The cost savings were calculated by first estimating the reduction in the total volume of stocks. For all U.S. commercial crude oil stocks, the estimate was based on the decrease in the number of days supply from 24.3 days in 1994 to 18.7 days in 2004 (5.6 days) multiplied by the daily crude oil inputs to refiners and blenders in 2004. Similarly, reductions in days supply at all locations for the three component light refined products between 1994 and 2004 were calculated and multiplied by the daily 2004 U.S. demand levels for these fuels. Second, these stocks were then valued using 2004 prices. Finally, the carrying cost savings were calculated by multiplying the reduction in the value of inventories held by a reasonable long-term capital cost rate of 12 percent. A long-term rate is appropriate because these inventory reductions are viewed as permanent.
50
Table 1-13 The 2004 Storage Cost Savings Due To Reducing the U.S. Days Supply of Crude Oil and Light Products Between 1994 and 2004173 Storage Cost Reduction in U.S. Stocks
Savings (Millions $)
Commercial Crude Oil
$362
Light Refined Products
$592
Total
$954
Sources: Change in Days Supply: Tables IV-1 and IV-2. Usage: U.S. refinery and blender net inputs of crude oil: EIA Petroleum Navigator, Supply and Disposition at http://tonto.eia.doe.gov/dnav/pet/pet_sum_snd_c_nus_epc0_mbblpd_a.htm. Products Usage: EIA Petroleum Navigator, Supply and Disposition for Finished Motor Gasoline at http://tonto.eia.doe.gov/dnav/pet/pet_sum_snd_c_nus_epm0f_mbblpd_a.htm, Distillate Fuel Oil at http://tonto.eia.doe.gov/dnav/pet/pet_sum_snd_c_nus_epd0_mbblpd_a.htm, and Kerosene-Type Jet Fuel at http://tonto.eia.doe.gov/dnav/pet/pet_sum_snd_c_nus_epjk_mbblpd_a.htm. Storage Costs: EIA Oil Market Basics, Stocks at http://www.eia.doe.gov/pub/oil_gas/petroleum/analysis_publications/oil_market_basics/Stocks_Text.htm.
Therefore, the annual cost savings from reduced inventories, valued using 2004 volumes and prices, total approximately $1.9 billion, or 33 percent of the current inventory carrying and storage costs. Annual cost savings of this magnitude will persist if prices remain at or above 2004 levels. Petroleum firms achieve these cost savings without sacrificing reliability of supply for their customers. Indeed, the FTC found that “[b]ecause refiners have many repeated interactions with their customers, they have a strong incentive to provide customers with product reliability, both to maintain existing business and to win future business. Refiners’ frequent ownership of
173
The typical long-run cost for storing a barrel of crude oil is about 35 cents per month or $4.20 per year. For light refined products, the typical long run storage cost is about 50 cents per month or $6.00 per year. The reductions in the crude oil inventories and light refined product inventories due to the reduction in days supply are multiplied by $4.20 and $6.00, respectively, per barrel to calculate the annual reduction in storage costs. For the actual 2004 storage cost, an average of company-owned and leased storage costs from the EIA were used, which are $2.75 per barrel per year for crude oil and $4.00 per barrel per year for light refined products. EIA, Oil Market Basics, Stocks at http://www.eia.doe.gov/pub/oil_gas/petroleum/ analysis_publications/ oil_market_basics/Stocks_Text.html.
51
the brand names used by retail stations furnishes them with a further incentive to maintain a reliable supply.”174 2.
A Recent FTC Investigation Found That Petroleum Firms Do Not Adjust Inventory Levels to Manipulate Gasoline Prices
During its investigation into nationwide gasoline prices during late 2005 and early 2006, the FTC examined petroleum firms’ inventory levels.175 The Commission indicated that “[t]he decline in inventories has given rise to concerns that markets for gasoline and other petroleum products are more susceptible to supply and demand shocks than they once were” and that “[t]hese developments give rise to theories that oil companies benefit from low inventory levels and that the decline in inventories over time reflects a strategy to manipulate markets.”176 Consequently, the FTC investigated whether firms had colluded “to reduce inventory at the terminal level to elevate prices during market disruptions.”177 In doing so, the Commission compared the inventory holding patterns for a select group of firms between 2001 and 2005 across metropolitan statistical areas (“MSAs”) and consolidated metropolitan statistical areas.178 The Commission found “no evidence that oil companies have adjusted inventories to manipulate markets.”179 Indeed, as discussed above, the Commission found that inventories had declined because “[i]t is expensive to maintain inventories, and an important aspect of modern manufacturing strategy is to reduce such costs.”180 Additionally, the Commission’s review of economic literature on strategic inventory holdings indicated that “anticompetitive motives would give rise to higher, not lower, levels of inventory. For instance, higher inventories can act to deter new entry, in much the same way that excess production capacity acts as such a deterrent.”181 Lower inventory levels have no such entry deterring effect, and in fact, lower the capital requirements necessary to support entry. Moreover, the Commission found that “firms might use higher inventories to deter deviations from a tacit collusion that may occur when prices spike and the members of the collusive group have the greatest incentive to cheat on the agreement.”182 Finally, the Commission’s analysis of individual firms’ inventory holdings 174
GASOLINE PRICE REPORT, supra note 53, at 46.
175
Energy Policy Act of 2005, Pub. L. No. 109-58, § 1809, 119 Stat. 594 (2005); Sci., State, Justice, Commerce, and Related Agencies Appropriations Act, 2006, Pub. L. No. 109-108, § 632, 119 Stat. 2290 (2005). 176
GASOLINE PRICE REPORT, supra note 53, at 45.
177
Id at 48.
178
Id. at 48-49.
179
Id. at 45.
180 181 182
Id. Id. at 47. Id.
52
revealed “that at any point in time there is considerable variation, both within an MSA and across MSAs, among the inventory-to-sales ratios of individual firms.”183 Ultimately, the Commission found that “[t]hese data do not provide evidence that firms have been coordinating their inventory holdings.”184 In summary, the Commission categorically rejected allegations that inventory levels were unilaterally or collectively managed to manipulate gasoline prices. 3.
Requiring Excess Inventory Would Be Costly and Ineffective
Firms have maintained reliability through efficiencies in inventory management while reducing their inventories. Some government officials have asked whether maintaining large inventories of refined petroleum products in the United States would help mitigate price increases following major supply disruptions. The reduction in inventories that occurred during the last decade, however, had little impact on the ability of the industry to respond effectively to the major disruptions caused by Hurricanes Katrina and Rita. In the areas that the hurricanes directly impacted, stock availability was not the issue. Rather, the immediate cause of supply shortage was disruption to refineries, pipelines, terminals, and retail stations rendered inoperable by power shortages. In addition, the hurricanes closed down or damaged many of these facilities. Thus, any inventories held in these facilities were unavailable. Inventories available to alleviate supply shortages after the hurricanes included only those held at terminals that were operable. In any event, the reduction in inventories of gasoline held at all U.S. terminals since 1994, while resulting in significant cost savings, amounts to only a little over one day of normal supply.185 Given the substantial supply disruptions and the increase in demand following the hurricanes, holding inventories at 1994 levels would have had only a very minor effect in ameliorating the supply disruptions. Inventories alone cannot constitute a significant response to major supply disruptions. Many other strategies to increase supply, including increasing imports, maximizing gasoline production (particularly with product specification waivers), and shifting supplies from other areas are needed to restore the supply-demand balance rapidly and effectively. E.
The Profitability of the Oil Industry Is Commensurate with Other Industries Over the Long Run
Critics have excoriated the recent high profits of oil companies, claiming they show noncompetitive performance. Economists, however, no longer believe that high profits signal a noncompetitive industry. In any event, viewed over time, petroleum firms’ profits and ROI are commensurate with those of other industries. 183 184
Id. at 49. Id.
185
The average days supply for finished motor gasoline plus blendstocks at terminals was 9.8 days in 1994 and 8.6 days in 2004.
53
Petroleum ranks among the most capital intensive industries. Operating an oil company requires substantial long-term investments in capacity, technology, and research and development, as well as continual investment to meet changing environmental and other government requirements. Between 1992 and 2006, the U.S. oil industry invested more than $1.25 trillion in long-term energy initiatives, an amount that far outpaced its net income of $900 billion.186 Although the petroleum business has high profits in some years and lean ones in others, these substantial investments are made annually. In 2006, new investment by the U.S. petroleum industry exceeded $174 billion (a 29 percent increase from 2005).187 Investment by the industry continues to climb. During 2007, the oil and natural gas industry plans $183 billion in new projects for the United States, outstripping last year’s investments by $7 billion.188 In part, these investments will fund the U.S. capacity expansions projected to add the equivalent of eight average-sized refineries by 2011. While requiring sizeable investment, the U.S. petroleum industry’s ROI and profits have been highly cyclical and, over time, are commensurate with (or fall below) ROI and profits for other U.S. industries. Although petroleum industry ROI and profits have been strong in recent years, they follow an era of significantly below average ROI and profits in the 1990s, and other periods of depressed returns. 1.
Returns on Investment Generally Have Been at or Below the Average for Other Industries
Historically, the petroleum industry has experienced cyclical rates of return on its investment, with many periods of low or negative rates of return. In August 2004, the FTC’s Bureau of Economics reported that the financial returns of the U.S. refining industry have been below average over the long term.189 Based on EIA data from 1995-2005, the return on investment for the refining sector was 10.0 percent, about 4.7 percent less than returns realized by the S&P Industrials.190 Over the longer time period of 1977 to 2005, the oil industry rate of return averaged less than seven percent, compared to nine percent for durable goods and more than 11.5 percent for the S&P 500 industrials.191 (See Figure 1-9, reproduced from Dahl 2007.)
186
AMERICA’S OIL AND NATURAL GAS INDUS.: PUTTING EARNINGS INTO PERSPECTIVE, AM. PETROLEUM INST. 4 (Apr. 2007) at http://new.api.org/statistics/earnings/upload/PuttingEarningsintoPerspective_052507.pdf (hereinafter “API Earnings Paper”). 187 188 189
Id. (sourced from Ernst & Young data). Id. OIL MERGER REPORT, supra note 35, at 62.
190
EIA, Performance Profiles of Major Energy Producers (based on Financial Reporting System (“FRS”) figures for 29 major oil companies, and 2005 S&P figure based on Compustat data compiled by PWC). 191
Carol Dahl, What Goes Down Must Come Up: A Review of the Factors Behind Increasing Gasoline Prices, 1999-2006, 29 (Apr. 2007) (hereinafter “Dahl 2007”).
54
Figure 1-9
55
The FTC’s Oil Merger Report also uses EIA data to analyze the return on domestic investment for three individual segments of the U.S. oil industry (production, refining/marketing, and pipelines).192 Table 1-14 presents the average returns from investment in the U.S. petroleum industry and in the three segments for two periods: 1987 through 1995 and 1996 through 2003. As the chart indicates, the rate of return for the refining segment of the industry has been at or below the rate of the return for production or pipelines. The table also shows that returns vary considerably, with variability increasing more recently in most segments.
Table 1-14 Return on Investment (Average and Volatility) Standard Deviation Average Return by Percent U.S. Petroleum Industry
(Volatility) of Return by Percent
1987-1995
1996-2003
1987-1995
1996-2003
Total U.S. Petroleum Industry
5.4
9.6
1.2
3.7
Refining and Marketing
4.9
7.1
5.0
4.7
Oil and Gas Production
4.9
11.6
1.7
5.5
Pipelines
9.6
7.1
1.9
2.4
Source: EIA, Performance Profiles of Major Energy Cos. 2003 at http://www.eia.doe.gov/emeu/perfpro/index.html and previous reports at EIA, Publications, Library/Archives, Tables B8 and B6 at http://tonto.eia.doe.gov/bookshelf/SearchResults.asp?title=&product=&submit2=AZ%2BList%2Bof%2Bpublications, (earlier editions).
192
According to EIA, U.S. Production includes information from firms that produce and sell U.S. crude oil, natural gas, and natural gas liquids. To be included in the data, EIA requires that sales of U.S. crude oil must be made to the U.S. Refining/Marketing segment. U.S. Refining/Marketing includes information from firms that purchase raw materials from the U.S. Production segment, from the foreign refining/marketing segment, and from third parties for refining or sale to third parties. This segment also includes purchases made directly from the foreign production segment for those companies that do not have foreign refining/marketing divisions and that import all foreign production and purchases. U.S. Pipelines includes information from firms that transport crude oil and refined petroleum products, through Federal- or State-regulated pipeline operations. “Prior to the 2003 reporting year, transport of natural gas and natural gas liquids are also included in the pipeline segment.” EIA, PERFORMANCE PROFILES OF MAJOR ENERGY COS., APPENDIX A: STRUCTURE OF THE FIN. REPORTING SYS. - Form EIA-28 (2003) at http://www.eia.doe.gov/emeu/perfpro/appenda.html#petovw.
56
2.
Over Time, the Petroleum Industry’s Earnings Have Been Commensurate with Earnings in Other Industries
The petroleum industry’s earnings typically have been commensurate with earnings in other industries. In some periods, U.S. petroleum earnings have fallen significantly below those of other industries, as they did during the 1990s and in other “bust” periods. In the past few years, greater than forecasted demand and other factors, including massive supply disruptions from natural disasters, have generated industry earnings that are above average. From 20022006, earnings per dollar of sales for manufacturing industries equaled 6.4 cents, compared to 7.4 cents for the oil industry. For 2006, all manufacturing industries averaged annual earnings of 8.2 cents on each dollar of sales, while the oil industry averaged 9.5 cents.193 (See Figure 1-10.)
Figure 1-10 2006 Industry Earnings
21.6
Pharmaceuticals and Medicines Beverage and Tobacco Products
17.2 14.2
Elec. Equip., Appliances, Components Chemicals
13.7 13.4
Computer and Perhipheral Products Oil and Natural Gas
9.5 8.8
Iron, Steel, and Ferroalloys All Manufacturing
8.2
Machinery
7.7
Apparel and Leather Products
7.6
Aerospace Products and Parts
6.7
Furniture and Related Products
5.2
Food
5.2
Paper
4.3
Plastics and Rubber Products
3.6
Textile Mills and Textile Product Mills
3
Motor Vehicles -2.5
Cents Per Dollar
Source: API Energy Earnings (April 2007), based on company filings with the federal government as reported by the U.S. Census Bureau and Oil Daily.
193
U.S. Census Bureau figures for U.S. manufacturing, and API calculations based on company filings with the federal government for the oil and natural gas industry.
57
Similarly, each segment of the petroleum industry has been more profitable recently. The increased price of crude oil, the strong U.S. economy that has generated greater than expected demand for refined products,194 worldwide demand increases for refined product, and capacity constraints from the 2005 hurricanes (with some residual effects on refinery schedules) have coalesced to create above-average profits in 2004-2006. As noted, however, the recent growth in demand and the resulting increase in profitability are not unprecedented in the U.S. oil industry, and usually are followed by periods of reduced, below average, profitability.195 F.
Conclusion
The realities of the petroleum industry’s composition, concentration, and practices differ markedly from widely held perceptions. As detailed in this Chapter, the petroleum industry remains only moderately concentrated, and well below the concentration levels found in other industries. New entry and vertical disaggregation have brought increased competition in many segments of the petroleum industry, including retailing and refining. Further, concentration levels serve only as an initial screen for antitrust analysis, and are not at levels in the oil industry that are likely to impact competition or price. Moreover, the FTC provides heightened antitrust scrutiny of the petroleum industry, including challenging mergers at lower levels of concentration than mergers in other sectors. In its in-depth oil industry examinations and investigations, the Commission has found no linkage between concentration changes and gasoline prices. In response to growing demand for refined petroleum products, U.S. refiners have expanded capacity substantially and have been operating at maximum sustainable utilization. Using more cost-effective and timely expansions of existing facilities, rather than new builds, U.S. refiners added the equivalent of 20 new average sized refineries between 1994 and 2004. Government projections estimate that U.S. refiners will expand capacity by the equivalent of an additional eight refineries by 2012. Despite increasing requirements for the production of boutique fuels and new environmental regulations, U.S. refineries ran at average utilization rates of approximately 93 percent from 1994 to 2004. Moreover, the FTC’s 2006 investigation of the industry found that refiners work to operate their refineries at full sustainable utilization and to limit planned downtime for maintenance, repairs, and conversions, as well as minimize unplanned downtimes from weather and other unforeseen calamities. While U.S. capacity has increased substantially, the United States also has used imports as an important and cost-effective source of additional supply. 194
In industries in which significant capacity expansions take time and for which demand is relatively inelastic in the short run, profitability will increase when demand increases significantly (and profitability will decline when demand falls relative to capacity). 195
In 2002, net income for EIA FRS energy companies was 45 percent below 2001, and 61 percent below 2000 earnings. Additionally, the refining/marketing segment of the domestic oil industry experienced an aggregate net loss of $0.3 billion (for EIA FRS companies), EIA, Energy Plug: Performance Profiles of Major Energy Producers (2002) at http://www.eia.doe.gov/emeu/plugs/plmep02.html.
58
Finally, the profitability of the petroleum industry is commensurate with other industries over the long run. Despite highly variable rates of return, with many periods of low or negative returns, the industry consistently invests billions for expanding capacity, improving technology, conducting research and development, and meeting changing environmental and other government requirements. Between 1995 and 2005, the return on investment for the refining sector was 10 percent, about 4.7 percent less than returns realized by the S&P Industrials. While greater than forecasted demand and other factors (including massive disruptions from natural disasters) have generated recent above average industry earnings, these earnings follow many industry “bust” periods when U.S. oil earnings fell well below those of other industries.
59
CHAPTER TWO: ANTITRUST SCRUTINY OF MERGERS IN THE OIL INDUSTRY This Chapter considers antitrust analysis of mergers in the oil industry. The petroleum sector has undergone significant restructuring, especially during the merger wave of the late 1990s. Many resulting transactions enabled the merging firms to achieve economies of scale and scope in research and development, production, distribution, and marketing. Evidence indicates that recent merger activity also produced significant cost savings, improved resource management, and increased innovation and technology diffusion. For leading firms, merger synergies have generated billions of dollars in savings — savings that enable them to operate, and compete, more efficiently. Moreover, strict FTC review has ensured that the achievement of these large efficiencies has not come at the cost of conferring market power on the merged firms. No industry receives greater scrutiny from the FTC than the oil industry. The FTC devoted nearly one-quarter of the Bureau of Competition’s entire enforcement budget to the energy industry during the merger wave. The Commission has brought more merger cases at lower levels of concentration for oil industry transactions than those involving any other industry. These cases have been built through a fact-intensive, case-by-case approach to determine whether a merger may increase the parties’ ability to exercise market power, either unilaterally or through coordination with other firms, in properly defined markets. The FTC frequently has required substantial divestitures and other conditions to preserve competition for the benefit of consumers. Critics of the petroleum industry rely on a 2004 report by the Government Accountability Office (“GAO”) to assert that a few oil industry mergers have increased gasoline prices.196 The GAO report, however, can support no such claim. GAO based its report on fundamentally flawed analyses, using models with major methodological mistakes that make its quantitative analysis unreliable, at best, and invalid in most instances. Markets are misspecified, estimations are inconsistent, and critical variables are omitted. When the FTC tested for robustness by using alternative model specifications or variables, the GAO model failed to generate results consistent with the report’s conclusions. Moreover, the agency examined some of the same mergers analyzed by GAO. After extensive econometric analyses of pricing data and review of internal company documents, FTC staff found no reliable evidence that these mergers had harmed consumers. Despite lacking an empirical basis for doing so, some legislators favor abandoning the antitrust agencies’ well-tested approach for merger review in favor of novel and unique standards for oil mergers. For example, Senator Kohl has proposed to shift the burden of proof to merging parties in the oil and gas markets.197 As the bipartisan Antitrust Modernization Commission observed just this year, however, there exists a general consensus that the agencies’ approach to 196
GAO REPORT, supra note 82.
197
Oil Industry Merger Antitrust Enforcement Act, S. 878, 110th Cong. (Mar. 14, 2007).
60
analyzing mergers is sound. The current system is not broken: the agencies can and do challenge mergers at low thresholds of anticompetitive effects. Moreover, replacing the current system with industry-specific rules threatens to politicize merger policy, encourage rent-seeking behavior, create judicial confusion, and generate high administrative burdens. The effectiveness of the existing merger review system, coupled with the harms threatened by proposed alternatives, creates a high burden for proponents of wholesale change – a burden that simply has not been met. Proposals to shift the burden of proof to the merging parties would not have prevented the government’s recent loss in FTC v. Foster. In Foster, the FTC unsuccessfully sought to enjoin the acquisition of Giant Industries by Western Refining, alleging that the deal would reduce the bulk supply of gasoline to New Mexico. The court found that the Commission made a prima facie case under the Merger Guidelines, and shifted the burden to the defendants. The defendants successfully rebutted the FTC’s case by showing that there were many additional actual or potential competitors in the market, that these competitors could easily replace lost capacity resulting from the merger, and that market factors would prevent the defendants from unilaterally increasing prices. Foster is simply an example of the FTC’s aggressive enforcement in the petroleum industry; the facts of the case determined the outcome, not the burden of proof. Section A of this Chapter explains that the pursuit of economies of scale and other operational and organizational efficiencies has motivated petroleum industry mergers. For leading firms, merger synergies have generated billions of dollars in savings — savings that enable them to operate, and compete, more efficiently. Section B explains that these large efficiencies have not come at the consumers’ expense; in fact, the FTC applies more stringent merger review standards to the oil industry than to any other. Despite the FTC’s aggressive enforcement in this industry, however, some critics rely on a 2004 GAO report to assert that a few mergers have increased gasoline prices. Section C details why the GAO report cannot support these claims. Section D explains that the current merger review regime is sound. Section E provides a recent example of an unsuccessful government challenge to an oil industry merger that reinforces why the current antitrust standards for merger enforcement are appropriate. Proposals to shift the burden of proof to the merging parties would not have prevented the government’s recent loss. Finally, Section F contains concluding thoughts. A.
Merger Activity During the 1990s Was Driven by the Pursuit of ─ and Has Achieved ─ Significant Efficiencies
As have many other U.S. and global industries, the petroleum sector has undergone significant restructuring, especially during the merger wave at the end of the late 1990s. Reversing an earlier trend of divestitures by leading firms, a series of petroleum mergers occurred. The oil business witnessed several whole-company mergers among industry leaders as well as many smaller transactions (asset or business unit acquisitions). Many of these transactions enabled the merging firms to achieve economies of scale and scope in research and development, production, distribution, and marketing. These mergers led to significant cost savings, improved resource management, and increased innovation and technology diffusion.
61
The FTC’s recent Oil Merger Report examined the rationales and efficiency claims asserted by merging parties.198 These efficiencies fall into several major categories, including: o Operating Synergies •
Cost savings arising from the reorganization of the combined business.
•
Examples include cost savings arising from reducing redundant administrative and corporate overhead functions.
•
Operating synergies are substantial (e.g., Shell/Texaco: $3 billion in savings from operating synergies).199
o Refinery/Distribution Synergies •
Synergies arising from the integration of refinery, pipeline, or other distribution systems.
•
Larger refinery systems allow firms to move feedstocks and blending stocks across refineries, which leads to more efficient use of capacity at each refinery.
•
Larger distribution systems allow firms more timely access to markets when arbitrage opportunities arise.
•
Refinery/distribution synergies are substantial (e.g., Exxon/Mobil: $1.4 billion in savings from improved capacity utilization).200
o Scale Economies •
Consolidation among smaller, independent producers in the exploration and development sectors creates a critical mass that allows the combined firm to undertake larger scale projects.
•
Combining relatively close producing properties results in cost savings from a denser operating footprint.
•
Consolidation among larger firms allows the combined firm efficiently to manage and allocate the increasing risk associated with exploration and production, especially in remote or politically unstable areas. BP’s acquisition of Amoco, the
198
The following discussion of efficiencies is from the FTC’s OIL MERGER REPORT, supra note 35, at 100-05, and Table 4-15, 121. 199 200
Id. Id.
62
Exxon-Mobil merger, and the Conoco Phillips merger are examples of such transactions among large firms. In addition to those synergies identified by the FTC in its Oil Merger Report, merging parties have asserted additional merger rationales and efficiencies: o Scale economies associated with mergers may allow firms to respond more effectively to supply disruptions.201 o Mergers may facilitate moving assets from firms unable to make capacity expansions to those with the ability and expertise to do so.202 o Diffusion of intellectual and managerial capabilities over a larger base may have significant beneficial effects.203 o Moreover, while we were at the FTC, agency economists recognized, and oil industry executives argued persuasively, that mergers would contribute significantly to the efficient refining practices discussed in Chapter One. By combining two companies “best practices,” the newly merged entity accelerates the “debottlenecking” process, expands refinery capacity, and further increases the yield of light refined products from a barrel of crude oil. Evidence indicates that the recent merger activity in the petroleum sector has, in fact, achieved such efficiencies. Two recent mergers exemplify the significant efficiencies that the Oil Merger Report discussed. First, the 1999 merger between Exxon and Mobil resulted in pretax cost savings of over $7 billion by 2002, far in excess of the $2.8 billion in pre-tax savings projected when the merger was announced.204 Post-merger investments in new refinery technologies and processes reduced costs and increased efficiency. State-of-the-art refining technologies enabled the combined company to switch to lower-cost crude oil inputs, without adversely impacting the yield of high value products. Improvements in energy efficiency 201
Consolidation in the Oil and Gas Industry: Raising Prices? Hearing before the S. Comm. on the Judiciary (Mar. 14, 2006) (statement of Ross Pillari, President and CEO, BP America, Inc.) (hereinafter “Pillari Statement”) at http://judiciary.senate.gov/testimony.cfm?id=1804&wit_id=5148. 202
See, Consolidation in the Oil and Gas Industry: Raising Prices? Hearing before the S. Comm. on the Judiciary (Mar. 14, 2006) (statement of William R. Kleese, CEO, Valero Energy Corporation) at http://judiciary.senate.gov/testimony.cfm?id=1804&wit_id=5150; Consolidation in the Oil and Gas Industry: Raising Prices? Hearing before the S. Comm. on the Judiciary (Mar. 14, 2006) (John Hofmeister, Shell Oil Company). 203
Pillari Statement, supra note 201.
204
Exxon Mobil Corp., Form 10-K, Annual Report for the Fiscal Year Ended December 31, 2002, at 33 at http://ir.exxonmobil.com/phoenix.zhtml?c=115024&p=irolSECText&TEXT=aHR0cDovL2NjYm4uMTBrd2l6YXJkLmNvbS94bWwvZmlsaW5nLnhtbD9yZXBvPXRlbmsma XBhZ2U9MjA3NDA2MCZhdHRhY2g9T04=.
63
reduced refinery operating costs. The merged firm was better able to optimize its inventories while maintaining reliability of supply. These cost savings, in turn, enabled ExxonMobil to compete more efficiently. Other merged petroleum companies have undertaken similar efforts to reengineer their systems and operations, generating a ripple effect of diffused efficiencies throughout the industry. Consumers have been the ultimate beneficiaries. Second, the merger that created ConocoPhillips also has resulted in significant savings and efficiencies. By the end of 2004, sixteen months into the merger, the company had documented cumulative cost and efficiency savings of $1.9 billion.205 Exploration and production efforts expanded as the company benefited from the increased scale, improved financial strength, and project diversification arising from the merger. By combining the technologies and best practices of Conoco and Phillips, the merged entity has improved its reliability and increased its ability to produce clean refined products. Indeed, these technology synergies also helped improve refinery utilization significantly, adding the equivalent of a 100 kbd refinery. With its enhanced scope, the company has achieved “greater balancing options among waterborne cargoes, pipeline receipts, and inventories” and has greater volumes of clean products because of an increased ability to balance blendstocks and inventories.206 207 The cost savings that the industry has achieved during the last 25 years – through merger or otherwise – have been dramatic. In 1980, it cost 99 cents (in inflation-adjusted terms) to refine, distribute, and sell a gallon of gasoline at retail. By 2005, that margin was cut in half, to 48 cents per gallon.208 Mergers and related transactions have contributed significantly to these improvements. B.
The FTC Applies Tougher Standards to Mergers in the Oil Industry Than to Mergers Elsewhere
The FTC plays a key role in maintaining competition in energy markets to protect consumers. The agency examines any conduct in the industry that could decrease competition and thus harm consumers of gasoline and other petroleum products. It has been an especially vigilant investigator of proposed mergers.
205
Consolidation in the Oil and Gas Industry: Raising Prices? Hearing before the S. Comm. on the Judiciary (Mar. 14, 2006) (statement by James Mulva, Chairman and CEO, ConocoPhillips) at http://judiciary.senate.gov/testimony.cfm?id=1804&wit_id=5149. 206
Id.
207
Phillips’ pre-Conoco acquisition of Tosco resulted in significant merger efficiencies as well, including additional investment in Tosco’s refining assets, investments that Tosco, as a small independent, could not undertake. Id.
208
Rex W. Tillerson, Chairman and CEO, ExxonMobil Corp., Remarks to the National Petrochemical and Refiners Association (Mar. 21, 2006) at http://www.exxonmobil.com/Corporate/Newsroom/spchsIntvws/Corp_NR_SpchIntrvw_RWT_210306.asp.
64
The FTC devotes substantial government resources to investigating proposed transactions in the industry. The agency has committed hundreds of thousands of staff hours and substantial Commission time to evaluating proposed petroleum mergers, acquisitions, and joint ventures. “These investigations have involved the review of thousands of boxes of documents in discovery, examination of witnesses under oath, and exhaustive questioning of outside experts.”209 During the period of large oil industry mergers in the late 1990s, the FTC’s Bureau of Competition spent almost one-fourth of its enforcement budget on investigating transactions in the energy industry.210 When examining a merger, the FTC conducts a thorough, fact-intensive analysis to assess the likelihood that it may lessen competition. Most mergers, including those involving petroleum products, are unlikely to raise antitrust concerns. In many transactions, for example, the merging companies do not compete in the same relevant markets. They may operate in different regions, or they may sell different types of products. In other transactions, although the merging companies may compete in one or more relevant markets, their combined market share may be so low that any attempt to increase price would be defeated. If the merged entity were to raise prices, customers likely would switch their purchases to competing firms. Moreover, mergers among firms operating in the same market may lower costs, thus equipping the combined company to compete more effectively against other firms in the market. If, after conducting a comprehensive analysis, the FTC concludes that the proposed transaction presents a likelihood of significant competitive harm, the agency will seek remedies or attempt to block the transaction to ensure that it does not harm consumers. The FTC applies the standards outlined in the government’s Merger Guidelines more strictly to the oil industry than to other industries. Merger investigation and enforcement data show that the Commission has brought more merger cases at lower levels of concentration in the petroleum industry than in other industries. Figure 2-1 demonstrates that the average postmerger concentration level for mergers requiring divestitures was significantly higher in every other industry investigated by the FTC or the Department of Justice Antitrust Division (“DOJ”) – including grocery, chemicals, pharmaceuticals, telecommunications, banking, dairy, and waste disposal – than it was for the petroleum industry.211
209
Kovacic Market Forces 2007, supra note 31, at 9.
210
Market Forces, Anticompetitive Activity, and Gasoline Prices: FTC Initiatives to Protect Competitive Markets, Hearing before the H. Subcomm. on Energy and Air Quality (July 15, 2004) (presented by William E. Kovacic) (hereinafter “Kovacic 2004”) at http://www.ftc.gov/os/2004/07/040715gaspricetestimony.pdf. 211
The average is a weighted average that was constructed from merger challenge data released by the FTC and DOJ. See FTC Horizontal Merger Investigation Data, Fiscal Years 1996-2003 (Aug. 31, 2004) at http://www.ftc.gov/os/2004/08/040831horizmergersdata96-03.pdf2004; FTC and the U.S. Department of Justice, Merger Challenges Data, Fiscal Years 1999-2003 (December 18, 2003) at http://www.ftc.gov/os/2004/08/040831horizmergersdata96-03.pdf. The weighted averages are as follows: Dairy (6,702), Other (5,875) (using data for the period 1999-2003), Pharmaceuticals (5,841), Chemicals (5,176), Telecommunications (4,951), Waste Disposal (4,847), Grocery Retailing (4,097), Banking (3,757), and Petroleum (2,771). The weighted average was constructed using the midpoint of the HHI ranges used in the data release, with 65
Figure 2-1 Oil Industry Mergers are Challenged at Lower Levels of Concentration than Other Industries 8000 7000 6000 5000 4000 3000 2000 1000
O il
ng Ba nk i
G ro ce ry
W as te
Te le co m
ica l Ch em
Ph ar m a
O th er
Da i
ry
0
Weighted Average Post Merger HHI for Mergers Subjected to Government Enforcement
the exception of the range 0-1799, where the value of 1599 was used. (The FTC/DOJ data release indicated that the lowest post-merger HHI in a challenged market was slightly above 1400.) In January 2007, the FTC released updated data for the years 1996-2005, but industry-specific concentration data was not separately provided for 2004 or 2005, making it impossible to extend our data series. The updated FTC data release is at http://www.ftc.gov/os/2007/01/P035603horizmergerinvestigationdata19962005.pdf. Industry-specific data was provided for the period 2001-2005, but the number of observations was significantly less than that for the period 1996-2003, and no comparable DOJ data was released. Consistent with the 1996-2003 data release, the only challenges between FY 2001-2005 occurring at post-merger HHIs below 2000 were in the petroleum industry. Calculations prepared using the 2001-2005 data are consistent with those presented in the table: Other (7,153), Chemical (6,331), Pharmaceutical (5,882), Grocery Retailing (5,587), and Petroleum (2,878).
66
Figure 2-2 provides additional insight into the FTC’s enforcement patterns in the oil industry.212 This figure identifies, for various industries, the percentage of enforcement actions occurring at or below the 2400 post-merger HHI level. Oil is the only industry for which the government persistently has undertaken enforcement actions at or below this concentration level. Historical data show that almost two-thirds of enforcement actions in the petroleum industry have occurred in this HHI range, while the next-closest industry – banking – had fewer than onequarter of enforcement actions occurring in this HHI range. Enforcement at this level of concentration in other industries is minimal to non-existent.
Figure 2-2 Oil Industry Mergers Are Challenged at Lower Levels of Concentration than Other Industries 0.70
0.60
0.50
0.40
0.30
0.20
0.10
0.00 Oil
Banking
Grocery
Chemical
Pharma
Other
Dairy
Telecom
Waste
Percentage of Enforcement Actions Occurring At or Below the 2400 Post-Merger HHI Level
Source: FTC Merger Data Release, Feb. 2004.
212
Data is from merger challenge data released by the FTC and DOJ. (See FTC Horizontal Merger Investigation Data, Fiscal Years 1996-2003 (Aug. 31, 2004) at http://www.ftc.gov/os/2004/08/040831horizmergersdata9603.pdf2004); Federal Trade Commission and the U.S. Department of Justice, Merger Challenges Data, Fiscal Years 1999-2003 (Dec. 18, 2003) at http://www.ftc.gov/os/2004/08/040831horizmergersdata96-03.pdf). The percentage of industry-specific challenges occurring at or below an HHI of 2400 are: Petroleum (64 percent), Banking (23 percent), Grocery Retailing (9.3 percent), Chemicals (5.2 percent), Pharmaceuticals (4.2 percent), Other (1.6 percent), Dairy (.6 percent), Telecommunications (.5 percent), and Waste Disposal (0 percent).
67
In no other industry between 1996 and 2005 (the period covered by FTC data releases) did the Commission issue a challenge in which concentration was as low as in the petroleum industry. Of all merger enforcement actions at concentration levels below an HHI of 1800,213 97 percent involved the oil industry. Moreover, data show that the Commission normally does not indicate concern or take action with respect to a merger unless there would be four or fewer significant competitors after the transaction. In the oil industry, there have been enforcement actions in markets in which a merger has left as many as seven competitors. More than 60 percent of petroleum merger enforcement took place in markets involving five or more significant competitors, while substantially all merger enforcement in other industries occurred in markets with four or fewer competitors. The FTC’s heightened scrutiny of petroleum mergers has resulted in significant remedies. As FTC Commissioner Kovacic testified before Congress in May, Statistics on FTC merger enforcement in the petroleum industry show that, from 1981 to 2007, the agency filed complaints against 21 petroleum mergers. In 13 of these cases, the FTC obtained significant divestitures. Of the eight other matters, the parties in four of the cases abandoned the transaction altogether after agency antitrust challenges.214 Most of these enforcement actions resulted in remedies relating to downstream sectors of the industry, i.e. refining, refined products pipelines, terminals, and marketing.215 The Commission principally has focused on whether a proposed merger would “enable the merged firm to raise prices for products that it sells to the next level of the industry (e.g., refined products sold to wholesalers, or wholesale products sold to retailers) through either unilateral or coordinated behavior.”216 “Some enforcement actions have been based on a potential competition theory; some on competitive problems involving market power held by a buyer or a group of buyers; and some on vertical concerns relating to the ability of a single firm or a 213
Industry concentration is determined by calculating the Herfindahl-Hirshman Index, which can range from 0 (in an industry with thousands of companies, none of whom has an appreciable market share) to 10,000 (in an industry with a monopolist). An industry with 5 equally-sized firms has an HHI of 2000. 214
Kovacic Market Forces 2007, supra note 31. In the remaining four cases, the FTC imposed significant remedial measures on the transactions, including The Carlyle Group/Kinder Morgan/Magellan Midstream (2007) (ordering the parties to turn Carlyle and Riverstone’s investment in competitor Magellan Midstream into a passive investment); Aloha/Truststreet (2005) (requiring a 20-year terminal throughput agreement for a new gasoline marketer); Chevron/Unocal (2005) (constraining Chevron from enforcing Unocal’s patents on CARB gasoline); and Shell/Buckeye (2004) (requiring the acquiring firm to provide the Commission with advanced notice of its intent to acquire or merge with another entity). Since Commissioner Kovacic’s testimony, the agency lost the Foster case, discussed later in this Chapter, involving a refinery merger in northern New Mexico.
215
See FTC Merger Enforcement Actions in the Petroleum Industry Since 1981 at http://www.ftc.gov/ftc/oilgas/charts/merger_enforce_actions.pdf. 216
Salinger 2007, supra note 18.
68
coordinating group of firms to raise the costs of other firms in the industry to the injury of consumers.”217 The Commission’s extensive antitrust enforcement in this industry during the past decade includes:
217
o
Chevron/Unocal (2005) – Chevron was required to forgo enforcement of the Unocal patents, which were the subject of a separate monopolization claim between the FTC and Unocal.
o
Valero/Kaneb (2005) – Kaneb was required to divest three Philadelphia terminals, its West Pipeline system and related terminals, and two terminals in Northern California.
o
Magellan/Shell (2004) – Shell was required to divest its Oklahoma City terminal assets.
o
Phillips/Conoco (2002) – The parties were required, among other things, to divest Conoco’s refinery in Denver, Phillips’ refinery in Salt Lake City, all of Phillips’ marketing assets in eastern Colorado and northern Utah, Phillips’ terminal in Spokane, and Conoco’s gas gathering assets in each area.
o
Valero/UDS (2001) – The parties were required to divest the UDS refinery in California, bulk gasoline supply contracts, and 70 retail service stations in northern California.
o
Chevron/Texaco (2001) – The parties were required to divest all of Texaco’s interests in two joint ventures, Equilon Enterprises, LLC (owned by Texaco and Shell Oil Company) and Motiva Enterprises, LLC (owned by Shell, Texaco, and Saudi Refining, Inc.). Texaco also was required to divest assets including its onethird interest in the Discovery natural gas pipeline system in the Gulf of Mexico; its interest in the Enterprise fractionating (raw mix separation) plant in Mont Belvieu, Texas; and its general aviation businesses in 14 states.
o
Exxon/Mobil (1999) – ExxonMobil was required, among other things, to divest 2,431 gasoline stations, a refinery in California, Mobil’s interest in the Colonial pipeline or Exxon’s interest in the Plantation pipeline, and Mobil’s terminal operations in Boston and the Washington D.C. area.
o
BP/Amoco (1998) – BP was required to divest nine light petroleum terminals and BP’s or Amoco’s owned retail outlets in eight geographic areas (totaling 134 gasoline stations), and to allow branded sellers in 30 markets (representing more than 1,600 gas stations) to switch their gasoline stations to other brands.
Id.
69
o
Shell/Texaco (1997) – The parties were required to divest Shell’s refinery in Washington state and either party’s inland Southeast U.S. pipeline, and terminal and retail outlets on Oahu.
C.
Empirical Analyses of the Price Effects of Oil Mergers Provide No Basis for Applying More Stringent Merger Standards 1.
The GAO Report
Various studies have examined the price effects of petroleum mergers. Much of this empirical analysis is inconclusive at best and erroneous at worst.218 Before enacting legislation that responds to concerns expressed in those studies, it is imperative to understand their shortcomings. Certain analytically rigorous and robust analyses do exist, and can provide useful insights. Perhaps most misleading is a GAO report released in May 2004. This report purported to analyze how certain petroleum industry mergers or joint ventures during the mid- to late 1990s affected gasoline prices, and whether increased concentration of refinery capacity affected prices. The GAO report has four major flaws: (1) it failed to measure concentration in any properly defined geographic market; (2) it did not address the effects of concentration or mergers on retail pump prices; (3) it did not control for the numerous factors − other than mergers and changes in control − that cause gasoline prices to increase or decrease; and (4) it failed to test its model and assumptions for robustness − that is, the agency failed to determine whether small changes in its models changed the results. The GAO report consisted of two econometric analyses: a study of the effects of particular mergers on prices, and a price-concentration study. GAO’s merger effects analysis attempted to estimate the effects of eight mid- to late-1990s petroleum company mergers on wholesale gasoline prices. Of the eight transactions, GAO concluded that six caused wholesale gasoline prices to rise, and that the other two caused prices to fall. To support this assertion, the report provided twenty-eight estimates of the effects of these mergers on wholesale prices of branded and unbranded gasoline of three types (conventional, reformulated, and CARB219). These merger/price effects analyses showed mixed results. In sixteen cases, GAO found that the merger at issue had a positive and statistically significant effect on a wholesale price, ranging from about 0.4 cents per gallon (“cpg”) to 6.9 cpg. In seven cases, GAO found a negative and statistically significant effect, ranging from about -0.4 cpg to -1.8 cpg. In the other five cases, GAO found no statistically significant effect. Thus, only slightly more than half of GAO’s merger specific results showed an increase in wholesale gasoline prices. 218
See John Gewecke, Empirical Evidence on the Competitive Effects of Mergers in the Gasoline Industry (July 16, 2003) at http://www.ftc.gov/bc/gasconf/comments2/gewecke1.pdf, for a review of the recent empirical literature. 219
California Air Resources Board (“CARB”) gasoline is an ultra-low sulfur gasoline sold exclusively in California by mandate of CARB. See Platt’s Oil Guide to Specifications, Product Specifications at http://www.emis.platts.com/thezone/guides/platts/oil/productspecs.html.
70
GAO’s price-concentration analysis sought to describe the relationship between wholesale gasoline prices and concentration in refinery capacity, measured at the PADD level, from 1994 to 2000. Relying on ten estimates of the effects of concentration on prices, the report concluded that positive, statistically significant correlations exist between PADD-level refinery capacity concentration and wholesale prices. These estimates covered conventional, reformulated, and CARB gasoline and different geographic areas. Seven estimates, all involving either conventional or reformulated gasoline, identified statistically significant concentration increases that GAO associated with wholesale price increases ranging from 0.15 cpg to 1.3 cpg. The GAO report did not find a statistically significant effect of concentration on wholesale prices for unbranded conventional gasoline in the Eastern United States (PADDs I, II, and III).220 Even before one examines the methodological flaws, a cursory review of GAO’s findings reveals that one cannot form strong policy conclusions from GAO’s report. Specifically, GAO did not find that prices consistently increased post-merger. Indeed, in nearly half the cases it found that prices either decreased or were not affected. One economist noted that “there seems to be a distressing variety in the measured outcomes when you take these at face value.”221 An examination of GAO’s methodological flaws provides further reason to avoid basing policy conclusions on its findings. Perhaps the most notable mistake was GAO’s failure to assess competitive conditions within properly defined relevant antitrust markets. If a merger affects competition, it does so in the particular market in which that competition occurs. If the analysis defines a geographic or product market too broadly or too narrowly, it cannot accurately represent that the change in measured concentration caused changes in price. “[R]elatively small errors in measuring the size of the market potentially lead to fairly large and serious measurement errors.”222 In fact, the GAO report fails to measure concentration in any properly defined geographic market. This problem alone makes the conclusions of the GAO report on the relationship of concentration to prices essentially meaningless. An illustration of this fatal flaw can be seen in the way the price-concentration analysis “isolates” each PADD from alternative supply, ignoring the fact that sources beyond local refineries may provide substantial wholesale gasoline supply flows, as discussed in Chapter 1. For geographic areas with significant supply entering the market through pipeline and water transport, market power based on local refinery capacity may be non-existent.223
220
While increases in concentration were associated with increases in wholesale CARB gasoline prices, the results were not statistically significant. 221 222
See Recent Learning, supra note 6, at 114 (Scott Thompson). Id.
223
FTC Bureau of Economics, STAFF ANALYSIS OF GENERAL ACCOUNTING OFFICE REPORT, at 14 (July 2004) (hereinafter “FTC STAFF ANALYSIS”) attached as an Appendix to Kovacic 2004, supra note 210. As the FTC notes, GAO’s analysis of PADD I illustrates the limitations of arbitrarily defining geographic markets. “While the GAO report treats PADD I as a single market, product terminals in the northern and southern parts of PADD I have 71
The second major methodological flaw in the GAO’s analysis was its failure to address the effects of concentration or mergers on retail pump prices. Rack wholesale prices and retail prices do not always move together. An imperfect correlation exists in part because “rack prices do not necessarily measure actual wholesale transactions prices, which are also affected by discounts, and in part because significant quantities of gasoline reach the pump without going through jobbers.”224 By limiting its analyses to wholesale prices, and failing to test for an effect on retail prices, GAO was unable accurately to measure anticompetitive harm to consumers. GAO’s third methodological flaw was its failure to control for the numerous factors − other than mergers and changes in concentration − that cause gasoline prices to increase or decrease. As shown by the FTC’s Bureau of Economics, GAO did not account for changes in gasoline formulation,225 seasonal changes of demand,226 or imports.227 In its merger effects significantly different sources for wholesale gasoline. These sources include pipelines and water shipments. The southern part of PADD I (Maryland and south) has few refineries and is very dependent on shipments via the Colonial and Plantation pipelines and on water shipments from the Gulf area refineries in PADD III. The northern part of PADD I (Pennsylvania and north) has greater local refinery production, but still receives significant supplies from foreign imports and from PADD III.” 224
Id. at 3.
225
Id. at 9, 11. For example, the GAO report does not control for the price of the oxygenate MTBE, which is an important additive and cost component for reformulated and CARB gasoline. A further complicating factor is that there are a number of different formulations of conventional gasoline with different Reid Vapor Pressures (RVP) and oxygenates. These differences in conventional formulations can impact prices significantly: I would worry a lot about this issue … because throughout this period there were a lot of changes in regulations. These changes, in particular the changes in gasoline standards, have made arbitrage across markets much more difficult. Once you make it difficult to arbitrage price differences across markets, prices are likely to rise. That’s a trend throughout this sample period, proceeding in different ways in different markets but possibly correlated with the trend in mergers. . . . Since the mergers are occurring mostly in the latter part of the 90s, it is
important to control for the changes in regulatory standards. . . . These kinds of controls are not included in the GAO study, which leads me to question some of their results, or at least their interpretation of the results. Recent Learning, supra note 6, at 75-76 (Ken Hendricks) (emphasis added). 226
Kovacic 2004, supra note 210, at 10; see FTC STAFF TECHNICAL REPORT: ROBUSTNESS OF THE RESULTS IN GAO’S 2004 REPORT CONCERNING PRICE EFFECTS OF MERGERS AND CONCENTRATION CHANGES IN THE PETROLEUM INDUSTRY 27, 30 (Dec. 21, 2004) (hereinafter “FTC TECHNICAL REPORT”) at http://www.ftc.gov/ftc/workshops/oilmergers/ftcstafftechnicalreport122104.pdf. All else equal, gasoline prices tend to increase in the summer, as stronger demand pushes refineries, pipelines, and other parts of the supply infrastructure to full capacity. The GAO report claims that its variable measuring the ratio of gasoline inventories to estimated demand accounts for such seasonality, id. at 197. This assertion is incorrect. The FTC found that an additional variable that accounts directly for seasonal changes is associated with an additional statistically significant summer price difference of 1 cpg to 2 cpg. This difference significantly affects GAO’s analysis. 227
GAO’s analyses fail to account for the competitive role of imports. There are sizeable seasonal and annual fluctuations in gasoline imports. See data at http://tonto.eia.doe.gov/dnav/pet/xls/PET_MOVE_WKLY_DC_NUSZ00_MBBLPD_4.xls. “[I]n general, we should take into account when there are substantial sales by firms not 72
analysis, moreover, GAO failed to consider critical facts about the individual mergers it studied and exogenous disruptions that impacted short term supply.228 To the extent that these omitted variables are correlated with concentration, mergers, or other variables, these omissions bias GAO’s estimates of the effects of concentration and mergers on wholesale gasoline prices. Similarly, GAO’s estimate of a price-concentration relationship suffers from “spurious correlations.” 229 Its measures of industry concentration show increases over time. Wholesale gasoline prices may increase over time even absent increases in concentration, in part because of the higher costs of producing cleaner fuels. Thus, even with no causal link between concentration and wholesale prices, these two variables may show a positive correlation simply because of the effect of price increases over time. Such correlations are unrelated to the effects of mergers.230 There are other limitations of GAO’s price-concentration study. First, as Ken Hendricks (identified as an advisor to GAO) stated, the variables are at different levels of aggregation.231 In addition, the study contains limited observations, calling into question its explanatory power.232 Commentators noted another significant limitation of GAO’s modeling for the effect of mergers or concentration on price – they measure too many mergers at once to have confidence in the results and implicitly assume that there are no differences in a merger’s effect across areas.233 Finally, GAO’s model falls short of professional standards for testing robustness.234 A researcher should “measure variables in a whole variety of different ways that are plausible and
physically producing within a relevant market, the presence of import into a market. That could change the concentration measures substantially in ways that I’m not sure were taken into account in the GAO study.” See Recent Learning, supra note 6, at 115 (Scott Thompson). When a variable for gasoline imports is added to the GAO report’s variables, the FTC found that this variable is significantly related to gasoline prices. 228
GAO admitted that its controls for supply disruptions were “crude, at best” GAO REPORT, supra note 82, at 116. One commentator stated “[I]t does make me a bit nervous to have a time period that we know has an unusual situation being used to estimate a merger effect.” See Recent Learning, supra note 6, at 105 (Ken Hendricks). 229 230
See FTC STAFF ANALYSIS, supra note 223, at 15, attached as an Appendix to Kovacic 2004, supra note 210. Id.
231
See Recent Learning, supra note 6, at 122 (Ken Hendricks). See also id. at 117 (Jerry Hausman).
232
Id. at 120 (Hal White).
233
Id. at 170 (Ken Hendricks).
234
Id. at 65-66 (Jerry Hausman).
73
show that your results survive . . . [through] a sequence of robustness tests.” 235 When the FTC followed those procedures it “raised some fundamental questions about the GAO results.”236 Changes in the specification of the econometric model used, as well as the choice of model, dramatically impacted results. Small changes to model specification or the inclusion of alternative variables in its models change GAO’s findings significantly. For example, standard event study practices require varying the length and timing of the pre- and post-event windows to ascertain the robustness of the results. GAO did not follow these procedures.237 If the results of the model change when the numbers of pre- and post-merger price observations are changed within reasonable limits, the estimation does not provide a basis for reliable conclusions. GAO did not undertake robustness checks using windows of different lengths, and acknowledges that the lack of such testing limits its results.238 The FTC conducted its own robustness checks on GAO’s model, “examining the empirical results of alternative approaches to controlling for the many factors affecting gasoline price other than mergers and concentration and with differing assumptions relating to statistical properties of the data.”239 The results of these alternative approaches conclusively demonstrate that the GAO model is misspecified and biased. For example, the FTC’s robustness checks found that the inclusion of seasonal controls and different price deflators yielded very different estimated price effects. Moreover, the inventory and utilization rate variables used in the priceconcentration analysis do not sufficiently control for non-merger and non-concentration factors affecting gasoline prices. In addition, the positive relationship between RFG price and concentration is eliminated when an alternative inflation deflator is used, and use of an alternative concentration measure – operating capacity versus operable capacity – shows no or smaller estimated effects of concentration on price.240 In short, the choice of alternate variables 235
Id. at 99 (Dennis Carlton).
236
Id. at 78-79.
237
GAO’s merger effects model estimates the effects of multiple mergers within one equation, rather than uniquely. GAO chose not to standardize the pre- and post-merger time periods – that is, the pre- and post-merger observations are not uniform. For example, GAO measures the effects of the Tosco-Unocal merger over 44 weeks, while it measures the effects of the Shell-Texaco merger over 152 weeks. 238
See GAO REPORT, supra note 82, at 140. The FTC warned GAO of this problem long before GAO published its report. 239
See FTC TECHNICAL REPORT, supra note 226, at 21-43. The FTC’s robustness checks – which involved recreating GAO’s own model and GAO’s original results and then applying alternative techniques and variables – involved GAO’s analysis of merger and concentration effects on the price of reformulated gasoline (“RFG”) and CARB wholesale gasoline prices. 240
Id. On the different results depending on the type of capacity used to construct the HHI, see comments of Ken Hendricks: “[I]f you measured the HHI in a slightly different way, would things change? ... According to what I saw in the FTC staff technical report, use of the FTC[’s] HHI [measurement] caused the GAO results to vanish. [T]hat makes me nervous about the reliability of the GAO results.” See Recent Learning, supra note 6, at 105 (Ken Hendricks).
74
and alternative techniques eliminates GAO’s findings of a relationship between both mergers and price and concentration and price. The FTC also estimated the merger/price and concentration/price relationships using a different form of equation, known as difference-in-difference estimation. As the FTC explained: In models that attempt to determine the effect of changes in concentration or mergers on prices, even the addition of variables, as we have suggested . . . may not adequately control for other factors that affect prices. To alleviate this problem, modern economists often examine how prices change in markets affected by a merger relative to markets unaffected by the merger. This approach is called difference-in-difference estimation. GAO did not use this modern method. The result is that GAO failed adequately to control for many factors that have significant effects on wholesale gasoline prices, and therefore GAO is likely to have attributed to changes in concentration and to mergers price changes that occurred for reasons unrelated to those changes in industry structure.241 Indeed, when the FTC employed the difference-in-difference estimation, all but one positive relationship between a merger and price, or between concentration and price, were eliminated. Thus, the choice of model form dramatically impacted the results. When the form of the model or the choice of variables significantly impacts results – eliminating or drastically reducing any previously identified relationship – one can have no confidence in the results of the original model. Given the myriad methodological flaws, GAO’s analyses provide no empirical basis for its conclusions, and thus can provide no basis for changes in the standards for oil industry merger review. Even if we were to assume that GAO’s flawed conclusions were correct, however, the price effects that GAO claims to have found – usually no more than a few pennies per gallon – could explain only a fraction of the recent increases in gas prices at the pump. One must search elsewhere to explain the size of the price increase and the volatility that characterizes gas price movements. 2.
FTC Merger Retrospectives
Besides carefully reviewing and then rejecting GAO’s analysis, the FTC conducted its own merger retrospectives and inquiry into the factors that affect gasoline prices. For example, the FTC studied the effects of the Marathon Ashland joint venture.242 GAO concluded that the 241
See FTC STAFF ANALYSIS, supra note 223, attached as an Appendix to Kovacic 2004, supra note 210, at 12.
242
Christopher T. Taylor and Daniel S. Hosken, The Economic Effects of the Marathon-Ashland Joint Venture: The Importance of Industry Supply Shocks and Vertical Market Structure (May 7, 2004) (FTC Bureau of Economics Working Paper No. 270).
75
transaction resulted in a significant increase in wholesale price for both conventional and reformulated gasoline. (As discussed above, these findings are seriously undermined by their sensitivity to selection of variables, and choice of equations). The FTC Bureau of Economics found that a positive, significant increase occurred in wholesale prices for reformulated gasoline about fifteen months after the joint venture was consummated. The Bureau concluded, however, that a change in fuel formulation requirements – not the transaction – was responsible for the observed price increase. The Bureau of Economics also found no increase in wholesale prices for conventional gasoline, and no increase in the retail prices of conventional or reformulated gasoline, following the transaction. FTC economists also studied the effects of Marathon Ashland’s acquisition of the Michigan assets of Ultramar Diamond Shamrock.243 Using the difference-in-difference approach discussed above, the FTC, unlike GAO, found no evidence that the acquisition led to higher prices for consumers. Besides the reports and econometric analyses of pricing data described above, the FTC’s price manipulation investigation – an investigation involving scores of lawyers, economists, accounting and financial experts, and more than 100 firms operating in some segment of the petroleum industry – examined whether past merger transactions were undertaken for the purpose of, or had the effect of, manipulating price. According to the Commission: Staff looked for evidence that might have suggested that past consummated transactions contributed to potential price manipulation. [Staff] review[ed] all of the company documents obtained in this investigation to determine if any irregular pricing behavior could be attributed to past mergers or joint ventures. … This review yielded no evidence that past mergers contributed significantly to the potential for price manipulation.244 D.
Creating Industry-Specific Merger Standards Is Poor Public Policy and Unnecessary
Current merger review standards reflect decades of refinement based on antitrust experience and economic learning. As the bipartisan Antitrust Modernization Commission recently concluded, No statutory change is recommended with respect to Section 7 of the Clayton Act. There is a general consensus that, while there may be disagreement over specific merger decisions, and U.S. merger policy would benefit from continued empirical research and examination, 243
John Simpson and Christopher T. Taylor, Michigan Gasoline Pricing and the Marathon-Ashland and Ultramar Diamond Shamrock Transaction (July 2005). 244
GASOLINE PRICE REPORT, supra note 53, at 58 (emphasis added).
76
the basic framework for analyzing mergers followed by the U.S. enforcement agencies and courts is sound.245 Legislation mandating special merger rules for the oil industry likely will encourage copycat proposals. Special interests may mobilize for the purpose of highlighting the “unique” characteristics of other industries that merit a tougher – or more lenient – antitrust approach. An unintended but reasonably foreseeable consequence will place a severe strain on the bipartisan and well-considered approach to merger analysis that the federal antitrust agencies currently employ. The current model has yielded superior results over the past two decades, a time, not coincidentally, of strong economic growth and dynamic transformation of many industries. Moreover, some critics apparently misunderstand the current legal standard. It is wrong to assume, either because of the five percent market definition test or because of the “substantially” language in Section 7 of the Clayton Act, that the antitrust laws tolerate or cannot reach some level of predicted or identified price effect. The antitrust agencies have been clear that even de minimis price increases are not acceptable under current law. Thus, the FTC’s standard threshold when investigating oil mergers considers whether the merger could result in a price increase of 1 penny per gallon. This represents a threshold price-effect percentage of onethird of one percent under current conditions. It is hard to see how the standards can be lower or more precise. Because the current standards allow the antitrust agencies to challenge mergers at a very low threshold of anticompetitive effects, and because they do challenge such mergers, any revised standard likely will require the agencies to challenge competitively neutral or efficiency enhancing mergers. Moreover, the petroleum industry does not possess any special or unique characteristics that require modifications to merger review standards. It is true that gasoline demand is highly inelastic. But inelasticity does not create market power, and, in situations of competitive supply, inelasticity of demand does not allow the exercise of market power. Responses to the various supply disruptions – instances equivalent to attempts to restrain output – illustrate this point dramatically. While increases in the price of gasoline normally follow supply disruptions, prices usually increase only in the short term and decline when supply is brought back on-line or is diverted from other areas. These types of market conditions or characteristics pose no special analytical difficulties for investigations conducted under the Merger Guidelines. Other characteristics of the oil industry that are cited frequently as justifying special treatment under the antitrust laws also exist in many other industries. For example, many commodity industries are characterized by homogeneous products and transparent information. Similarly, specific regulatory requirements, supply and capacity limitations, and entry barriers, while relevant to merger analysis, are not unique to the petroleum industry. Neither are these features dispositive to a finding of anticompetitive effects, nor even necessarily factually correct. Other energy industries, such as power generation and distribution, have to meet onerous regulatory requirements, as do non-energy industries, e.g., the pharmaceutical industry. Other 245
ANTITRUST MODERNIZATION COMMISSION REPORT AND RECOMMENDATIONS, SUBSTANTIVE MERGER LAW, §§ 3, 3a (Apr. 2007).
77
industries likewise suffer from supply and capacity limitations. Moreover, the degree and depth of impediments to entry into the petroleum business are open to question. While de novo construction of a refinery is economically unattractive, as explained in Chapter 1, refinery firms have expanded capacity and improved product yield substantially during the last decade. Significant entry and expansion also has occurred at the retail level. Thus, the existence of these so-called “special” characteristics cannot justify industry-specific antitrust legislation. E.
The Outcome of the Western Refining Case Would Not Have Been Different under Proposals to Shift the Burden of Proof
In FTC v. Foster, the FTC sought a preliminary injunction to enjoin the proposed acquisition of Giant Industries, Inc. (“Giant”) by Western Refining, Inc. (“Western”), alleging that the merger would reduce the bulk supply of gasoline to northern New Mexico.246 Western owns and operates a refinery in El Paso, Texas, and sells a significant portion of its gasoline in El Paso and west Texas. Western also supplies light petroleum products to Albuquerque, New Mexico; Tucson and Phoenix, Arizona; and Juarez, Mexico. Western does not operate any terminals in New Mexico. Giant owns and operates two refineries in New Mexico. Additionally, Giant operates several terminals in New Mexico, including one located in Albuquerque. Because of declining local crude oil production in the Four Corners area, Giant has not been operating its New Mexico refineries at full capacity. To increase its New Mexico refineries’ utilization rates and productivity, Giant acquired an idle crude oil pipeline system in August 2005. Giant anticipates that its new pipeline will become operational in the second quarter of 2007, at which time it will operate its New Mexico refineries at full capacity. The FTC’s primary theory of competitive harm in Foster focused on the anticipated future capacity of Giant’s new pipeline. Specifically, the FTC alleged that in the absence of the merger, Giant would bring an additional 900 bpd to Albuquerque. The FTC hypothesized that this additional capacity would lead to lower prices. Additionally, the FTC alleged that Western would divert this volume away from Albuquerque if the court permitted the merger to proceed. According to the court, however, the facts did not support the FTC’s theory for several reasons. First, the court held that the FTC had seriously underestimated the number of actual or potential competitors in the market. The FTC alleged that the merger would result in a reduction in the number of competitors in the relevant market from seven to six, and alleged that Giant and Western competed with ConocoPhillips, Valero, Holly, Chevron, and Shell in supplying bulk quantities of gasoline to northern New Mexico. The court, however, found that the FTC failed to consider a number of additional actual or potential competitors in the market. Second, the court found that the reduction in output of 900 bpd would not meaningfully affect price. Indeed, the court held that “[t]he amount of gasoline that the FTC alleges would be diverted from Albuquerque is small and would have little or no significant impact on price.” In addition, the court found that “[t]here is ample supply of gasoline available to the northern New 246
No. CIV 07-532 JB/ACT (D. N.M. May 29, 2007).
78
Mexico market” and that other suppliers, including ConocoPhillips, Valero, Holly, and Alon, could easily replace the lost capacity. Moreover, the court observed that prices did not rise when Giant’s crude oil supply was dwindling and its output was declining. Instead, it found that other competitors “responded aggressively as Giant’s crude oil supply dwindled.” Third, the court found that the combined companies’ customers could discipline any unilateral attempt to reduce output. For example, the court noted that “Chevron has substantial buyer-power and leverage with Western, and Chevron receives a favorable price. Because Chevron has substantial flexibility on the sources of its supply to northern New Mexico, Chevron has frequently sought to obtain more favorable terms from Western.” Indeed, the FTC’s expert acknowledged during the hearing that Chevron had alternative sources to whom it could turn for supply. In Foster, had the defendants been required to carry the initial burden of proof to demonstrate that the transaction was not anticompetitive, the outcome of the case would not have changed. The FTC’s loss in Foster clearly was not attributable to its burden of proof. Indeed, the court found that “[t]he FTC has demonstrated sufficiently high market shares and increases in market concentration to trigger the presumption that the Western/Giant merger will likely have anti-competitive effects.” In other words, “the FTC . . . made a prima facie case under the Merger Guidelines,” thus successfully shifting the burden to the defendants. In fact, the defendants successfully rebutted the FTC’s case by showing that there were significant additional actual or potential competitors in the market, that these competitors could easily replace any lost capacity resulting from the merger, and that other market factors would prevent the defendants from unilaterally raising prices. Foster is simply an example of the FTC’s aggressive enforcement in the oil and gas industry; the facts of the case determined the outcome, not the burden of proof. F.
Conclusion
In recent years, the petroleum sector has undergone significant restructuring. A series of petroleum mergers has resulted in economies of scale and scope in research and development, production, distribution, and marketing. Evidence indicates that recent merger activity also has produced significant cost savings, improved resource management, and increased innovation and technology diffusion. These cost savings and technological advances have not come at the expense of consumers. While the FTC examines any conduct in the industry that has the potential to decrease competition, the agency has been especially vigilant in investigating proposed mergers. Indeed, the FTC applies the Horizontal Merger Guidelines standards more strictly to the oil industry than to other industries, and requires divestitures in the petroleum industry at far lower levels of concentration than in other industries. The FTC’s heightened scrutiny of petroleum mergers repeatedly has led to the imposition of divestitures and other conditions. Despite the FTC’s aggressive enforcement in this industry, industry critics rely on seriously flawed empirical analyses, including a 2004 GAO report, to argue that some oil
79
industry mergers have raised prices. They use the findings of this report to assert that Congress should abandon the antitrust agencies’ well-tested approach to merger review in favor of novel and unique standards for oil industry mergers. Their reliance on the GAO report is misplaced, however, as it is fundamentally flawed. Neither does the FTC’s recent loss in the Western case support industry-specific merger review standards, as the outcome would have been the same using the burden-shifting approach in Sen. Kohl’s bill. The Antitrust Section of the American Bar Association has proposed that, before legislating industry-specific antitrust rules for the oil and gas industry, the following burden be met: (1) under the status quo, the risk of anticompetitive harm is so great that additional antitrust rules are needed; and (2) the costs of industry-specific rules would be less than the harms from allowing general antitrust rules alone to continue to regulate competitive conduct in the industry.247 This burden has not been met.
247
Comments of the ABA Section of Antitrust Law Regarding the Oil and Gas Industry Act of 2006, at 7 (May 2006) at http://www.abanet.org/antitrust/at-comments/2006/05-06/comm-antitrus-law-oil-gas.pdf.
80
CHAPTER THREE: SUPPLY SHOCKS AND MARKET RESPONSES Complex market and regulatory factors influence gasoline prices. This Chapter provides an overview of those basic factors as well as an explanation for fluctuations in gasoline prices in response to supply shocks or disruptions. Specifically, Section A provides a framework for understanding the basic supply and demand variables that affect the retail price of gasoline. Using the recent example of Hurricanes Katrina and Rita, Section B explores how the oil industry is well equipped to respond to supply shocks and minimize their impact on gasoline prices. Section C examines the FTC’s lengthy investigation into the industry’s response to those major hurricanes, as well as other FTC investigations into supply shocks and potential pricing anomalies. Section D demonstrates that, based on past experience, price-gouging legislation would produce unintended and undesirable consequences. Section E describes several ways in which the government can facilitate rapid market responses to supply shocks and can otherwise reduce gas prices. Section F discusses the difficulties that would result from enactment of the “No Oil Producing and Exporting Cartels Act of 2007.” Section G contains summary remarks. A.
Numerous Factors Affect Retail Gasoline Prices
Retail gasoline prices reflect complex market and regulatory factors, including supply, demand, competition, taxes, and other government regulations. First and foremost, supply side variables affect producers’ costs to produce and deliver gasoline to consumers at a price they are willing to pay. These costs include key inputs such as “the cost of crude oil to refiners, refinery processing costs, marketing and distribution costs, and finally the retail station costs and taxes.”248 Of these cost components, the price of crude oil has the largest impact on the retail price of gasoline.249 In 2005, “crude oil accounted for approximately 53 percent of the cost of a gallon of regular grade gasoline.” Indeed, the FTC recently noted that “[w]hen gasoline prices rise, the culprit normally is an increase in crude oil prices. Crude oil is the largest input into the refining process and, on a long term basis, accounts for approximately 85 percent of the change in gasoline prices.”250 Other commentators have echoed this sentiment. For example, one recent analysis showed that “changes in crude oil prices explain about 97% of the variation in the pretax price of gasoline between 1918 and 2006. Over that period, a $1 per barrel increase in the crude oil price consistently generated an increase in the gasoline price of about 2.5 cents.”251
248
Unless otherwise indicated, the information contained in this section 3.A is based on: Energy Information Administration (“EIA”), A Primer on Gasoline Prices (May 2006) at http://www.eia.doe.gov/bookshelf/brochures/gasolinepricesprimer/eia1_2005primerM.html 249
GASOLINE PRICE FACTORS REPORT, supra note 30, at 13.
250
FTC Gasoline Column, What is Driving Higher Gas Prices? (June 7, 2007) at http://www.ftc.gov/oilgas/archive/070607.htm (hereinafter “FTC Gasoline Column”). 251
Dahl 2007, supra note 191, at 2.
81
Of course, the Organization of Petroleum Exporting Countries (“OPEC”) plays a major role in determining the price of crude oil by setting upper production limits on its members. Collectively, OPEC countries account for approximately 40 percent of the world’s crude oil production and hold more than two-thirds of the world’s crude oil reserves. Taxes imposed at the state and federal level are another important part of the price consumers pay for gasoline. Government taxes account for the next largest cost component in the retail price of gasoline, accounting for approximately 19 percent of the cost of a gallon of gasoline. Consumer demand also impacts gasoline prices. Especially in the short run, consumers’ demand for gasoline is quite inelastic. In other words, most consumers will not use significantly less gasoline when the price rises. The obvious reason is that, for most people, no widelyavailable close substitutes for gasoline exist. The FTC has stated that this “inability to substitute other products for gasoline in the short run at the retail level results in higher price increases than if consumers could easily reduce their demand when prices rise.”252 Finally, government regulations also affect the retail price of gasoline. For example, the Jones Act requires that any product shipped between U.S. ports be carried in ships built in the United States and staffed by U.S. crews. This Act increases costs to areas that receive petroleum through marine transport because the cost of building and operating a Jones Act vessel is significantly higher than for a comparable foreign-owned and operated vessel. “The observed cost of transportation of refined petroleum products from the Gulf to the West Coast . . . implies that the Jones Act imposes an additional cost of about at least 4 cents per gallon when it is necessary to transport gasoline using Jones Act ships.”253 The Jones Act is not the only example of a government regulation that boosts the price of retail gasoline. Others include government bans on self-service stations and below-cost sales and environmental regulations of the U.S. Environmental Protection Agency and its state counterparts.254 B.
Market Forces Provide the Most Effective Mechanism for Quickly and Efficiently Alleviating Price Spikes
This section illustrates the effectiveness of market forces in responding even to massive supply shocks. Specifically, it explores the impact of Hurricanes Katrina and Rita on crude and refined product supply in the United States and the magnitude and breadth of the steps taken by the oil industry to mitigate that impact. These hurricanes caused unprecedented damage to both the U.S. oil industry and the U.S. economy.255 They severely affected petroleum production and 252
GASOLINE PRICE FACTORS REPORT, supra note 30, at 9.
253
Id. at 81.
254
Id. at 76, 113.
255
See CONG. BUDGET OFFICE, MACROECONOMIC & BUDGETARY EFFECTS OF HURRICANE KATRINA (Sept. 6, 2005) at http://www.cbo.gov/ftpdocs/66xx/doc6627/09-06-ImpactKatrina.pdf (“Katrina’s macroeconomic effects will be greater than those of previous major hurricanes such as Andrew and Hugo, which caused a great deal of devastation 82
distribution, both in the Gulf Coast and throughout the United States, substantially reducing U.S. supply for an extended time period. Firms responded to these extensive disruptions by quickly restoring production and logistics capabilities and by rapidly locating alternative supply sources, including an increased reliance on imports. As a result, even though production of crude oil and refined products was greatly tested, prices returned to pre-hurricane levels within four weeks after Rita. In short, market forces functioned effectively in restoring equilibrium. Part B.1 discusses the disruptions to the supply of U.S. crude oil and products. Part B.2 recounts the industry’s efforts to restore and reopen facilities quickly and safely in the wake of the hurricanes and to locate alternative sources of supply for the impacted areas. Part B.3 demonstrates that the substantial efforts of the industry to mitigate the supply shortfall that resulted in lower prices than would have occurred otherwise. The FTC investigation into the price spikes following the storms, outlined in the next section, validate these conclusions that higher prices, in fact, resulted from competitive market forces, not from illegal action. 1.
Hurricanes Katrina and Rita Had an Unprecedented Impact on U.S. Petroleum Production and Logistics Capacity
Hurricanes Katrina and Rita both struck the Gulf Coast, a critical region for the U.S. oil industry. On August 29, 2005, Katrina made landfall in Louisiana and Mississippi at Category 4 strength. The costliest storm in U.S. history, Katrina flooded 80 percent of New Orleans. Just twenty-six days after Katrina’s devastation, Rita, a Category 3 storm, made landfall at the Louisiana/Texas border. Both storms prompted massive evacuations, caused widespread damage, and affected all levels of the industry – crude oil production, importing, refining, transportation and distribution, and marketing of petroleum products. Crude Oil Production ─ Hurricanes Katrina and Rita halted most of the production of crude oil in the Gulf of Mexico, which serves as an important source of oil both for Gulf Coast and Midwest refineries. Crude oil from the Gulf constitutes roughly 20 percent of the crude oil inputs used by refineries in PADD III (the Gulf Coast) and about 10 percent of the total used in the entire United States. From September 23 through September 29, the reduction in production due to the continuing effects of Katrina and the compounding effects of Rita was equivalent to approximately 100 percent of the Gulf’s normal daily oil production and 10 percent of the normal U.S. daily production. Thus, a substantial reduction in the Gulf had a significant impact, in the short run, on the supply of crude oil available to the United States. Table 3-1 shows the reduction in crude oil production (also called shut-in production, as it was not possible to remove the oil from the wells) as a percentage of daily Gulf of Mexico production and as a percentage of average U.S. daily crude oil usage. On August 30, the day after Hurricane Katrina’s landfall, the 95 percent reduction in Gulf crude oil production was equivalent to 9 percent of crude oil usage at all U.S. refineries. In the next few weeks, facilities were restored and production began to increase, but still remained under 60 percent of Gulf crude but which had a small effect on the macroeconomy. Katrina’s effects will be greater because of the greater devastation, the long term flooding of New Orleans . . . and the destruction of energy and port infrastructure.”).
83
oil usage (under 6 percent of U.S. refinery usage) through September 20, the day before offshore production facilities were forced to close to prepare for Hurricane Rita. For about a week starting on September 23 (the day before Hurricane Rita’s landfall), all of the Gulf production (or about 10 percent of U.S. refinery crude oil usage) was shut-in. By October 19, the shut-in volume dropped to 65 percent of Gulf production; by December 12, the shut-in volume fell to just under 30 percent and was at a similar level as of January 25, 2006. By the end of December 2005, U.S. crude oil production had largely reached pre-hurricane levels.256 Table 3-1 Amount of Oil Production Shut-In Due to Hurricanes Katrina and Rita
Date
Shut-In Production as % of G.O.M. Daily Production
Shut-In Production as % of U.S. Daily Crude Oil Inputs
28-Aug 30-Aug 3-Sep 7-Sep 10-Sep 14-Sep 20-Sep 23-Sep 25-Sep 28-Sep
33% 95% 79% 57% 60% 56% 58% 99% 100% 100%
9% 8% 6% 6% 5% 6% 10% 10% 10%
4-Oct
90%
9%
7-Oct 13-Oct 19-Oct 12-Dec
78% 69% 65% 29%
8% 7% 6% 3%
25-Jan
25%
2%
256
EIA Petroleum Navigator, U.S. Crude Oil Field Production (May 29, 2007) at http://tonto.eia.doe.gov/dnav/pet/hist/mcrfpus1m.htm.
84
In addition, crude oil imports into the U.S. decreased when Hurricane Katrina hit. Imports of crude oil into PADD III fell dramatically between August and September, as many ports that receive imported crude oil closed and many refineries shut down.257 After experiencing a slight increase in mid-September, imports of crude oil fell again when Rita arrived. Imports increased between September and October as facilities were restored. Crude oil imports rose quickly as companies repaired the needed infrastructure. Refining ─ Hurricanes Katrina and Rita also severely impacted U.S. refining capacity and production. Immediately after Hurricane Katrina, 10 Gulf Coast refineries were shut down, accounting for 1.9 million bpd of capacity, or roughly 11 percent of the total U.S. refining capacity and 24 percent of PADD III refining capacity prior to the hurricanes.258 Just prior to Hurricane Rita’s landfall, about 5 percent of total U.S. refining capacity was still shut down in the Gulf Coast as a result of Katrina. On September 25, after Hurricane Rita hit the coast, 20 refineries were reportedly shut down, accounting for 4.9 million bpd of capacity, or about 25 percent of total U.S. refining capacity. Four of these refineries had not yet reopened after Hurricane Katrina. By October 6, 18 percent of total U.S. refining capacity was still shut down, but by October 14 only about 10 percent of total U.S. refining capacity remained shut down.259 Pipelines ─ Under normal circumstances, the Colonial and Plantation pipelines supply much of the Southeast, and provide a significant volume of product to the Northeast. The Colonial pipeline delivers 2.3 million bpd from Gulf Coast refineries to 267 terminals in twelve states throughout the Southeast and Mid-Atlantic, terminating in Northern New Jersey near New York City.260 The Plantation pipeline is connected to 130 shipper terminals in eight states.261 It delivers 620,000 bpd from nine refineries in Mississippi and Louisiana, from other product pipeline systems, and from marine facilities on the Mississippi River.262 For the first time in their history, the Colonial and Plantation pipelines simultaneously shut down for three days beginning on August 29, and ran at reduced rates for about another week, disrupting the flow of finished product from refineries.
257
EIA Petroleum Navigator, Crude Oil Production (May 25, 2007) at http://tonto.eia.doe.gov/dnav/pet/pet_crd_crpdn_adc_mbbl_m.htm. 258
EIA Petroleum Navigator, U.S. Operating Crude Oil Distillation Capacity (May 25, 2007) (average of Jan. 2005 to Aug. 2005 monthly capacity) at http://tonto.eia.doe.gov/dnav/pet/hist/mocggus2m.htm; EIA, Refinery Capacity Data by individual refinery (data for PADD III is based on Atomspheric Crude Distillation Capacity as of January 1, 2005 based on EIA-820 refinery capacity survey). 259
U.S. Operating Crude Oil Distillation Capacity (May 25, 2007) (average of Jan. 2005 to Aug. 2005 monthly capacity) at http://tonto.eia.doe.gov/dnav/pet/hist/mocggus2m.htm.
260
See Colonial Pipeline Company Home Page at http://www.colpipe.com/ab_main.asp.
261
See Plantation Pipeline Company Home Page at http://www.plantation-ppl.com.
262
See Press Release, Plantation Pipeline Co., Plantation Pipeline Resumes Full Service (Sept. 2, 2005) at http://www.lincolntribune.com/modules/news/article.php?storyid=2642.
85
Marine Facilities ─ Oil companies rely heavily on marine transportation to ship light petroleum products. The hurricanes damaged marine loading and unloading facilities, closing them to traffic and creating significant obstacles to crude oil supply and outbound shipments of refined products.263 For example, because of Katrina, the Louisiana Offshore Oil Port (“LOOP”) closed on August 28.264 Offshore and onshore LOOP operations were suspended until power was restored after the storm. More than 10 percent of the nation’s imported crude oil typically enters the U.S. via the LOOP.265 Supply of Refined Product ─ Hurricane Katrina caused a sharp drop between August 26 and September 9 in the weekly production of petroleum products in the United States. After an increase in production during the week ending September 16, there was a further drop the following week as refineries prepared for Hurricane Rita. Net imports of petroleum products increased dramatically beginning in early to mid-September. As production came back online, imports gradually decreased. Because of hurricane-triggered shutdowns and damage, motor gasoline supply reached a low in early September. Total imports of motor gasoline and blendstocks began to increase in early September, declining in November as U.S. infrastructure gradually was restored and domestic production steadily increased.266 By December 2005, domestic production had returned to levels comparable to production during December 2004.267 Terminals ─ The hurricanes damaged terminals throughout the Gulf Coast. In many areas, even if there was no damage to the terminal, power was unavailable and thus product could not be pumped into trucks. Consumer Demand ─ As supply decreased, the demand for gasoline in the short term increased dramatically in anticipation of, during, and following Hurricanes Katrina and Rita. Consumers and distributors were concerned about the widespread impact of the hurricanes and the potential for shortages resulting from reduced supply. As a result, many distributors increased, to the extent possible, their liftings from terminals. Similarly, consumers purchased more product, frequently topping off their tanks.268 This increased demand exacerbated the 263
Much of the Mississippi River also was closed to water traffic for a period of time.
264
EIA, HURRICANE KATRINA’S IMPACT ON THE U.S. OIL AND NATURAL GAS MARKETS (Aug. 30, 2005) at http://tonto.eia.doe.gov/oog/special/eia1_Katrina_083005.html.
265
EIA, HURRICANE KATRINA’S IMPACT ON THE U.S. OIL AND NATURAL GAS MARKETS (Sept. 2, 2005) at http://tonto.eia.doe.gov/oog/special/eia1_Katrina_090205.html.
266
We report total imports rather than net imports because export information is not available by product type on a weekly basis. 267
See U.S. Oil Field Production, supra note 256.
268
Shortly after Hurricane Katrina struck, the President of AAA acknowledged that panic buying was causing shortages. He spoke of “scattered reports of fuel shortages at individual gas stations caused by tight inventories, and by the panic buying of gasoline by some motorists.” AAA, Hurricane Katrina Prompts AAA To Issue Gas-Savings 86
impact of the supply disruptions in the short run. As prices increased in response both to the supply disruptions and to increased demand, consumers gradually reduced purchases.269 This reduction in demand helped alleviate the impact of reduced production. 2.
Firms Reacted Quickly to Alleviate Supply Problems Caused by the Hurricanes
The oil industry responded swiftly to minimize the supply disruptions caused by both hurricanes. The industry’s response included: (1) maximizing gasoline production at operating refineries and promptly returning affected refineries to normal operation; (2) increasing imports into the United States substantially; (3) obtaining product specification waivers to enable greater gasoline production and use of more flexible supply in affected areas; (4) obtaining alternative crude oil sources to maintain production at refineries; and (5) using barges and other forms of transportation to circumvent supply bottlenecks. Maximizing Gasoline Production ─ After the hurricanes, firms maximized gasoline production to minimize gasoline shortfalls and the concomitant effect on consumers following Hurricanes Katrina and Rita. In its report, discussed in the next section, the FTC found that “[r]efineries were able to increase gasoline production due to waivers from the Environmental Protection Agency enabling refiners to produce incremental barrels of gasoline that otherwise would not have been feasible. Refineries that suffered outages in the summer leading up to Katrina also contributed to supply when they resumed operations . . . and one was able to divert capacity normally used for the production of chemicals to the production of gasoline.” The FTC also found that “some refiners that had previously scheduled maintenance for September and October were able to safely defer the maintenance and stay in production.” The FTC ultimately concluded that after Hurricanes Katrina and Rita, “refineries unaffected by the
Guidelines (Sept. 2, 2005) at http://www.aaanewsroom.net/Main/PrinterFriendly.asp?CategoryID=6&ArticleID=383. Panic buying in individual cities and states is described in a number of media articles. See, e.g., WXIA-TV ATLANTA, Perdue Works to Stem Price Gouging (Sept. 2, 2005) at http://www.11alive.com/news/news_article.aspx?storyid=68579; Jon Ostendorff, Katrina Causes Gas Panic in WNC, ASHEVILLE CITIZEN-TIMES (Sept. 1, 2005) at http://www.citizentimes.com/apps/ pbcs.dll/article? AID=/ 20050901/NEWS01/50831024); John Parks, Rita Fuels Panic Over Gas Prices, COLUMBIA MISSOURIAN (Sept. 27, 2005) at http://columbiamissourian.com/news/story.php?ID=16230. 269
Despite short-term demand spikes in some areas, overall demand for gasoline fell between August and September. See EIA Petroleum Navigator, Prime Supplier Sales Volumes (May 22, 2007) at http://tonto.eia.doe.gov/dnav/pet/pet_cons_prim_a_EPM0_P00_Mgalpd_m.htm.
87
hurricanes increased gasoline production and capacity utilization, consistent with behavior in a competitive market.”270 Increasing Imports ─ To offset domestic production shortfalls, light petroleum imports increased substantially following the hurricanes. On September 2, a news report stated that “European tankers received three times more orders than normal from the U.S. this week for gasoline deliveries, trying to make up for the shortage of fuel after Hurricane Katrina.”271 Based on EIA data, net imports of finished petroleum products into the United States were about 75 percent higher in September than in August and about 47 percent higher in October than in September. Compared to the same months during the preceding year, imports were 80 percent higher in September 2005 than September 2004, and 112 percent higher in October 2005 than in the previous October.272 Net imports of gasoline (including blending components) into the United States were about 28 percent higher in September 2005 than in August, and 21 percent higher in October than in September. As another comparison, imports in September 2005 were about 41 percent higher than in September 2004, and imports in October 2005 were about 79 percent higher than in the previous October.273 As a percentage of total prime supplier sales in the United States,274 net imports of gasoline and blending components increased from about 9 percent in August 2005, to about 13 percent in September, rising to approximately 15 percent in October. In Florida, gross imports of motor gasoline were about 86 percent higher in September than in August, and almost 50 percent higher than in September 2004.275 Imports in October were 82 percent higher than in August for Florida. Normally, imports and Gulf Coast product are used to supply Florida. After the hurricane, Florida was supplied increasingly by imports, freeing up Gulf Coast capacity to supply areas that could not receive imported product as easily. As a percentage of prime supplier sales in Florida, imports went from 22 percent in August to
270
All three quotes in this paragraph are from GASOLINE PRICE REPORT, supra note 53, at 75-76.
271
Forbes.com, U.S. Demand For European Gasoline Triples After Hurricane Katrina (Sept. 2, 2005).
272
See EIA Petroleum Navigator, Weekly Supply Estimates (June 20, 2007) at http://tonto.eia.doe.gov/dnav/pet/pet_sum_sndw_dcus_nus_w.htm. 273
Net imports are imports less exports. Imports of motor gasoline including blending components are obtained from EIA Petroleum Navigator, Imports by Area of Entry (Apr. 1, 2007) at http://tonto.eia.doe.gov/dnav/ pet/pet_move_imp_dc_NUS-Z00_mbblpd_m.htm. Associated exports are obtained from EIA Petroleum Navigator, Exports (May 25, 2007) at http://tonto.eia.doe.gov/dnav/pet/pet_move_exp_dc_NUS-Z00_mbblpd_m.htm. 274
EIA defines prime suppliers as firms that produce, import, or transport selected petroleum products across state boundaries and local marketing areas, and sell the product to local distributors, local retailers, or end users at http://www.eia.doe.gov/glossary/glossary_p.htm. 275
Based on EIA data. We use gross imports when analyzing imports into individual states as states that are significant importers are generally not also significant exporters.
88
over 42 percent in September and October. As Table 3-2 reveals, other states also received increased levels of imports.
Table 3-2 Imports into Various States Sept. vs. Aug. 2005
Sept. ’05 vs. Sept. ‘04
Connecticut
83%
No data for Sept. ‘04
Maine
63%
30%
Maryland
92%
280%
New Hampshire
17%
242%
New York
287%
375%
State
Source: EIA, http://www.eia.doe.gov/oil_gas/petroleum/data_publications/company_level_imports/cli.html
Obtaining Waivers ─ After Hurricane Katrina, oil companies requested, and the EPA issued, waivers for Florida, Alabama, and Louisiana to make fuel available that otherwise would have been restricted by Clean Air Act requirements. These waivers later were extended to other states and applied to all marketers supplying product in the relevant states. Many states also have environmental and product quality-related fuel regulations. Following Hurricane Katrina, many states similarly issued waivers, emergency orders, executive orders, and other variances to lift regulatory restrictions, although many states took longer than the EPA. The waivers permitted firms to increase gasoline production. For example, Hurricane Rita hit during the conversion from summer grade to winter grade fuels, a process that normally takes a few weeks. The EPA allowed winter grade fuel to be sold ahead of schedule, increasing the ability of suppliers to sell product in storage at terminals and to produce additional winter grade gasoline, reducing the logistical constraints associated with the changeover. Obtaining Alternative Crude Oil Supplies ─ In its report, the FTC noted that, “[p]ostKatrina, firms arranged for alternative supply sources and means of transportation to areas most keenly affected by the pipeline disruptions at significantly higher transportation costs than pipeline transportation.”276 Although more expensive, these steps increased the available supply.
276
GASOLINE PRICE REPORT, supra note 53, at 73.
89
Barges ─ Some firms also used barges to ship light petroleum products to the areas that had lost normal pipeline supply after Hurricanes Katrina and Rita. As the FTC noted in its report, these firms used “barges on the Mississippi river to move product from the Gulf in lieu of pipeline shipments, despite the increased cost.”277 Although the number of Jones Act vessels generally is sufficient to satisfy demand in the ordinary course of business, the Jones Act initially hindered firms’ ability to secure adequate numbers of vessels. Given the uncertainty regarding whether Jones Act waivers could be obtained, firms did not assume the waivers as a fact in developing their post-hurricane supply strategies. The waivers did occur, but precious time was lost in responding to the hurricanes. 3.
The Industry’s Mitigation Efforts Resulted in Lower Prices than Would Have Occurred Otherwise
Finished motor gasoline production in PADD III decreased in September 2005 by 12.3 percent relative to August 2005, and by 12.1 percent relative to September 2004. Production was still down in October 2005 by 11.5 percent relative to production two months before and by 16.9 percent relative to production in October 2004. PADD III gasoline production represents almost 45 percent of U.S. production. As U.S. production comprises, on average, more than 90 percent of the U.S. gasoline supply, a 12 percent loss in PADD III production, without offsetting increases in supply (from increased production elsewhere, increased imports, or reduced inventories) would result in a 5 percent overall reduction in U.S. supply. Nevertheless, production in the U.S. only fell by 2.9 percent in September 2005, relative to August 2005. Thus, production increases outside of PADD III partially offset the volume loss. Increases in production in other parts of the country reduced the net loss of production by 2-4 percent, and created a similar reduction in the net loss of supply. Increased gasoline production at operating refineries within PADD III also helped to offset the production loss. With increased imports, these efforts substantially offset the supplies lost as a result of the hurricanes. In September, incremental production in PADDs I and II and incremental imports represented 4-5 percent of gasoline supply in the United States, and this does not take into account the efforts to increase gasoline production at operating refineries in PADD III. The increase in supply was even greater in October, as imports increased further. Without these efforts, the supply shortfall would have been greater and lasted longer, causing even higher retail gasoline prices and slower price reductions following the hurricanes. If average prices in the weeks following the hurricane were $2.50 with efforts to mitigate the supply disruption, then prices would have been between $2.80 and $3.15, assuming elasticities of demand equaling -0.2 and -0.4, respectively, in the absence of these efforts.278 A consumer filling 277
Id. at 74.
278
Estimates of the elasticity of demand for gasoline range from –0.1 to –0.4, with a mean estimate of about –0.2. Id. at 66 n. 22. For instance, a 5 percent reduction in supply would result in a 25 percent price increase using a demand elasticity of –0.2 and a 12.5 percent price increase using a demand elasticity of –0.4.
90
up a 15-gallon tank would have had to pay as much as $9.40 more without mitigation of the supply disruption. Moreover, the pricing patterns following the hurricanes show the impact of the industry’s swift efforts to increase volume. Imports began to increase significantly by mid-September (as it takes a few weeks for imports to reach the United States). While prices already were dropping with increased supply from U.S. refineries (as refineries were restored and consequently increased production of gasoline), the increase in imports further decreased prices. In addition, increased imports and expanded gasoline production helped to reduce the impact of the hurricanes outside the Gulf Coast and helped prices fall relatively quickly within the Gulf Coast. C.
The FTC’s Oil and Gas Industry Investigations Repeatedly Have Concluded that Market Forces Cause Price Spikes
Pursuant to a congressional directive, the FTC conducted an extensive inquiry into whether the price of gasoline had been “artificially manipulated by reducing refinery capacity or by any other form of market manipulation or price gouging practices” in the wake of Hurricanes Katrina and Rita.279 1.
The FTC Found that Market Forces Drove Prices Higher Following Hurricanes Katrina and Rita
In response to this congressional mandate, the FTC conducted 65 interviews, issued 139 civil investigative demands, conducted sworn investigational hearings, and purchased and analyzed a large volume of industry pricing data from the Oil Price Information Service.280 After a nine-month investigation, in May 2006, the FTC released its report “Investigation of Gasoline Price Manipulation and Post-Katrina Gasoline Price Increases.”281 The agency found no evidence of market manipulation and, even under the restrictive definition that Congress had provided, only a few isolated instances of price gouging. Indeed, in her testimony before Congress, FTC Chairman Deborah Majoras stated that “[e]vidence gathered during our investigation indicated that the conduct of firms in response to the supply shocks caused by the hurricanes was consistent with competition. After both hurricanes, companies with unaffected assets increased output and diverted supplies to high-priced areas. This is what we would expect in competitive markets.”282
279
Id. at i.
280
Id. at iv-v.
281 282
Id. Majoras Statement 2006, supra note 140, at 15.
91
The FTC found that the average price of gasoline increased approximately 50 cpg in six representative cities in the week after Hurricane Katrina. However, “[a]bout 35 cents per gallon of the post-Katrina price increase dissipated by the time Hurricane Rita hit.”283 In the first week following Hurricane Rita, gasoline prices rose once again in the six selected cities, causing an increase of approximately 25 cpg in the average price of gas. These price increases were again temporary. “Four weeks after Rita, these prices returned to pre-Katrina levels. By the beginning of December 2005, these prices had returned to the levels prevalent at the start of summer 2005, showing that most of the price effects of the hurricanes had dissipated by that time.”284 The FTC found that the large losses in the nation’s crude oil production and refining capacity discussed above caused the price spikes following Hurricanes Katrina and Rita. The FTC concluded that the areas of the country hit hardest by increases in the price of gasoline “were those that normally receive supply from areas affected by the hurricanes.”285 The agency also found that, “in general, the wholesalers and retailers that raised prices the most within particular cities in the weeks following the hurricanes were not firms that experienced increases in market power (stemming, for example, from the closing of rivals). Rather, they were firms that experienced the largest reductions in their own supplies and the greatest increases in their own costs.”286 The FTC also analyzed gasoline price gouging as defined in Section 632 of the Commission’s appropriations legislation for fiscal year 2006,287 which defines price gouging as: [A]ny finding that the average price of gasoline available for sale to the public in September, 2005, or thereafter in a market area located in an area designated as a State or National disaster area because of Hurricane Katrina, or in any other area where pricegouging complaints have been filed because of Hurricane Katrina with a Federal or State consumer protection agency, exceeded the average price of such gasoline in that area for the month of August, 2005, unless the Commission finds substantial evidence that the increase is substantially attributable to additional costs in connection with the production, transportation, delivery, and sale
283
GASOLINE PRICE REPORT, supra note 53, at viii, 61.
284
Id. at viii-ix, 61.
285
Id. at ix, 62.
286
Id. at ix, 98, 105.
287
Science, State, Justice, Commerce, and Related Agencies Appropriations Act, 2006, Pub. L. No. 109-108 § 632, 119 Stat. 2290 (2005).
92
of gasoline in that area or to national or international market trends.288 In applying this standard, the FTC stated that “price gouging occurs when a firm’s monthly average sales price for gasoline in a particular area is higher than for a previous month, and where such higher prices are not substantially attributable to either (1) increased costs, or (2) national or international market trends.”289 In its Section 632 analysis, the FTC analyzed “price, cost, and profit margin data for large sellers of petroleum products -- refiners and wholesalers -- and for retailers that were targets of state price gouging enforcement actions in the aftermath of Katrina.”290 The agency analyzed financial data from 30 refiners and found that “[b]etween August and September 2005, the average gasoline price charged by eight of the 30 refiners analyzed increased five or more cents per gallon more than the national average price trend for this period.”291 Seven of the eight firms also experienced increased profit margins during this period. Because these firms experienced both higher average prices and increases in profit margins during this period, the FTC’s findings for these seven firms met Section 632’s threshold definition of price gouging. The FTC examined additional evidence to supply a more complete analysis of the refiners’ behavior. The Commission found that “refiners that sold relatively more of their gasoline in higher-priced regions had average price increases greater than the increase in the national average.” The FTC also found that “the relative prices for sales through . . . various distribution channels changed significantly in response to changing market conditions.” Ultimately, “[o]nce geographic locations of sales and channels of distribution were taken into account, individual refiners’ price increases appeared comparable to local market trends, except in one case.” The single exception involved a “very small refiner” whose “acquisition cost for the gasoline it was obligated to supply increased significantly beyond the level suggested by the aggregated accounting data because of hurricane damage.”292 In short, market forces, not market manipulation, explained refiners’ behavior. The FTC also analyzed data for 23 large wholesalers with no refinery operations. It found that the operating margins for most wholesalers did not increase. A few of these wholesalers did experience higher operating margins and, coupled with their price increases, met Section 632’s threshold definition of price gouging. Again, the FTC probed further to understand more fully the reasons for these wholesalers’ increased prices and profit margins. The FTC’s analysis revealed that these wholesalers’ “derived these gains from either (1) retail 288
Id.
289
GASOLINE PRICE REPORT, supra note 53, at 137.
290
Id. at ix, 137.
291
Id. at ix, 149.
292
All quotes in this paragraph are from the GASOLINE PRICE REPORT, supra note 53, at x, 149-50.
93
operations in areas that experienced the largest post-Katrina price increase, or (2) activities such as futures market trading of distillate sales.”293 Finally, the FTC analyzed data for 24 individual retailers that had been prosecuted under state price gouging laws. The FTC found that, in general, “these retailers did not have significantly increased operating margins in September 2005, nor were their average price increases much different from the change in the national average retail price from August to September.” Indeed, after “[a]ccounting for regional price differences associated with the hurricanes’ impact,” only one retailer satisfied Section 632’s definition of price gouging.294 2.
The FTC Found No Evidence of Price Gouging or Market Manipulation in Its Midwest Gas Investigation
The FTC also conducted a lengthy investigation into the causes of the gasoline price spikes across the Midwest in the spring and early summer of 2000, and ultimately found no evidence of price gouging or market manipulation on the part of suppliers. The retail price of gasoline spiked higher in parts of the Midwest beginning in May 2000, and peaked in mid-June. Thus, “[w]hereas EPA reported an average urban high price for reformulated gasoline of $1.67 per gallon, the price in Chicago reached $2.13 per gallon and in Milwaukee reached $2.02 per gallon.”295 The FTC’s investigation revealed several explanations for the price spikes in the Midwest. The primary factors included “refinery production problems (e.g., refinery breakdowns and unexpected difficulties in producing the new summer-grade RFG gasoline required for use in Chicago and Milwaukee), pipeline disruptions, and low inventories.” Other factors contributing to the price spikes included “high crude oil prices that contributed to low inventory levels, the unavailability of substitutes for certain environmentally required gasoline formulations, increased demand for gasoline in the Midwest, and ad valorem taxes in certain states.” The Commission also noted that the industry responded quickly to the price spikes. Indeed, “[b]y mid-July 2000, the prices had receded to pre-spike levels.”296 3.
After Investigation of Other Gasoline Price Increases, the FTC Has Concluded That They Are Attributable To Market Forces
In 2002, the FTC began to monitor anomalous movements in gasoline prices and then analyze whether any such movements were attributable to anticompetitive activity. The agency’s economists developed a statistical model for identifying such movements, which they now apply to price movements in 20 wholesale and over 350 retail markets across the country.
293
Id. at x, 154.
294
Id. at x, 152.
295
W. David Montgomery, Potential Effects of Proposed Price Gouging Legislation on the Cost and Severity of Supply Interruptions 15 (Apr. 10, 2007) (hereinafter “Montgomery”). 296
The last three quotes in this paragraph are from Salinger 2007, supra note 18, at 19 n. 37.
94
To date, the FTC has found that “unusual movements in gasoline prices typically have a business-related cause.”297 Below are two examples of price movements analyzed by the FTC. Arizona ─ In August 2003, the price of gasoline in Arizona rose sharply. Arizona receives the bulk of its gasoline from West Coast refineries, and, to a lesser extent, from a pipeline routing gasoline from Texas. The FTC’s investigation revealed that theses price spikes were attributable to “unplanned refinery interruptions in California,” “an unplanned shutdown at a refinery in Washington,” and the rupture, and subsequent shutdown, of Kinder Morgan’s El Paso-to-Phoenix pipeline. In late August 2003, Kinder Morgan “opened a temporary by-pass of the pipeline section affected by the rupture,” causing the average price of gasoline to drop immediately. Gasoline prices continued to decline through September and October 2003. The FTC concluded that “[m]arked price increases in the wake of a sudden, severe drop in supply are a normal market reaction. Because gasoline is so important to consumers, a large price increase may be required to reduce quantity demanded so that it is equal to available supply.”298 Western States ─ The FTC’s price monitoring project has identified other apparent pricing abnormalities that, when further investigated, were fully explained by competitive market forces. For example, the FTC identified a pricing abnormality in the Western United States during February and March 2004. Data indicated that rack prices in California and retail prices in both California and Nevada rose outside the predicted bounds during this period.299 Upon further investigation, the FTC uncovered the causes of these price spikes, including unanticipated refinery outages during a time of relatively low inventory levels. These outages were caused by maintenance delays and a power failure.300 The Commission noted that “[r]estarting a refinery is a lengthy process that can take a week or more, and the loss of output from a refinery outage can be sizeable.”301 With respect to the outages in the Western United States, “three of the California refineries that experienced difficulties in restarting were forced to make unplanned purchases totaling a million barrels of gasoline on the spot market” to meet their contractual supply obligations.302 4.
Market Forces Are Responsible For the 2007 Price Increases
A common theme arising from the FTC’s numerous investigations into price spikes in the oil and gas industry is that market forces are the cause. Most recently, the Commission has examined rising gas prices that began in early February 2007. From early February 2007 297
Id. at 17.
298
The quotes in this paragraph are from Kovacic 2004, supra note 210, at 17-18.
299
Id. at 21.
300
Id. at 21-22.
301
Id. at 23.
302
Id. at 23.
95
through late May 2007, the national average price of gasoline rose from approximately $2.20 per gallon to over $3.22 per gallon. As was the case in previous investigations, the agency’s examination of these recent price increases revealed competitive explanations for their occurrence. According to the FTC, the most recent increase in gasoline prices can be attributed to three factors: (1) refining outages; (2) decreased gasoline imports; and (3) increased demand for gasoline. “These factors led national gasoline inventories to fall from 205 million barrels at the end of March to a low of 193 million barrels on May 4.”303 Regarding the first factor, the FTC noted that “[a] number of refineries have experienced outages in recent months due to fires and equipment failures.” For example, Chevron, Valero, and ExxonMobil all have experienced unforeseen refinery shutdowns in recent months. Domestic shortfalls have been exacerbated by dropping imports, which have fallen by 10 percent since the beginning of 2007, and 8 percent since the beginning of April. Possible reasons for this decline include “major maintenance work at several large European refineries and strong demand from Asia for certain gasoline blending components that can also be used to manufacture chemicals.” While supply in the U.S. continues to tighten, demand has remained strong. The FTC noted that “[g]asoline consumption since the beginning of 2007 has increased 1.8 percent over the last year.” The FTC concluded that, “given the supply situation, as long as U.S. consumers’ demand continues to climb, fluctuations and prices increases are unlikely to end.”304 D.
Price-Gouging Legislation Would Harm, Rather than Benefit, Consumers 1.
Inherent Problems Exist in Attempting to Define Price Gouging
Chief among the many problems associated with the proposed anti-price gouging legislation is how to define the offense. Defining price gouging has always been an open question. “Although widely understood to refer to significant price increases (typically during periods of unusual market conditions), the term ‘price gouging’ . . . is not a well-defined term of art in economics . . . [and] [s]tates that prohibit price gouging have not adopted a common definition or standard to describe the practice.”305 The currently proposed anti-price gouging legislation does not correct this problem. In fact, the proposals “define [price gouging] in terms that are highly subjective and open to interpretation by prosecutors, courts, and legal advisors to businesses.”306 As FTC Chairman Majoras stated: “Ultimately, the lack of consensus on which conduct should be prohibited could yield a federal statute that would leave businesses with little guidance on how to comply and would run counter to consumers’ best interest.”307 Even proposals that refer to prices being set 303 304
FTC Gasoline Column, supra note 250. Id.
305
Majoras Statement 2006, supra note 140, at 3.
306
Montgomery, supra note 295, at 8.
307
Majoras Statement 2006, supra note 140, at 23.
96
by supply and demand “are unclear about criteria that would distinguish between prices set by the market and prices that would constitute gouging.”308 Additional difficulties arise when seeking to establish a baseline by which to judge whether prices are “inappropriately” high. Prices before a local supply disruption occurs no longer reflect the current market, but determining what prices “should” be, and which baseline is appropriate, is a heroic task. Given these uncertainties, “[t]he threat of prosecution for raising prices could reinforce any disruption to the marketplace caused by a supply disruption, and prevent normal market responses from mitigating it.”309 In other words, during supply disruptions such as the ones caused by Hurricanes Katrina and Rita, retailers and distributors might “sell what inventory they had in stock and shutdown rather than take measures to procure emergency supplies at higher prices, because charging enough to cover the cost of replenishing inventories might be interpreted as taking advantage of the situation and making excessive profits.”310 By simply responding to emergency supply disruptions, a firm could find itself the target of a price-gouging prosecution. At the individual retailer level, consider the dilemma faced by the owner of a local gas station. (More than 90 percent of gas stations are independently owned and operated.311) After a supply disruption has temporarily but significantly limited his gasoline supply,312 the owner’s tanks contain a limited amount of gas. New supply will be difficult to obtain, less certain in terms of timing, and considerably more expensive. Additionally, demand for the gasoline will have spiked because many consumers will fill up to hedge against shortages or increasing prices.
308
Montgomery, supra note 295, at 8-9.
309
Id. at 9.
310
Id.
311
Nat’l Ass’n. of Convenience Stores (“NACS”), NACS Gas Price Kit (2007) at http://www.nacsonline.com/NR/rdonlyres/eu4ypiyfkmwbooqtuipha3b3dx5n5qfmf5o3yti4c7efcstxopuuzouoe4vflsbi sovyvdx2zh2bswq7e6myio7hbob/Who+sells+gas.pdf. (In 2006, 167,476 outlets sold gasoline to the public at the retail level, including very low volume outlets such as marinas; while the majority are branded, few are owned and operated by the major oil companies; in 2005, of the 112,000 convenience stores selling gasoline, about 60 percent were one store operations, with less than three percent owned and operated by one of the major integrated oil companies; NACS Hypermarkets Entering Petroleum Marketing (Jan. 2006) at http://www.nacsonline.com/NACS/Resource/PRToolkit/FactSheets/prtk_fact_hypermarket.htm (convenience stores sell approximately three-quarters of the gasoline purchased in the United States); NACS Who Sells Motor Fuel in the U.S. at http://www.nacsonline.com/NACS/Resource/PRToolkit/Campaigns/prtk_gp2007_WhoSellsGas.htm. (According to Convenience Store News, as of August 2006 only 2,718 convenience stores selling gasoline were owned and operated by one of the five major integrated oil companies – or 2.4 percent). 312
Natural disasters, such as Hurricanes Katrina and Rita, as well as unexpected interruptions such as refinery fires or other unplanned outages, may precipitate supply disruptions. Additionally, increased instability in crude oil producing nations such as Nigeria or in the Middle East may further restrict supply in the fact of increasing demand.
97
If the station owner does not raise his prices to respond to his reduced supply and increased re-supply costs, he will face significant losses.313 Additionally, if he does not raise his prices, he may run out of gas before he is able to obtain new supply, which would require closing his station and losing all convenience and sundry item sales that form the largest percentage of his profit.314 By not raising his price for gasoline, the station owner also fails to alert consumers that the real price of gasoline has increased. Not aware that the current retail price does not reflect all costs, consumers may then over-utilize gas, further exacerbating demand pressures. Under the proposed price-gouging legislation, however, the gas station owner is illprepared to determine what would constitute price gouging. If he raises gas prices to reflect his increased cost and the temporary imbalance of demand exceeding supply, he risks a law violation with a fine of up to $2 million and a jail term of up to 10 years. Thus, the proposed price-gouging legislation will place individual gas station owners in the untenable position of having to assume either significant antitrust risk by responding to supply imbalances and raising prices on a temporary basis, or risk suffering substantial business losses by not responding to product shortages. 2.
Prior U.S. Experience Unmistakably Demonstrates That Price Controls Harm Consumers
When demand exceeds supply, prices increase, consequently attracting additional supplies and reducing demand. Following the supply shortfall triggered by Hurricanes Katrina and Rita, higher prices for light products attracted additional supplies from less affected areas of the United States and from overseas. Absent these price signals, the substantial efforts to rebalance supply and demand made by oil companies would not have been as successful or, in some cases, even possible. Moreover, after an initial increase in demand from “panic buying,” consumers faced with higher prices reduced demand for gasoline. If price-gouging legislation were effective, it would prevent prices from rising as high as they otherwise would in response to supply shocks. Thus, effective price-gouging legislation would create the same effects as price controls. Some may speculate that such controls would reduce the impact of future supply disruptions. But history reveals that such measures provide false comfort for consumers. The price controls of the 1970s did little to mitigate supply shortages, instead resulting in long lines, product outages, and rationing. It is inescapable that any attempt to impose price controls, either directly or through price-gouging statutes, will result in unintended and harmful effects for consumers and the economy. 313
NACS Who Sells Motor Fuel in the U.S., supra note 311 (most gasoline stations rely on relatively low margin gasoline sales, averaging about 6.9 percent in 2005 for convenience stores, with other fees and expenses cutting that margin further, to generate sales of higher margin foods, beverages, and other sundry items in their expanded format stores).
314
Id. (in 2005, gasoline and diesel sales accounted for 69.50 percent of the convenience store industry’s total sales, but only about one-third of total store gross margins).
98
A brief overview of the country’s experience with gasoline price controls from the 1970s is illustrative. In 1971, the Nixon Administration imposed price controls on gasoline and other petroleum products. In 1972, the Administration established an allocation program that essentially froze purchaser-supplier relationships. In 1974, with the price controls and allocation rules still in effect, the Arab oil embargo drove up crude oil prices and stressed the market. The price controls and allocation rules prevented the market from responding effectively to the oil embargo. The price controls and allocation rules ultimately resulted in an inefficient allocation of supply; long lines formed in many areas of the country while other areas remained oversupplied with gasoline. In 1979, the onset of the Iran-Iraq war resulted in another oil crises and the long lines at service stations resurfaced.315 William Simon, the administrator of the Nixon program, later wrote: As for the centralized allocation process itself, the kindest thing I can say about it is that is was a disaster. Even with a stack of sensible-sounding plans for evenhanded allocation all over the country, the system kept falling apart, and chunks of the populace suddenly found themselves without gas. . . . . All we were doing with our so-called bureaucratic efficiency was damaging the existing distribution system.316 California also experimented with a form of price control when it ordered Chevron in 1980 to reduce the price of gasoline at the pump as to compensate consumers for alleged overcharges. These price controls resulted in consumers forming long lines for several months at the Chevron stations, where gas was cheaper.317 Deacon & Sonstelie later used data from the Chevron experience to analyze the total welfare effects of price controls by comparing the consumer benefit of lower prices against the costs of rationing by waiting. Based on a survey of consumers, the authors found that “[o]n net, then, a $.25 reduction in the money price actually raises the total cost of gasoline by $.04 per gallon.” For a $.25 reduction in the price of a gallon of gas, “consumers on average gain $.6724 per day because of the lower price, lose $.6574 per day in waiting costs, lose $.0014 per day because of the misallocation of gasoline among themselves, and lose $.1189 per day from the cost of increasing gallons per purchase.”318
315
Montgomery, supra note 295.
316
William E. Simon, A TIME FOR TRUTH (1978).
317
Robert T. Deacon & Jon Sonstelie, The Welfare Costs of Rationing by Waiting, 27 ECON. INQUIRY 179, 188 (1989). 318
Id. at 192-93.
99
3.
Price Controls Generate Harmful Short-Term Effects
Price controls on gasoline have unintended consequences. For example, the fear of running out of gas causes consumers to fill up more frequently and, in turn, creates longer lines at the pump. For example, “[i]f normally drivers fill up their tanks at 1/4 of capacity, but then start to fill up at 3/4 of capacity, the tank will be holding on average 7/8 of its capacity rather than 5/8. As a result, there will be a surge in demand for an amount of fuel equal to 1/4 of the tank capacity of all cars on the road. This shift will produce immediate shortages” and can result in numerous closings by station owners who fear that they cannot pass on the cost of paying for unscheduled replacement deliveries.319 Price controls also waste resources. Indeed, Frech & Lee estimate that the welfare loss of rationing by queuing in California between December 1973 and March 1974 was $1.5 billion in 2005 dollars. See Figure 3-1. They estimate the welfare loss of rationing by queuing in California between May 1979 and July 1979 was nearly $1 billion in 2005 dollars. Overall, the welfare loss from rationing in California over seven months totaled about $2.5 billion in 2005 dollars.320 Further, price controls clearly lead to inefficient and inequitable distributions of supply. “The reason that prices rise after a supply disruption is that without replacement supplies, there is only so much to go around, and replacements are more costly than the supplies that would have been available save the emergency.”321 Unless firms can cover their costs, however, they will not purchase replacement supplies, further harming consumers.
319
Montgomery, supra note 295, at 21.
320
H.E. Frech III & William C. Lee, The Welfare Cost of Rationing-By-Queuing Across Markets: Theory and Estimates from the U.S. Gasoline Crises, 102 Q. J. ECON. 97, 106-07 (1987). We have adjusted the authors’ numbers to reflect inflation. 321
Montgomery, supra note 295, at 21.
100
Figure 3-1 Cumulative Welfare Loss to California Consumers Imposed by Price Controls During a Four-Month Period of the 1973-74 Energy Crisis (Millions of First Half 2005 Dollars) $1,000 $908 $900
Millions of First Half 2005 Dollars
$800 $700 $600 $500 $400
$356
$300 $181
$200 $100
$100
$0 December 1973
January 1974
February 1974
March 1974
Source: Frech III, H. E. and William C. Lee, "The Welfare Cost of Rationing-By-Queuing Across Markets: Theory and Estimates from the U.S. Gasoline Crises," Quarterly Journal of Economics , February 1987.
Price controls also tend to hit consumers in rural areas the hardest. For example, Frech & Lee’s study of the effects of the U.S. gasoline crises of 1973-1974 and 1979 revealed that the government actually “reduced the supply most drastically in the most inelastically demanded market -- that for rural travel.”322 Price controls reduce the incentives for producers to ship product to remote areas. Yet consumers in these remote, sparsely populated areas are often those most in need because, without well-developed public transportation systems, they rely on travel by automobile to obtain basic goods and services. Price controls also have the unintended effect of creating market distortions. For example, the Nixon Administration’s Price Control Board did not oversee the prices of imports. As a result, some firms shipped supplies to Canada and then quickly had them shipped back to the United States for sale. Additionally, “some petroleum manufacturers even built little oil refineries that had no reason for existing other than the fact that gasoline from new factories
322
H.E. Frech III & William C. Lee, supra note 320, at 107.
101
could be sold at a higher price than identical gasoline from older ones.”323 These are just two of the many examples of market distortions created by price controls. Finally, price controls produce inefficiencies that cause prices to be higher than without regulations. For example, price control regulations in the 1970s permitted refiners to increase their ceiling price to recoup increased costs. Consequently, refiners had an incentive to use production methods that allowed the greatest cost recoupment even if those methods were not otherwise the most efficient. Under price controls in which producers have incentives to increase costs and pass them along to consumers, the price of gasoline could well exceed the price consumers would pay in the absence of those controls.324 4.
Price Controls Cause Harmful Effects Over the Long Run
Over the long run, price controls will diminish refiners’ incentive to invest in refining capacity. Producers must receive prices above cost during periods of tightness to earn an adequate return on refining investments. It is the nature of a capital intensive, commodity industry like refining that there will be slack periods where excess capacity drives prices down to variable cost. Cumulative margins earned during slack periods are insufficient to provide normal returns on investment, because those margins rarely contain any recovery of capital at all. Price controls that cut off the upside for margins, even if they are cost based and allow recovery of capital charges as well as operating costs, thereby eliminate the prospect of earning sufficient margins to compensate for periods when there was no return on capital. Refiners have no safety net to avoid losses (relative to margins sufficient to provide a return on capital) during slack periods, and cost-based controls would prevent them from recovering during tight periods. The result of creating an expectation of price controls would therefore be to lower the expected return on refining to levels too low to justify additional investment.325
323
John E. Calfee, Why Pharmaceutical Price Controls are Bad for Patients, AEI ON THE ISSUES (Feb. 8, 1999).
324
Scott Harvey & Calvin T. Roush Jr., PETROLEUM PRODUCT PRICE REGULATIONS: OUTPUT, EFFICIENCY, AND COMPETITIVE EFFECTS, STAFF REPORT OF THE BUREAU OF ECONOMICS TO THE FEDERAL TRADE COMMISSION (Feb. 1981). 325
Montgomery, supra note 295, at 30.
102
A reduction in the investment in refining capacity due to price controls would: (1) increase dependence on foreign imports; (2) reduce capacity to compensate for shortages due to refinery outages; and (3) reduce capacity to respond to regional supply interruptions.326 E.
There Are Constructive Legislative Alternatives that Will Benefit Consumers
The oil industry’s response to the devastating impact of Hurricanes Katrina and Rita is an exemplar of the market’s ability to deal effectively and efficiently with even the most significant supply disruptions. This section describes how the government can facilitate swift market responses in the face of future supply disruptions by removing constraints on the petroleum industry’s ability to respond quickly and effectively. The best options available to the government include reducing the number of boutique fuels, streamlining the processes for waiving both federal and state fuel requirements and Jones Act requirements, and streamlining the refinery permitting process. This section also describes other ways in which the government can assist the industry in lowering the price of gasoline. Specifically, the government should repeal laws that boost the price that consumers pay at the pump, including minimum mark-up laws, divorcement laws, and statutes that prohibit self-service at retail gas stations. 1.
The Federal Antitrust Authorities Should Continue Their Vigorous Enforcement of the Antitrust Laws
As detailed in the Foreword and in Chapter 2, the petroleum industry receives more careful attention from antitrust authorities than does any other industry. Indeed, since 1973, the FTC has conducted well over 100 investigations covering every facet of the petroleum industry. The agency’s vigorous oversight has insured that vibrant competition characterizes every sector of this industry. For example, the FTC recently used its enforcement authority to seek relief in the merger between Chevron and Unocal in 2005, saving California consumers hundreds of millions of dollars annually.327 The Commission challenged Chevron’s acquisition of Unocal, alleging that the proposed merger would allow Chevron, through its enforcement of Unocal’s reformulated gas patents, to obtain sensitive information from its competitors, facilitating coordination in the market for refining and marketing CARB RFG. The FTC required Chevron to forgo enforcement of the Unocal patents, which were the subject of a separate monopolization claim between the FTC and Unocal.328
326
Id.
327
Chevron Corp., FTC File No. 0510125 (July 27, 2005) (consent order) at http://www.ftc.gov/os/caselist/0510125/050802do0510125.pdf.
328
Union Oil Co. of California, FTC File No. 9305 (July 27, 2005) (consent order) at http://www.ftc.gov/os/adjpro/d9305/050802do.pdf.
103
The FTC’s monopolization complaint, issued in 2003, alleged that Unocal had deceived California’s regulatory authorities in connection with proceedings to develop the RFG standards that the authorities ultimately adopted. The complaint charged that Unocal illegally had acquired monopoly power in the technology market for producing the new CARB-compliant summertime RFG, consequently harming competition and consumers in the market for CARB-compliant summertime RFG in California. The Commission estimated that Unocal’s enforcement of its patents could cost consumers over $500 million of additional consumer costs each year, costs that were avoided following the FTC’s imposition of relief in the Chevron/Unocal transaction. 2.
Government Should Consider Repealing Laws that Harm Consumers by Raising the Cost of Gas at the Pump
Several states, and the District of Columbia, have laws that seek to “protect” consumers from alleged anticompetitive practices in the oil and gas industry, higher gasoline prices, or heath and safety hazards. Despite best intentions, these laws increase retail gasoline prices. Such anticonsumer laws include: (1) Minimum pricing laws, which prohibit retailers from setting gasoline prices below-cost; (2) Divorcement laws, which prohibit efficient vertical integration in the gasoline production and distribution supply chain; and (3) Full-service laws, which impose full-service costs on all consumers by prohibiting them from pumping their own gas. Minimum Pricing Laws ─ Numerous states have either enacted or proposed legislation that prohibits retailers from selling gasoline below cost. Some of these laws permit state and private parties to seek injunctive relief as well as damages. The FTC has argued that such laws are unnecessarily redundant because state and federal antitrust laws already make predatory pricing unlawful. Additionally, predatory pricing is not anticompetitive unless a firm can recoup its costs through higher prices in the future. Indeed, “[w]hen a firm is unable to recoup its shortrun losses later through supracompetitive pricing, consumers enjoy a windfall. And without harm to consumers, an antitrust violation does not occur.”329 Furthermore, the U.S. Supreme Court has observed that “there is a consensus among commentators that predatory pricing schemes are rarely tried, and even more rarely successful.”330 In other words, firms accused of predatory pricing are, in reality, almost always engaged in intense lawful competition, which results in lower prices to consumers. Anticompetitive below-cost sales are especially unlikely in gasoline retailing. For example, in the 1980s, the U.S. Department of Energy (USDOE) conducted an investigation into allegations “that major oil companies were selling gasoline below cost to drive independent stations out of business.”331 The USDOE examined extensive pricing data and internal company 329
See, e.g., Letter from FTC Staff to The Honorable Les Donovan, Assistant Majority Leader, Kansas Senate (Mar. 12, 2004) (hereinafter “FTC Letter to Les Donovan”) at http://www.ftc.gov/be/v040009.pdf (citing USDOE, DEREGULATED GASOLINE MARKETING: CONSEQUENCES FOR COMPETITION, COMPETITORS, AND CONSUMERS (Mar. 1984)). 330
Matsushita Elec. Indus. Co. v. Zenith Radio Corp., 475 U.S. 574, 589 (1986).
331
FTC Letter to Les Donovan, supra note 329. Dr. James B. Delaney & Dr. Robert N. Fenill, U.S. DEP’T OF ENERGY, FINAL REPORT: THE STATE OF COMPETITION IN GASOLINE MARKETING (Jan. 1981). 104
documents, finding no evidence of predation. To the contrary, the USDOE concluded that the decline in independent stations was caused by “decreased consumer demand for gasoline in some areas and a continuing trend toward the use of more efficient, higher-volume retail outlets.”332 Rather than protect consumers, minimum pricing laws often have the opposite effect. As the FTC has observed, “the possibility of mistakenly being found liable” under such laws “likely would deter vendors from cutting prices” and would “lead marketers and retailers to compete less vigorously, thus having the effect of protecting marketers and retailers of motor fuel from competition.”333 Ultimately, minimum pricing laws “may lead to higher prices for consumers [by] discouraging pro-competitive price cutting.”334 Divorcement Laws ─ A number of states and the District of Columbia have enacted legislation that prohibits producers or suppliers from owning retail service stations. For example, the District of Columbia Retail Service Station Act prohibits a “jobber, producer, refiner, or manufacturer of motor fuels” from operating a retail service station.335 These laws increase the retail cost of gasoline. As the FTC has noted, “when both suppliers and station operators have the ability to price above cost, each will add a mark-up to the final price.”336 Additionally, nonvertically integrated service stations often incur higher operation costs, which they pass on to consumers via higher prices.337 Indeed, a comprehensive study of state divorcement laws revealed that such laws “tend to increase retail gasoline prices by an average of 2.6 cents per gallon.”338 The study found that repealing these laws, which then existed in six states and the District of Columbia, would lead to an increase in annual consumer welfare of approximately $112 million.339 Based on this and other empirical evidence, “[l]limiting the ability of suppliers to operate service stations when it is efficient to do so is likely to lead to higher retail prices.”340
332 333 334 335
Id. FTC Letter to Les Donovan, supra note 329. Id. D.C. Stat. § 36-302.02(a).
336
Letter from FTC Staff to District of Columbia Councilmember Mary M. Cheh (June 8, 2007) at http://www.ftc.gov/os/2007/06/V070011divorcement.pdf. 337
Id.
338
Michael G. Vita, Regulatory Restrictions on Vertical Integration and Control: The Competitive Impact of Gasoline Divorcement Policies, 18 J. REG. ECON. 217 (2000).
339
Id. at 230.
340
Letter from FTC Staff to District of Columbia Councilmember Mary M. Cheh, supra note 336.
105
Full-Service Laws ─ Two states, Oregon and New Jersey, prohibit self-service gasoline sales. The stated purpose of these laws is to protect the health and safety of consumers.341 Yet, “[b]y banning self-service, th[ese] state law[s] essentially require[] consumers to buy gasoline bundled with services that are likely to increase costs ─ that is, having staff available to pump the gasoline.”342 The result is that full-service laws also have the effect of increasing the price of gasoline. One study found that full-service laws “imposed costs on large and diffuse groups of consumers, while providing only minor benefits to narrow interest groups, such as small service station owners.”343 Self-service bans are estimated to cost consumers between $0.02 and $0.05 per gallon.344 3.
Reducing the Number of Boutique Fuels Would Benefit Consumers
Federal and state regulations require at least 17 different fuel types across the United States. Imbalances in the supply and demand for a particular boutique gasoline can cause supply shortages and short-term price increases because supply from other regions with different fuel specifications cannot be used. In a 2001 study, the EPA itself noted that the many different fuel programs that existed throughout the country could, “in times of gasoline production or distribution disruptions, lead to potential supply problems and short-term price spikes.”345 The Detroit metropolitan area’s experience in 2000 provides a useful illustration. A breakdown of the Wolverine pipeline from Chicago reduced supply to Detroit. In response, prices rose.346 The immediately adjacent Toledo refineries did not produce Detroit specification gasoline, and thus could not alleviate the shortage.347 To reduce the volatility of gasoline prices and to facilitate the response to supply disruptions, the number of gasoline specifications should be reduced significantly. Such a reduction would increase supply flexibility and product homogeneity across geographic areas. With fewer state gasoline specifications, gasoline suppliers would have more flexibility to tap additional sources of supply when “normal” supply is disrupted. Both price increases resulting 341
For example, Oregon’s statue claims that “dispensing of [gasoline] by dispensers properly trained in appropriate safety procedures reduces fire hazards.” OREGON REV. STAT., ch. 480, § 480.315.
342 343 344
GASOLINE PRICE FACTORS REPORT, supra note 30, at 113. Id. Id.
345
ENVIRONMENTAL PROTECTION AGENCY, STUDY OF UNIQUE GASOLINE FUEL BLENDS (“BOUTIQUE FUELS”), EFFECTS ON FUEL SUPPLY AND DISTRIBUTION AND POTENTIAL IMPROVEMENTS (Oct. 2001). 346
FED. TRADE COMM’N, FINAL REPORT OF THE FEDERAL TRADE COMMISSION: MIDWEST GASOLINE PRICE INVESTIGATION n. 49 (Mar. 29, 2001) at http://www.ftc.gov/os/2001/03/mwgasrpt.htm. 347
Id. Because the Toledo area had different summer RVP standards than Detroit, the type of gasoline usually produced at Toledo refineries could not be sold in Detroit. ENVIRONMENTAL PROTECTION AGENCY, GUIDE ON FEDERAL AND STATE SUMMER RVP STANDARDS FOR CONVENTIONAL GASOLINE ONLY at http://www.epa.gov/otaq/regs/fuels/420b05011.pdf.
106
from supply disruptions and the likelihood of gasoline station supply outages could be reduced. The establishment of a standard slate or menu of fuel types from which states may choose, instead of allowing them to create unique fuel specifications, would avoid further boutique fuel proliferation and the associated logistical supply concerns.348 4.
Expediting the Waiver Process During Supply Disruptions Would Quicken the Response of Industry Participants
In the aftermath of Hurricanes Katrina and Rita, the petroleum industry moved quickly and decisively to implement alternative supply strategies for the impacted areas. While ensuring regulatory constraints were met, the industry quickly reconfigured the supply network to transfer refined products to areas in short supply. The predominant direction of product flow was even reversed in some instances, which required utilizing barges, tankers, and trucks for shipments not normally made. The existence of numerous motor gasoline specifications hampered the companies’ ability to remedy the supply problems. In some cases, there were ample stocks of motor gasoline at terminals in or near an affected area that could not be used because these stocks did not meet the unique specification required. For example, terminals in or near areas that required a unique summer grade gasoline may have had ample stocks of conventional gasoline, but limited stocks of the unique summer grade. The Energy Policy Act of 2005 (EPACT05), passed in August 2005, provided EPA with new authority to waive fuel specifications temporarily during supply emergencies.349 Oil companies secured waivers from the EPA and the affected states beginning on August 31, 2005; additional waivers were obtained throughout September in response to Hurricane Rita. These waivers allowed firms to supply conventional motor gasoline or a generic RFG instead of an area-specific RFG. The waivers also allowed refineries to switch more quickly to winter grade gasoline, allowing more gasoline to be produced from a barrel of crude oil. Making the waiver process more transparent and predictable would help companies in their response planning for supply disruptions. In addition, the experience following the 2005 hurricanes illustrates that the EPA should be able to waive both federal and state fuel specifications. Following Katrina and Rita, the EPA promptly waived certain federal fuel requirements to increase fuel supplies. However, in many cases state action also was required because some states have their own fuel requirements in State Implementation Plans and because some states have adopted their own product quality 348
The recent Energy Policy Act reduced the proliferation of boutique fuels by prohibiting the EPA from approving new state fuel controls, unless the EPA can show that such a prohibition will not cause fuel supply or distribution interruptions or have a significant adverse impact on fuel productibility in the affected area or contiguous areas. Energy Policy Act of 2005, Pub. L. No. 109-058 § 1509 119 Stat. 594 (2005). The provision should deter further proliferation of boutique fuels, but it will not reduce the number and types of unique fuel requirements that currently can constrain the fuel distribution system. 349
Id.
107
regulations or ASTM specifications. Frequently, the states were not prompt in enacting their own waivers, which resulted in unnecessary delays in increasing fuel supplies. Allowing the EPA to waive both federal and state environmental and product quality-related fuel requirements should avoid this problem. Another change to EPACT05 would also help in emergency supply disruptions. The 20 day limit for waivers provided in EPACT05 is adequate for most supply disruptions but was inadequate during Hurricanes Katrina and Rita. Thus, the timeframe for waivers should be increased to “up to 90 days” for an event of “national significance” so designated by the President. This increased time will provide much-needed flexibility to arrange additional fuel supplies, particularly given the longer lead time necessary to increase product imports. Another hindrance to rapid response following the hurricanes was the Jones Act, which requires that cargoes shipped between U.S. ports be transported onboard U.S. flagged vessels that are built in the United States, and owned and operated by U.S. citizens. The stringent requirements of this statute increase the cost to build and operate vessels that ship within the United States.350 Because Jones Act vessels are not cost-effective for non-U.S. shipments, they are built solely to meet the limited U.S. demand for such shipments. Given an aging fleet of vessels and the high capital cost to replace them (due to Jones Act requirements), most existing tonnage is tied up in longer-term contracts; little excess capacity exists. Thus, while the number of Jones Act vessels generally is sufficient to satisfy demand in the ordinary course of business, existing capacity is not capable of handling significant and sustained increases in demand. Consequently, it can be difficult to find available capacity during disruptions. Given the uncertainty regarding whether Jones Act waivers could be obtained, the industry could not assume the waivers as a fact in developing their post-hurricane supply strategies. The ability to increase vessel movements quickly can be critical in transporting products to affected areas during a supply disruption. If the industry knew that waivers could be obtained promptly in a given circumstance, oil companies could respond more quickly and effectively. Therefore, the Jones Act waiver process should be reviewed to establish transparent and clearly articulated standards for permitting exemptions.351 5.
Streamlining the Refining Permitting Process Would Enhance Incentives to Expand Capacity
From 1994 through 2004, U.S. refiners expanded the capacity of their U.S. refineries substantially, while maintaining very high capacity utilization. As noted in Chapter 1.B, because expanding existing refineries is much more cost-effective than building a new grassroots refinery, future additions to U.S. refining capacity will likely occur through such expansions.
350
See GASOLINE PRICE FACTORS REPORT, supra note 30, at 81.
351
Id. at I-28 (“The current process for obtaining a waiver of the Jones Act should be evaluated and clarified so that definitive rules are in place should this need occur.”).
108
F.
NOPEC Presents Enforcement Difficulties and Will Result in Harmful Unintended Consequences
On May 22, 2007, the U.S. House of Representatives passed the “No Oil Producing and Exporting Cartels Act of 2007” (“NOPEC”).352 On June 19, 2007, the Senate passed a companion NOPEC bill with precisely the same requirements.353 If the President signs this legislation into law, NOPEC would amend the Sherman Antitrust Act to make it illegal for any foreign state to limit production or distribution of oil and gas or petroleum products, fix prices, or otherwise restrain trade in those products. These bills reinforce this prohibition by declaring that foreign sovereigns are not immune from such claims and that the act of state doctrine does not apply to any such action. The bills grant exclusive authority to the Attorney General to enforce its provisions; they do not provide a private right of action. Put simply, the bills would allow the U.S. Attorney General to bring an antitrust lawsuit in U.S. court against OPEC and its member countries for fixing the price of oil. 1.
Sovereign Immunity and Act of State Doctrine Raise Foreign Policy Issues
NOPEC attempts to eliminate the sovereign immunity and act of state doctrine that have led courts to conclude that OPEC is immune from antitrust liability in U.S. courts. The sovereign immunity doctrine holds that all sovereigns are equal and that the courts of one nation have no jurisdiction to entertain suits against another nation.354 The doctrine was codified by Congress in the Foreign Sovereign Immunities Act (“FSIA”) of 1976.355 While the FSIA contains an exception for conduct “based on a commercial activity,” courts applying that statute to antitrust claims against OPEC have held that the production of oil is not a “commercial activity,” but rather an action by a sovereign to establish the “terms and conditions for the removal of a prime natural resource.”356 NOPEC eliminates this ambiguity between “commercial” and “sovereign” activity by removing sovereign immunity entirely for claims brought under its provisions. The act of state doctrine prevents courts from adjudicating claims that would require them to decide “politically sensitive disputes” involving the legitimacy of official acts taken by foreign governments in a governmental capacity.357 The doctrine deems a judicial remedy 352
H.R. 2264, 110th Cong. (2007).
353
S. 879, 110th Cong. (2007).
354
See Int’l Ass’n of Machinists (IAM) v. OPEC, 477 F. Supp. 553 (C.D. Cal. 1979), aff’d, 649 F.2d 1354 (9th Cir. 1981), cert. denied, 454 U.S. 1163 (1982).
355
28 U.S.C. § 1330 et seq.
356
IAM, 477 F. Supp at 567; see also RIOS v. Marshall, 530 F. Supp. 351, 372 (S.D.N.Y. 1981) (“temporary removal of manpower resources” is not a commercial activity under the FSIA).
357
IAM, 649 F.2d at 1358.
109
inappropriate both for reasons of international comity and because separation of powers principles dictate that decisions impacting foreign affairs are more properly left to the political branches of government.358 NOPEC renders the act of state doctrine inapplicable to any action brought under its provisions. 2.
Antitrust Suits Aimed at OPEC Raise Practical Enforcement Challenges
Antitrust suits attacking OPEC present serious problems from both a practical and policy perspective. From a practical standpoint, a U.S. suit against foreign sovereigns raises a host of logistical and enforcement issues. As the Clinton FTC stated: “A possible enforcement action [against OPEC] raises practical questions as to whether jurisdiction can be obtained over OPEC and its member nations, how a factual investigation could be conducted with respect to documents and witnesses located outside the United States, and the nature and enforceability of any remedy.”359 Indeed, effective international antitrust enforcement is often made possible only through cooperative efforts between the United States and foreign jurisdictions. For example, under the Clinton Administration, the U.S. Department of Justice coordinated with the Canadian Bureau of Competition Policy to prosecute an international cartel in the fax paper market and a conspiracy in the market for plastic dinnerware. The Assistant Attorney General for the Antirust Division noted that “[w]ithout the cooperation and mutual assistance of the Canadian Bureau of Competition Policy and other agencies of the Canadian government, the Department would not have been able to prosecute these illegal conspiracies effectively, because key evidence of the conspiracy was located in Canada and beyond the reach of our investigative capabilities.”360 Because cooperation from OPEC member states is unlikely, an antitrust investigation into OPEC activities could prove time-consuming, costly, and ultimately futile. Litigation against OPEC also raises serious policy issues. Under the Clinton Administration, the FTC noted that “perhaps most importantly, any enforcement action would raise significant diplomatic considerations. A decision to bring an antitrust case against OPEC would involve not only, and perhaps not even primarily, competition policy, but also defense policy, energy policy, foreign policy, and natural resource issues. In particular, any action taken to weaken a sovereign nation’s defenses against judicial oversight of competition lawsuits, for example, would have profound implications for the United States, which places buying and 358
The Supreme Court described the act of state doctrine as “a consequence of domestic separation of powers, reflecting ‘the strong sense of the Judicial Branch that its engagement in the task of passing on the validity of foreign acts of state may hinder’ the conduct of foreign affairs.” W.S. Kirkpatrick & Co. v. Envtl. Tectonics Corp., 493 U.S. 400, 404 (1990) (quoting Banco Nacional de Cuba v. Sabbatino, 376 U.S. 398, 423 (1964)). 359
Solutions to Competitive Problems in the Oil Industry Before the H. Comm. on the Judiciary (Mar. 29, 2000) (presented by Richard G. Parker, Dir. Bureau of Competition) (hereinafter “Parker Statement”) at http://www.ftc.gov/os/2000/03/opectestimony.htm. 360
International Antitrust: A Report From the Department of Justice before Fordham Corporate Law Institute (Oct. 27, 1994) (address by Anne K. Bingaman, Assistant Att’y Gen., Antitrust Division, DOJ) at http://www.justice.gov/atr/public/speeches/0117.htm.
110
selling restrictions on myriad of products.”361 Indeed, some view OPEC solely as a diplomacy issue rather than an issue for enforcement agencies and courts. In her testimony before the Antitrust Modernization Committee, FTC Chairman Deborah Majoras stated: “I am just going to tell you flat out, I do not see OPEC as a law enforcement issue. It is an issue of foreign policy; there is no question. If we believe that we are going to solve our energy problems and be able to do anything about high prices of gasoline in this country by suing OPEC, I submit that we are looking in the wrong direction.”362 This sentiment was echoed recently by the Office of Management and Budget (“OMB”): “The Administration supports a market-based international energy trade and investment system. However, the Administration believes that the appropriate means for achieving that objective lies in diplomatic efforts by the United States with the countries involved in that trade, rather than lawsuits against those countries in U.S. courts.”363 The OMB went on to note the unintended consequences that NOPEC would produce: “[NOPEC] would result in a targeting of foreign direct investment in the United States as a source of damage awards and would likely spur retaliatory action against American interests in those countries and lead to a reduction in oil available to U.S. refiners.”364 G.
Conclusion
A variety of factors influence gasoline prices, including supply, demand, competition, taxes, and government regulations. The FTC has investigated numerous price spikes and repeatedly has concluded that market and regulatory factors, rather than anticompetitive business conduct, drive gasoline price trends. High gasoline prices affect families and businesses and put a strain on budgets. Nevertheless, temporary, higher prices are better than the alternative—gas lines or no gasoline at all. Chairman Majoras, in her testimony to Congress on November 9, 2005, aptly described the harmful effects of price controls: Regardless of how repugnant price gouging is, a law that prohibits it is a form of price control, which might seem attractive . . . in the short run, but is likely to harm consumers more in the long run . . . We should not ignore what we know. In the 1970s, price controls that were established to deal with the energy crunch resulted in massive shortages and endless lines at the pump . . . The choice during times of emergency—high price gasoline or no gasoline at 361
Parker Statement, supra note 359.
362
Public Hearing Before the Antitrust Modernization Comm. 80 (Mar. 21, 2006) at http://www.amc.gov/commission_hearings/pdf/060321_FTC_DoJ_Transcript_reform.pdf. 363
Executive Office of the President, Office of Management and Budget, Statement of Administration Policy: H.R. 2264 -- No Oil Producing and Exporting Cartels Act of 2007 (May 22, 2007) at http://www.whitehouse.gov/omb/legislative/sap/110-1/hr2264sap-h.pdf. 364
Id.
111
all—is not a good one, but unfortunately, it’s a choice that must be made.365 Gasoline prices that reflect the current relationship between world oil demand and supply are the fastest and best way to reestablish equilibrium following supply disruptions. Market pricing ensures that producers will increase supply and consumers ultimately will consume at optimal levels. While price-gouging legislation would impede rapid market responses and delay the restoration of equilibrium, there are ways in which the government can facilitate swift market responses. We encourage Congress and the states to pursue these options.
365
Majoras Statement 2006, supra note 140.
112