A 50-year follow-up of the incidence of multiple sclerosis in Hordaland County, Norway N. Grytten, Cand.polit.; S.B. Glad, MD; J.H. Aarseth, PhD; H. Nyland, MD, PhD; R. Midgard, MD, PhD; and K.-M. Myhr, MD, PhD
Abstract—Objective: To assess longitudinal follow-up of the incidence of multiple sclerosis (MS) through five decades and estimate the prevalence rate in Hordaland County, Norway, on January 1, 2003. Methods: All patients with MS diagnosed from 1953 to 2003 were identified in the patient records of the Department of Neurology, Haukeland University Hospital, Bergen, Norway. The diagnostic criteria of Poser et al. were applied and only patients with definite and probable MS were included. The study comprises 912 patients, and 666 patients with MS were living in Hordaland on January 1, 2003. The annual incidence rates for the years 1953 to 2003 were calculated. Results: The total crude prevalence rate on January 1, 2003, was 150.8 per 100,000 population: 191.3 per 100,000 among women and 109.8 per 100,000 among men. The annual incidence of MS increased from 1.8 per 100,000 in 1953 to 1957 to 6.0 per 100,000 in 1993 to 1997. Conclusions: Hordaland County, Norway, has changed from a low-risk to a high-risk area for multiple sclerosis (MS) during the last 50 years. During the last 25 years, the incidence of MS has been stable rather than increasing. Systematic longitudinal follow-up studies are essential to calculate reliable prevalence and incidence rates in MS. The results suggest that both methodologic and environmental factors are essential in determining the distribution of MS. NEUROLOGY 2006;66:182–186
Few epidemiologic studies have focused on long-term follow-up of multiple sclerosis (MS) prevalence and incidence. Only three studies report substantial observations of 30 years or more: a 95-year follow-up from Olmsted County, MN, USA,1 a 50-year follow-up in Denmark,2 and a 30-year survey from Padova, Italy.3 Long-term continuous registration of MS is essential to provide reliable estimates of incidence and prevalence. MS is unevenly distributed in Norway. Early studies reported that MS was rare in the western and northern parts and more common in the eastern and central parts.4-6 Several subsequent reports at different times confirm this uneven distribution of MS. Reports of increasing prevalence rates, however, establish Norway as a moderate- to high-risk area, with prevalence rates ranging from 73.0 to 163.3 per 100,000 population (figure 1).7-12 In Hordaland County in western Norway, previous studies reported incidence rates increasing from 0.2 per 100,000 in 1935 to 19484 to 0.67 per 100,000 in 1951 to 19655 and 4.7 per 100,000 in 1978 to 1982.13 The prevalence of MS increased from 20 per 100,000 in 196014 to 60 per 100,000 in 1983.15 We sought to assess the trends in MS incidence and prevalence in Hordaland County over a period of
five decades, based on the continuous registration of MS from 1953 to 2003. Methods. Hordaland County is geographically located in Western Norway, between latitudes 59°30= and 61°N (figure 1). The county has a long coastline and numerous fjords and inland areas with mountains and valleys. The climate is humid temperate, and the mean annual temperature is ⫹7.7 °C, ranging from average 2.6 °C in December to 14.5 °C in July. The main occupations are industry, commerce and services, agriculture, and fisheries. The total area is 16,634 km2. The population in Hordaland was 317,384 on January 1, 1953, and 441,660 on January 1, 2003. The main city is Bergen, but almost half the population lives in small villages and rural areas. The coastline is sparsely populated compared with inland. The migration rate ranges from 3.5 to 10.1% (in the city of Bergen, which attracts students and people employed in services and commerce). Since 1973, the migration rate has been stable, ranging from 3.6 to 4.9%. Case ascertainment. Patients were identified from the patient records of the Department of Neurology at Haukeland University Hospital in Bergen. The department opened in 1953 and is the only department of neurology in the county, being responsible for the regional neurologic health care service. Neurologists in private practice work in close collaboration with the hospital, and all patients diagnosed with MS are referred to the hospital for MRI and spinal fluid analysis. Data files from previous epidemiologic studies in the county were also available.13,15-17 In addition, we also evaluated all the patient records of patients with optic neuritis at the Department of Ophthalmology. Statistics Norway and the National Population Registry provided information on the patients’ place of residence on the prevalence day and on the time of onset.
From the National Multiple Sclerosis Competence Centre (N.G., S.B.G., K.-M.M.) and National Multiple Sclerosis Registry (J.H.A., R.M.), Department of Neurology (H.H.), Haukeland University Hospital, and Institute of Clinical Medicine (N.G., H.N., K.-M.M.), Department of Neurology, Haukeland University Hospital, University of Bergen, Bergen, Norway. Supported by the Kjell Alme’s Legacy, the Norwegian Multiple Sclerosis Society, and the Bergen and Hordaland Multiple Sclerosis Society. Disclosure: The authors report no conflicts of interest. Received August 3, 2005. Accepted in final form October 7, 2005. Address correspondence and reprint requests to N. Grytten, National Multiple Sclerosis Competence Centre, Department of Neurology, Haukeland University Hospital, N-5021 Bergen, Norway; e-mail:
[email protected] 182
Copyright © 2006 by AAN Enterprises, Inc.
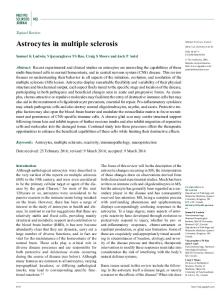
Figure 1. Reported prevalence of multiple sclerosis (MS) in Norway. The counties studied for MS are hatched.
Patients. Medical records from all patients with MS with clinical onset from 1953 to 2003 or living in Hordaland County were obtained and scrutinized for clinical and demographic information. The data included gender, age, place of birth and time (year), and place of residence at onset and diagnosis. Onset of disease was defined as the year of the initial symptom(s). Time of diagnosis was defined as the year a neurologist made the diagnosis. The clinical course at diagnosis was classified as relapsing–remitting or primary progressive.18 The records from previous studies applying the diagnostic criteria of McAlpine19 were reassessed using the diagnostic criteria of Poser et al.20 Cases first diagnosed with MS that later developed another clinical diagnosis were excluded. The Regional Committee for Medical Research Ethics in Western Norway and the Norwegian Data Inspectorate approved the study. Prevalence and incidence. The prevalence rate was defined as the number of MS patients per 100,000 inhabitants living in Hordaland County on January 1, 2003. The calculation included patients with definite and probable MS. We also calculated the age-specific prevalence by gender stratified in age groups. The crude annual incidence rate of MS was defined as the number of new cases with onset of disease per 100,000 inhabitants per year. Only patients with onset when living in Hordaland County during 1953 to 2003 were included in the incidence calculations. Incidence calculations were based on the year of onset of MS. The average annual age-adjusted incidence rate was calculated for 5-year periods from 1953 to 2003 using the European standard population21 as reference. Statistical analysis. We used the t test to determine differences in mean age at onset grouped by diagnostic classification, course of disease, or gender. The incidence rates were calculated based on the number of patients with onset during the year and the county population by January 1 each year. We calculated 95% CIs based on the Poisson distribution for describing the variation in the number of events during a period of time. The trend test for the annual number of patients was based on the assumption that the numbers of cases each year show an independent Poisson distribution. The statistical software packages SPSS 11 (SPSS, Chicago, IL) and StatXact 5 (Cytel Software, Cambridge, MA) were used for the analysis.
Results. A total of 878 patients had onset of MS in Hordaland between 1953 and 2003. Of these, 632 were still alive and living in the county on the prevalence day. In-
cluding 29 patients that had moved into the county and 5 with onset before 1953, a total of 666 patients were living in Hordaland on January 1, 2003. Definite MS was classified in 565 (84.8%) patients, and 101 (15.2%) were classified as probable MS. Relapsing– remitting course was observed in 604 (90.7%), and 62 (9.3%) had primary progressive MS. The proportion of women was 63.8%. Table 1 shows the material by diagnostic classification, disease course, gender distribution, and mean age at onset. Records from 122 patients initially classified in previous studies as possible MS according to McAlpine19 were reassessed applying the diagnostic criteria of Poser et al.20 Seventy-three (59%) of the 122 cases were classified as either definite or probable MS. Forty-nine patients were excluded. Twenty-nine of these were classified as having a Table 1 Demographic and clinical data on the prevalence day, January 1, 2003 n
%
Mean age at onset, y
p
Definite MS
565
84.8
32.0
0.19
Probable MS
101
15.2
33.4
Remitting–relapsing MS
604
90.7
31.4
Primary progressive MS
62
9.3
40.4
Women
425
63.8
32.2
Men
241
36.2
32.2
Diagnostic classification
Course of disease at onset ⬍0.001
Gender
Total
666
0.99
32.2
MS ⫽ multiple sclerosis. January (2 of 2) 2006
NEUROLOGY 66
183
Table 2 Time delay from onset of disease until diagnosis in 5-year periods from 1953 to 2003 Year of onset
Mean, y
Median, y
Range, y
1953–1957
9.8
7.0
0–35
1958–1962
9.9
5.0
1–38
1963–1967
6.8
5.5
0–27
1968–1972
6.9
4.0
0–33
1973–1977
7.0
4.5
0–27
1978–1982
4.9
3.0
0–21
1983–1987
3.3
2.0
0–16
1988–1992
2.5
1.0
0–13
1993–1997
1.9
1.0
0–7
1998–2002
0.9
0.5
0–4
monophasic disease without evidence of dissemination at the time of follow-up, and 20 cases were classified as non-MS. The average time interval from the onset of the disease to diagnosis declined from 9.8 years (mean) in 1953 to 1957 to 1.9 years in 1993 to 1997 (table 2). Prevalence. The crude prevalence rate was 150.8 per 100,000 population (95% CI: 139.6 to 162.7) on January 1, 2003: 191.3 per 100,000 (95% CI: 173.5 to 210.3) among women and 109.8 per 100,000 (95% CI: 96.4 to 124.6) among men. The ratio between women and men in the prevalence cohort was 1.7. The female excess in MS was most prevalent in the age group 40 to 49 years (figure 2). Incidence. The incidence rate increased (p ⬍ 0.0001) from 1953 to 1998 for both men and women (table 3). The age-adjusted annual incidence rate measured in 5-year intervals increased from 1.8 per 100,000 in 1953 to 1957 to 6.0 in 1993 to 1997, peaking at 6.9 per 100,000 in 1978 to 1982. The increase in incidence among women in 1978 to 1982 was the main contributor to this peak. The ratio between women and men in the incidence cohort was 1.3 to 1.9 the whole period, except for 1978 to 1982, peaking at 2.4.
Figure 2. Age-specific prevalence rates of multiple sclerosis in Hordaland County by gender on January 1, 2003. Horizontal axis: “age (years); vertical axis: prevalence of multiple sclerosis per 100,000 population. 184
NEUROLOGY 66
January (2 of 2) 2006
Discussion. The MS incidence increased significantly in Hordaland County, Norway, during the last 50 years. Previous studies of the same population over the years have shown a gradually increasing incidence from early 1950 to 1982.4-6,13,15-17 After 1982, the annual incidence stabilized at about 6 per 100,000. Similar observations have been reported from Møre and Romsdal9,22 and Nord–Trøndelag Counties.7 In contrast, reports from Vestfold,8 Troms, and Finnmark10 Counties show a fluctuating pattern of incidence. The crude prevalence rate in Hordaland County on January 1, 2003, was 150.8 per 100,000 population. Similar studies from Oslo County (136.0 per 100,000) in southeastern Norway12 and in Nord– Trøndelag County (163.6 per 100,000) in central Norway7 also report an increasing prevalence. Although relatively lower, the prevalence rate (73.0 per 100,000) has also increased in the northernmost counties of Troms and Finnmark.10 Similar high prevalence rates have recently been reported in central Finland (105 per 100,000),23 Denmark (112 per 100,000),2 and northern Sweden (154 per 100,000).24 Thus, more recent and repeated surveys in the Nordic countries frequently seem to document higher prevalence rates, possibly because of a decreasing risk of selection bias caused by better case finding and more accurate diagnostic workup.25 However, the characteristics of MS that may hamper accurate case ascertainment in MS are lack of a specific diagnostic test, relatively low prevalence of the disease, and the time delay of several years between onset and diagnosis. The decreasing incidence rate during 1998 to 2002 (table 3) is related to the use of the year of onset in the analysis; thus, patients diagnosed after this period were not included. Accordingly, the time delay from onset to diagnosis was underestimated (table 2). Crucial for comparing incidence and prevalence at different time points are also population characteristics such as the variation in population size, age structure, survival, and migration patterns. We therefore applied the ageadjusted incidence to counteract possible variation in population characteristics. By adopting identical diagnostic classifications for the total Hordaland sample, we made the data comparable throughout the whole observation period. This methodologic approach and the long-term follow-up probably explain the modification of previous reported fluctuations in incidence.13 An obvious methodologic disadvantage of using retrospective data is the problem of subjective recall of the time of onset. Thus, the incidence figures based on the year of onset method may be biased due to migration between onset and diagnosis. However, the calculation methods only marginally influence the prevalence figures, as all recorded MS cases are included. The year of diagnosis procedure used in several studies,12,23 in addition to being less biologically applicable, could also present biased incidence estimates due to changes in diagnostic procedures.
Table 3 Number of cases and crude and age-adjusted annual incidence rates per 100,000 population for MS with onset from 1953 to 2002 in 5-year periods by gender Women
Men
Total
Average population
Cases
Incidence (95% CI)
Cases
Incidence (95% CI)
Cases
Incidence (95% CI)
Age-adjusted incidence
1953–1957
323,613
16
1.9 (1.1–3.2)
12
1.5 (0.8–2.6)
28
1.7 (1.2–2.5)
1.8
1958–1962
338,687
26
3.0 (2.0–4.4)
17
2.0 (1.2–3.3)
43
2.5 (1.8–3.4)
2.7
1963–1967
353,836
30
3.3 (2.3–4.8)
19
2.2 (1.3–3.4)
49
2.8 (2.1–3.7)
3.1
1968–1972
368,469
45
4.8 (3.5–6.4)
35
3.9 (2.7–5.4)
80
4.3 (3.3–5.4)
4.9
1973–1977
384,433
66
6.8 (5.3–8.6)
33
3.5 (2.4–4.9)
99
5.2 (4.2–6.3)
5.6
1978–1982
390,791
93
9.4 (7.6–11.6)
38
3.9 (2.8–5.4)
131
6.7 (5.6–8.0)
6.9
1983–1987
398,056
71
7.1 (5.5–8.9)
55
5.9 (4.5–7.6)
126
6.3 (5.3–7.5)
6.6
1988–1992
409,438
83
8.0 (6.4–10.0)
47
4.6 (3.4–6.2)
130
6.4 (5.3–7.5)
6.2
1993–1997
422,283
79
7.4 (5.9–9.3)
48
4.6 (3.4–6.1)
127
6.0 (5.0–7.2)
6.0
1998–2002
435,167
36
3.3 (2.3–4.6)
29
2.7 (1.8–3.9)
65
3.0 (2.3–3.8)
3.0
Years
p ⬍ 0.0001 for increasing trend from 1953 to 1998. MS ⫽ multiple sclerosis.
The year-of-onset approach is most frequently used, however, and hence most suited for comparing results. The time interval from onset to diagnosis gradually declined throughout the study period. This phenomenon has been observed in several studies in Norway,7-9,11,12,15 suggesting that general health care and neurologic services for the population improved gradually over the years. However, the patients with onset of disease toward the end of the observation period necessarily have a shorter interval between onset and diagnosis. Diagnostic awareness in the public health service system should be considered when evaluating the prevalence and incidence figures. Earlier diagnosis and changes in diagnostic criteria may contribute to increased incidence and prevalence rates.26 The proportion of people with only minor symptoms and signs diagnosed with MS may be increasing due to the increased awareness of MS and the availability and easier access to MRI and CSF analysis. Health care was relatively equitably distributed during the whole period, and residents of Norway are universally covered by the welfare system, thus having equal financial access to diagnostic procedures and health care, giving this study validity. The introduction of disease-modifying drugs during the last decade has led to an even higher diagnostic awareness focusing on early treatment. We could not trace the rapid increase in incidence corresponding to improved diagnosis due to MRI as observed in central Finland,23 probably because of our year-of-onset approach. The elevated diagnostic awareness might explain the stable increase in incidence but is insufficient to determine the gender-specific MS increase and the temporal variability of the disease. A marked increase in incidence similar to that observed in Hordaland in 1978 to 1982 has previ-
ously been reported in western Norway, in Møre and Romsdal County in 1975 to 1979,9,22 and in Nord– Trøndelag County in 1984 to 1988.7 In these three studies, the incidence peak is mainly due to gender variation. The peak in female incidence during 1978 to 1982 in our study was nonsignificant (overlapping CI; table 3) and could be a result of natural fluctuations. However, different trends between the sexes have recently been observed in Finland.27 This observed temporal similarity in incidence by gender in three different counties in Norway points also to possible exogenous factors such as infections, as a contributor to the marked increase. Our results support the hypothesis of interactions between genetic background and environmental factors as a possible cause of MS. An upward trend in incidence followed by a stable rate of MS during the 1970s was also reported in Olmsted County, MN, a population with a great proportion of people of Fennoscandinavian ancestry.1 Our data confirm this finding, showing a stable incidence during the last 25 years. This stability indicates the likelihood of a genetically susceptible population exposed to exogenous factors that remain stable over time. Thus, given a stable population at risk both in genetic susceptibility and in exogenous factors, the stable incidence during the last 25 years could be explained by a ceiling effect; that is, diagnostics methods and case ascertainment are near optimal. This hypothesis is compatible with expectations of no further increase in incidence. We cannot rule out a possible influence by any exogenous factors, although this is less likely. Such an influence could have contributed to the increased incidence until the 1970s. Any changes in exogenous factors at that time point leading to reduced risk of MS could contribute to further stabilization of the incidence. Thus, we should then expect a decline in January (2 of 2) 2006
NEUROLOGY 66
185
incidence, an observation not substantiated in our study. A recent research report has challenged the hypothesis of an association between common childhood infections such as measles, varicella, rubella, mumps, and pertussis and an increased risk of MS.28 However, recent research suggests that immunization with recombinant hepatitis B is associated with an increased risk of MS.29 Our data may indicate that exogenous factors vary over time and may affect men and women differently. The hypothesis of dispersion of MS over the last 50 years in Sweden has also taken into account the complex causation of MS as the interplay of genetic predisposition and exogenous factors.30 Further analytical studies need to trace the hypotheses of infections, nutrition, and lifestyle factors on an individual level, as suggested in this article. Acknowledgment The authors thank Prof. Jan-Petter Larsen and Dr. Marit Grønning for data collection and Grete M. Forland for secretarial assistance.
References 1. Mayr WT, Pittock SJ, McClelland RL, Jorgensen NW, Noseworthy JH, Rodrigues M. Incidence and prevalence of multiple sclerosis in Olmsted County, Minnesota, 1985–2000. Neurology 2003;61:1373–1377. 2. Koch-Henriksen NJ. The Danish Multiple Sclerosis Registry: a 50-year follow up. Multiple Sclerosis 1999;5:293–296. 3. Ranzato F, Perini P, Tzintzeva E, et al. Increasing frequency of multiple sclerosis in Padova, Italy: a 30 year epidemiological survey. Multiple Sclerosis 2003;9:387–392. 4. Swank RL, Lerstad O, Strøm A, Backer J. Multiple sclerosis in rural Norway. Its geographical and occupational incidence in relation to nutrition. N Engl J Med 1952;246:721–728. 5. Westlund K. Distribution and mortality trend of multiple sclerosis and some other diseases in Norway. Acta Neurol Scand 1970;46:455–483. 6. Westlund K. Recent statistical data on multiple sclerosis and some other diseases in Norway. Nordic Council Arctic Med Res Rep 1982;32: 19–29. 7. Dahl OP, Aarseth JH, Myhr K-M, Nyland H, Midgard R. Multiple sclerosis in Nord–Trøndelag County, Norway: a prevalence and incidence study. Acta Neurol Scand 2004;109:378–384. 8. Edland A, Nyland H, Riise T, Larsen JP. Epidemiology of multiple sclerosis in the county of Vestfold, eastern Norway: incidence and prevalence calculations. Acta Neurol Scand 1996;93:104–109. 9. Midgard R, Riise T, Nyland H. Epidemiologic trends in multiple sclerosis in Møre and Romsdal, Norway: a prevalence/incidence study in a stable population. Neurology 1991;41:887–892.
186 NEUROLOGY 66
January (2 of 2) 2006
10. Grønlie SA, Myrvoll E, Hansen G, Grønning M, Mellgren SI. Multiple sclerosis in north Norway and first appearance in an indigenous population. J Neurol 2000;47:129–133. 11. Alstadhaug KB, Olavsen J, Salvesen R. Forekomst av multippel sklerose i Nordland 1970 –99 [Incidence and prevalence of multiple sclerosis in Nordland County, Norway, 1970 –1999] Tidsskr Nor Laegeforen 2005;125:431–433. 12. Celius EG, Vandvik B. Multiple sclerosis in Oslo, Norway: prevalence on 1 January 1995 and incidence over a 25-year period. Eur J Neurol 2001;8:463–469. 13. Grønning M, Riise T, Kva˚le G, Nyland H, Larsen JP, Aarli JA. Incidence of multiple sclerosis in Hordaland, western Norway: a fluctuating pattern. Neuroepidemiology 1991;10:53–61. 14. Presthus J. Report on the multiple sclerosis investigations in westNorway. Acta Neurol Scand 1960;35(suppl 147):88–92. 15. Larsen JP, Aarli JA, Nyland H, Riise T. Western Norway, a high-risk area for multiple sclerosis: a prevalence/incidence study in the county of Hordaland. Neurology 1984;34:1202–1207. 16. Larsen JP, Kva˚le G, Riise T, Nyland H, Aarli JA. An increase in the incidence of multiple sclerosis in western Norway. Acta Neurol Scand 1984;70:96–103. 17. Larsen JP, Riise T, Nyland H, Kva˚le G, Aarli JA. Clustering of multiple sclerosis in the county of Hordaland, western Norway. Acta Neurol Scand 1985;71:390–395. 18. Lublin FD, Reingold SC. Defining the clinical course of multiple sclerosis: results of an international survey. Neurology 1996;46:907–911. 19. McAlpine D. The benign form of multiple sclerosis: a study based on 241 cases seen within three years of onset and followed up until the tenth year or more of the disease. Brain 1961;84:186–203. 20. Poser CM, Paty DW, Scheinberg L. New diagnostic criteria for multiple sclerosis: guidelines for research protocols. Ann Neurol 1983;14:227– 231. 21. Waterhouse J, Muir C, Correa P, Powell J. Cancer incidence in five continents. IARC Sci Pub 1976;3(15). 22. Midgard R, Riise T, Svanes C, Kvale G, Nyland H. Incidence of multiple sclerosis in More and Romsdal, Norway from 1950 to 1991. An ageperiod-cohort analysis. Brain 1996; 119:203–211. 23. Sarasoja T, Wikstro¨m J, Paltamaa J, Hakama M, Sumelathi M-L. Occurrence of multiple sclerosis in central Finland: a regional and temporal comparison during 30 years. Acta Neurol Scand 2004;110:331–336. 24. Sundstro¨m P, Nystrom L, Forsgren L. Incidence (1988 –97) and prevalence (1997) of multiple sclerosis in Va¨sterbotten County in northern Sweden. J Neurol Neurosurg Psychiatry 2003;74:29–32. 25. Sadovnick AD, Ebers GC. Epidemiology of multiple sclerosis: a critical overview. Can J Neurol Sci 1993;20:17–29. 26. Marrie RA, Cutter G, Tyry T, Hadjimichael O, Vollmer T. Changes in the ascertainment of multiple sclerosis. Neurology 2005;64(suppl 1): P05.105. 27. Sumelathi M-L, Tienari PJ, Wikstro¨m J, Palo J, Hakama M. Increasing prevalence of multiple sclerosis in Finland. Acta Neurol Scand 2001; 103:153–158. 28. Bager P, Nielsen NM, Birham K, et al. Childhood infections and risk of multiple sclerosis. Brain 2004;127:2491–2497. 29. Herna`n MA, Jick S, Olek MJ, Jick H. Recombinant hepatitis B vaccine and the risk of multiple sclerosis. A prospective study. Neurology 2004; 63:838–842. 30. Landtblom A-M, Riise T, Kutzke JF. Further considerations on the distribution of multiple sclerosis in Sweden. Acta Neurol Scand 2005; 111:238–246.