European Consortium for Mathematics in Industry
28th ECMI Modelling Week Final Report
19.07.2015—26.07.2015 Lisboa, Portugal
Chapter 8
Parking Lot Simulation Anastasiia Shcherbak Faculty of Applied Mathematics, National Technical University of Ukraine, Kiev, Ukraine Anna Broms Department of Mathematics, Faculty of Engineering, Lund University, Lund Sweden Emilia Pompe Faculty of Mathematics, Informatics and Mechanics, University of Warsaw, Warsaw, Poland Roni Angelov Sofia University , Sofia, Bulgaria Se-Wook Oh Mathematical Institute, University of Oxford, Oxford, UK Sebastian Springer Department of Mathematics, Faculty of Science and Technology, University of Milano, Milano, Italy
Instructor: Matylda Jablonska-Sabuka Department of Computational Engineering and Physics, Lappeenranta University of Technology, Finland
2
Abstract A rectangular shaped parking lot located outside an office is simulated in Matlab, R and python. We investigate parking time with respect to time of the day, geometry and size of the parking lot, greediness levels of the drivers and the preference map of the parking lot, using two different models. In parallel, an analytical approach is made, using Game theory. It is found that greediness is the factor that affects the parking time the most. Future work includes simulations with multiple cars searching for a parking place simultaneously and investigations of different shapes of parking lot. It can be concluded that it is not worth to be greedy!
2
Parking lot simulations
8.1
Introduction
Imagine entering the parking lot located outside your office. Are you one of those people who wants to park your car as close to the entrance of the office as possible? Have you ever asked yourself a question what affects the time it takes for you to find an empty parking place? In this project the main question is how much time it takes to park at a parking lot depending on characteristics of both the parking lot and the drivers entering the parking lot. The characteristic of a driver include driving rule (how a driver drives within the parking lot) and greediness (i.e., a measure of the driver’s eagerness to park in a specific parking space), and the characteristics of parking lot include (1) geometry of the parking lot and (2) preference map (map indicating the different levels of parking preference of drivers), (3) parking lot dimension or size of the parking lot, and (4) the number of entrances to the market/office. In this project five research questions are of interest: 1. How does the level of greediness affect the parking time? 2. How does the dimension or size of the parking lot affect the parking time? 3. How does the parking time change by different time of a day? 4. How does the geometry of the parking lot affect the parking time? 5. How does the different preference map of parking lot affect the parking time? We tackle above questions numerically using Matlab, R and python. The simulations in Matlab and R are based on the same model, hereafter named Model 1, whereas the simulations in Python are based on a second model, Model 2. In section 8.5, we introduce mean-field game which can potentially give an analytical solution. Finally, in the Conclusion and Future Work section, we discuss about future work on these type of parking lot simulations.
8.2
Model Specification
In all investigations in this project, the parking lot is rectangular. The cars can only park from one direction, meaning that each row in the parking lot only has one line of cars. The parking lot is simulated during ten hours, from 8am to 6pm. For each research question described in the introduction, the simulation is repeated 365 times, simulating collection of data from one year.
28th ECMI Modelling Week
3
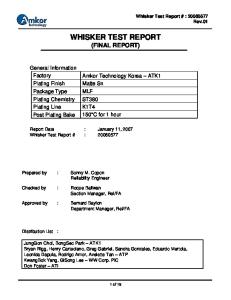
The cars are assumed to arrive to the parking lot according to an exponential distribution. In the models in this project only one car tries to find a free place at the parking lot at the time. The frequency of arriving cars are higher in the morning than later during the day, since we think of the parking lot as located outside an office where most of the employees arrive during the first part of the day. The distribution of the relative frequencies throughout the day is shown in Figure 8.1a. Moreover the intensity of cars is dependent of the size of the parking lot. The frequency of cars is higher for a larger parking lot than for a smaller one. Every car stays at the parking lot a random amount of time, which is chosen from a uniform distribution, starting from the time that the car arrives to the parking lot and ending at 6pm (when the parking lot is closing). Greediness levels are first assumed to be uniformly distributed on the interval [0, 1]. In a second assumption the greediness levels of the drivers are chosen from a shifted beta distribution with a mean of 0.74, as shown as a histogram in Figure 8.1b. The parking time is the relative time it takes
(a) Relative frequencies of arriving cars throughout the day
(b) Shifted beta distribution
Figure 8.1 for a car to find a place to park at (time for driving to this position in the parking lot grid and decision making along the way), not including the time it takes to actually park.
4
Parking lot simulations
(a) Model 1. Office is located at the top of the picture. Black represents an empty and blue an occupied parking lot. The entrance is located in the bottom right corner.
(b) Model 2. Office is located at the bottom of the picture Red represents a car, green an empty parking lot and blue the road on which the cars can go. The entrance is located in the upper left corner.
Figure 8.2: Visualisation of the different simulations based on the the two models.
8.3
Model 1 - Matlab and R
Description
Figure 8.3: The rules of movement of cars in the Model 1
28th ECMI Modelling Week
5
In this section we will describe how the M odel 1 was implemented. The first assumption that we made was that the Office was located at the top of the parking lot and that there were many entrances so that the parking preference was linearly decreasing from the first line down to the bottom line. As one can note from the Figure 8.3 the parking lot entrance is located in the bottom right corner. As described in the Section 8.2 the cars are assumed to arrive to the parking lot according to an exponential distribution. Once the Time of the day corresponds to the next randomly generated Arrival time a new Struct car is created, hereafter named N ew car, with the following attributes 1. P osition row 2. P osition col 3. Greediness : Randomly generated according to the rules explained in the Section 8.2 4. Arrival time : Time of the day when the N ew car is generated 5. F inding time : Time that the N ew car needs to find the parking place where it will park 6. T ime to leave : Time of the day when the N ew car leaves the parking lot, randomly generated between the moment when the N ew car parked, i.e., Arrival time + F inding time and the time when the parking closes 7. M indx : When the N ew car parks add 1 to the Parking lot reference matrix in the position where it parked (P osition row, P osition col), and add 0 to the same position when the N ew car leaves the parking lot. So let us describe the dynamic of the movements. After a car has been created it enters in the bottom right corner and starts to move on the column as shown in the Figure 8.3 until its greediness level is lower or equal to the parking preference of one line. A. When this happens, flip a coin that decides if the car has to try to park on that line or move forward. B. If the car decides to move forward, move to the next line and (a) If it has not yet arrived in the first line, do point A. (b) If it has arrived to the first line, tries to park.
6
Parking lot simulations C. If the car enters in one line, i.e. it tries to park (a) Park in the first free place. When the N ew car has found a parking place, calculate the f inding time and add it to N ew car.f inding time. Generate also randomly a time to leave and add it to N ew car.time to leave. (b) If the line is full (in our Figure 8.3 the car is now situated in the left side of the parking) add that line to the visited lines of the N ew car and move forward, do point A. until the car finds a parking place or it arrives in the first line. D. If a car arrives in the first line, and can not find a free place, it starts to move backward and tries to park into the first line that it has not yet visited. If in that way the N ew car arrives down to the last line it simply leaves the parking lot.
When the Time of the day corresponds to some of the cars.time to leave (in Figure 8.3 displayed as Leave at ## : ##) they leave the parking, i.e., empty that P ositions, putting a 0 in the corresponding position of the Parking lot reference matrix.
Result and Discussion How does the dimension or size of the parking lot affect the parking time? To investigate this question the geometry of the parking lot is kept rectangle horizontal with ratio 1:2. The number of cars increases when the size of the parking lot increases. In this model the greediness levels of drivers are chosen from the beta distribution shown in Figure 8.1b. The parking lot is changed from 10 by 20 dimension to 40 by 80 dimension. In Figure 8.4 there are six different sizes of parking lots. Histograms show that the larger the parking lot the longer the time is needed for the drivers to find a parking place. It is shown that for the small parking lot with dimension 10 by 20 the driver needs only 65 - 72 steps on average for finding a parking place, whereas for the average dimension of parking (25 by 50) the most drivers need 320 - 330 steps to find the place and for the largest parking it takes 720 - 730 steps. How does the time of the day affect the parking time? To answer this question it was assumed that the parking lot has dimension 16 by 16. The greediness levels of the drivers have again the beta distribution described in section Model Specification and the preference map is linear. The time of day was divided by hours from 8 a.m. to 6 p.m. In the histograms in Figure 8.5 it is shown that from 8 a.m. to 9 a.m, shortly after when the parking lot opens, the intensity of cars is high and a lot of parking places are free, resulting in that almost all cars find a parking place quickly. From 10 a.m. to 11 a.m. it is more difficult to find a parking place, as almost all places
28th ECMI Modelling Week
7
Figure 8.4: Visualization of dependence between the average time for finding parking place and the size of the parking lot
Figure 8.5: Visualisation of dependence between the time for finding parking a place and the intensity of cars, depending from times of day
are occupied. In the middle of the day (12 to 13 p.m.) the time for finding a parking place is different due to that some cars are leaving the parking during lunch time and at the same time a lot of cars arrive. At the end of
8
Parking lot simulations
the day it is easier to find a parking place and the driver needs only 50 steps on average. In the last graph in Figure 8.5 it is shown how much time the driver needs on average to find a place at different hours during the day. The graph shows that in the middle of the day the driver needs the longest time for finding a place for his car.
How does the greediness level affect the parking time? To answer this question it was assumed that the dimensions of the parking lot are 10 by 10. In the first approach we compared the average finding time (throughout the whole day between 8 a.m and 6 p.m.) for people with different greediness levels linearly distributed between 0 and 1. As it is shown in the Figure 8.6, people with higher greediness levels need more time to find their parking spot. It is worth noting that we can see a lot of outliers in the plot at each greediness level. This is caused by the fact that several drivers arrived to an almost full parking lot, so it took a lot of time to find a free place. What is more, the average utility of the less greedy drivers– defined as difference between preference level of the place eventually taken and their greediness coefficient – is lower. This indicates that being less greedy is a good strategy – you need less time to find a parking spot and you obtain more utility afterwards.
Figure 8.6: The first plot shows the drivers greediness and finding time. Average finding time for each greediness level is marked with a red line. In the second chart the drivers greediness and utility obtained after finding a place was plotted. In the second approach, we compared distributions of finding times in two cases:
28th ECMI Modelling Week
9
a) all drivers have greediness coefficients equal to 0.2 b) all drivers have greediness coefficients equal to 0.8 Boxplots of these distributions are shown in Figure 8.7. In the case a)
Figure 8.7: Boxplots of the finding time distributions in case when all drivers have greediness equal to 0.2 (red) and when all drivers have greediness equal to 0.8 (blue). First quartiles, medians and third quartiles of the distributions are presented. the average finding time was equal to 32.26 minutes, while in the case b) in was equal to 37.29 minutes. It can be also observed that the variance of distribution obtained in the first case is significantly higher than in the second case as there is a large group of people who find their parking spot very quickly. On the other hand, in the case b) there are very few people able to find a free place in less than 30 minutes (about 25% of the drivers). This happens because according to the procedure described above, if we assume that greediness is equal to 0.8, each car begins to look for a free place in the third, second or first line. This means that each driver starts his search from travelling to one of the first three rows. Furthermore, after first few hours the most desired rows are already occupied. That is why for new drivers entering the parking lot it is pointless to travel to one of the
10
Parking lot simulations
first lines as they are still forced to take their place in a less attractive row. Those drivers lose a huge amount of time trying to find a desired place – if they were less greedy, the algorithm would allow them to find their place in a shorter time (on average). Hence, we can deduce that in this case being less greedy brings benefits for the drivers society.
8.4
Model 2 - Python
As we introduced in the beginning, we would like to tackle two questions: (1) How does the different geometry of the parking lot affect the parking time, and (2) how does the different preference maps affect the parking time? We tackled those questions using slightly different model, which we would like to describe in the following.
Description of model
Figure 8.8: Illustration of a parking lot. Green lines are parking lines, which consist of 19 parking spaces except the foremost line (the green line at the bottom of the figure) which has 21 parking spaces. Parking lines are separated by road (blue). Red square indicates a car. We have rectangular parking lot, of which the size is 20×21. The example is given in Fig. 8.8; parking lines (green line) are separated from each other
28th ECMI Modelling Week
11
by one road (blue line); therefore, the number of the parking lines is ten. Each parking line is consisted of 19 parking spaces, except the frontmost line (the lowest row) which composes of 21 parking spaces. Each parking space has a preference that is decided by preference function, which is dependent on the geometry of the parking lot and the location of the destination (see section 8.4). A driver enters the parking lot from the top-left corner, which is indicated as a red square in Fig. 8.8. The common characteristic with the driver in Model 1 is that a driver will park at a parking space which has preference not smaller than the driver’s greediness. However, the movement rule is very simple compared to Model 1; a driver keeps driving forward until it arrives at intersection. Once at intersection, the driver randomly choose any direction except the direction which leads the driver to its location at the previous time step. Therefore, a driver does not go backward in any case, but it is possible that the driver does not drive toward the front line but toward the rear line. For each experiment, we run the simulation for 10 hours a day (i.e., 36, 000 seconds a day), throughout a year (i.e., 365 days), and any cars left at the end of a day is removed from the parking lot before the beginning of the next day. We calculated the average time to park over all cars that succeeded to park. Cars that did not park in parking lot is thus dismissed in this work. Effect of change of geometry on the time to park Geometry can be changed in various ways. It can be done by changing the shape of the boundary of the parking lot, but also it can be done by adding shortcuts as in Fig. 8.9a. We focussed on the latter, thus we changed the geometry of the parking lot by cutting each parking line which creates a shortcut from one parking line to another parking line.1 By increasing the number of cuts in each parking lines, we investigated how the average time to park (i.e., average time to find a parking space) changes. We added 1, 2, 3, 4, 5 and 8 cuts in each parking line, and investigated how the average time to find a parking space changes. As one can observe from Fig. 8.9b, up to 4 cuts, the time to park gets shorter, which means in a parking lot of size 20 × 21, it gets more efficient for a driver to find a parking space if you increase the number of cuts up to 4. However, the time to park increases after 4 cuts. In a finite parking space, if the number of cuts is below certain level, then it gets more efficient for a driver to move forward and find more satisfactory parking space (i.e., parking space that has higher preference than the driver’s greediness), thus 1 As we have limited size of the parking lot, we cut each parking lines by getting rid of parking spaces as many as the number of cuts. This way, we actually reduce the number of available parking spaces, but it is realistic trade-off between equity and efficiency; either to increase the number of available parking spaces or to increase the mobility of the cars to find a place in parking lot, when the size of parking lot is set constant.
12
Parking lot simulations
(a)
(b)
Figure 8.9: (a) The illustration of the parking lot after adding one cut to the parking lines. (b) The change of parking time by increasing the number of cuts in the parking lines.
shortens the time to find a parking space. However, if there are too many cuts, then the chance gets higher for a driver to move not only forward but also backward, which decreases the possibility for a driver to find the satisfactory parking space, which is near the frontmost line. Therefore, after certain number of cuts, the efficiency decreases and the time to park gets longer. The critical number of cuts that has the smallest time to park depends on the geographic restriction: the critical number of cuts gets larger with increasing the size of parking lot.
Effect of different preference map on time to park Next we investigated how different preference maps have influence on the parking time. We changed preference map by changing the preference function φ that decides the preference of each parking location (x, y) where x is the horizontal distance from the left end, and y is the vertical distance from the bottom end. Except for uniform preference function, all preference functions are decreasing function by the vertical distance y from the front row, which is the place where we assume that the destination is located. We tried four different preference functions: uniform preference, linear preference, quadratic preference and radial preference. • Uniform preference (Figure 8.10a): All locations in the parking lot have the same preference as φ(x, y) = 1, therefore drivers would park anywhere. • Linear preference (Figure 8.10b): The preference of parking space
28th ECMI Modelling Week
13
(a)
(b)
(c)
(d)
Figure 8.10: Preference maps with different preference functions. (a) Uniform preference map where all location in the parking lot have the same preference of 1. (b) Linear preference map where the preference decreases linearly, and (c) quadratic preference function where the preference decreases by the order of two. (d) Radial preference map where the preference decreases from the centre of the front row toward any direction. φ(x, y) follows a linearly decreasing function2 φ(x, y) =
y r
where r is the height, which is the number of rows (20 in this case) of the parking lot. • Quadratic preference (Figure 8.10c): The preference function is φ(x, y) =
y2 r
where the preference decreases by the order of two. 2
In all other experiments in this work, we use the linearly decreasing preference function.
14
Parking lot simulations • Radial preference (Figure 8.10d): The preference function is y 1 − x − 2c φ(x, y) = + c r 2 where c is the width (i.e., the number of columns) of the parking lot where the preference decreases linearly from the center of the front row toward all directions3 .
Figure 8.11: Histogram of time to search for a place in a parking lot, by different preference maps. Dashed lines indicate the average time to find a parking space for each preference map: uniform preference (red), linear prefernce (green), quadratic preference (yellow) and radial preference (blue). As one can observe from Fig. 8.11, one can observe that the frequency of the cars which park decreases radically with the increase of time to park, which shows that most of the cars park in relatively short period of time. However, we did not try fitting the data into either exponential curve or power-law curve, thus we do not know what distribution the histogram follows. The average time to park by different preference maps are indicated by 3
It is not exactly radial as the functional form of the radial preference map does not follow radial function, however we named it radial preference map as the preference decreases toward any direction.
28th ECMI Modelling Week
15
different coloured dash lines, and they show that the parking time is smallest when a driver does not care where to park (i.e., when the preference of all parking spaces is one), and it takes the longest time if only one parking space at the centre of the front row gives the highest utility to a driver and less in other spaces further from the centre. Also, drivers take less time to park when the preference decreases linearly than quadratically.
8.5
Analytics
We will present the reader with gentle heuristic introduction to mean field games, omitting technical issues, and try to make some suggestions why the given abstract mathematical framework possibly could happen to be a suitable model for the parking lot or similiar dynamics.Mean field games is a relatively novel mathematical field involving a system of partial differential equations, which are used to discribe the behaviour of multiple agents each individually trying to optimise their position in space and time, while their preferences are being partly determined by the choices of all other agents, in the asymptotic limit when the number of players goes to infinity. For example, each agent in traffic congestion tries to get from point A to point B in the shortest path possible, but the speed (or more generally the velocity vector) at which one can travel depends on the density of the other agents in the area. Under some assumptions, mean field games can be expressed as a coupled system of two equations, a Fokker-Planck type equation evolving forward in time that governs the evolution of the density function m of agents, and a Hamilton-Jacobi-Bellman evolving backward in time that governs the comptutation of the optimal path of each agent. Before considering mean field games, let us consider a more classical problem in calculus of variations, namely that of a single agent trying to optimise his or her path in spacetime with respect to a fixed cost function, which the agent is trying to minimise. Suppose that an agent is at some position x(0) at time t = 0 in some domain, for example Rd , and would like to end up at some better position x(T ) at a later time t = T > 0. When modeling this, we imagine that each location x ∈ Rd has some cost u(T, x) ∈ R at the time T , which is small when x is a desirable position and large otherwise. If the transportation was not a problem, this is a straightforward problem to solve. One simply finds the value of x(T ) that minimises u(x(T )) and then the agent takes an arbitrary path, for example the straight line connecting the points x(0) and x(T ) with constant velocity. But now let us suppose that there exists transportation cost in addition to the cost of the final location. For instance, moving at too fast a velocity or wrong direction could incur an energy cost. To model this, we introduce a velocity cost function C : Rd → R, where C(v)dt measures the marginal
16
Parking lot simulations
cost of moving at a given velocity v for time dt and then define the total cost of a trajectory x : [0, T ] → R by the formula u(x(T ), T ) +
RT 0
C(x0 (t))dt
This is a simplified model, where the cost depends on velocity and not on position and time, but let us work with it in the current discussion. A model example cost function C could be the following quadratic one C(v) = 21 |v|2 . In the given situation, the agent should move in a straight line at a constant velocity to a location x(T ) having low final cost u(x(T )) but which is reasonably close to the initial position x(0). The last observation implies that the global minimum for the final cost is no longer the best place to strive for, as it may be so far away that the the transportation cost exceeds whatever cost savings one can get from the final cost.To avoid some technical issues, we will assume C to be stricly convex and even. A possible way to find the optimal trajectory is to solve the Euler-Lagrange equation associated to the functional given above, with the boundary condition that the initial position x(0) is fixed. Thus, we obtain an ordinary differential equation for x(t), which can be solved by different methods. Another idea is to generalise the initial time 0 to any time t0 between 0 and T . For any given t0 between 0 and T and x0 ∈ Rd define the optimal cost u(t0 , x0 ) at the point (t0 , x0 ) in spacetime to be the infimum of the cost RT u(x(T ), T ) + t0 C(x0 (t))dt over all smooth paths x : [t0 , T ] 7→ Rd starting at x(t0 ) = x0 and with an arbitrary endpoint x(T ). The latter means what the agent would place on being at the point x0 at time t0 regardless of the initial position x(0) when t0 is positive number.By definition,when t0 = T , the optimal cost at x0 is equal to the final cost at x0 , which justifies using the same notation u to denote both. Thus, the final cost u(T, ·) can be viewed as a boundary condition for the optimal cost. It turns out that (under some assumptions and given that t0 is less than T ) the optimal cost function u satisfies a partial differential equation, known as the Hamilton-Jacobi-Bellman equation −∂t u(t0 , x0 ) + H(∇x u(t0 , x0 )) = 0 where H : Rd 7→ R represents the Legendere transform of C : Rd 7→ R,i.e. H(p) := sup v · p − C(v) v∈Rd
Given that C is stricly convex it follows that H is well-defined function. Once we solve this equation, we can work out the optimal velocity v = v(t0 , x0 ) to travel at each point (x0 , t0 ). It can be shown that v = −H 0 (∇x u). Let us
28th ECMI Modelling Week
17
suppose that the agents steering mechanism may be subject to a little bit of random fluctuation, so that if the agent wishes to go from x0 to x0 + vdt in time dt instead ends up at x0 + vdt + σdBt , where dBt is the infinitesimal of a standard Brownian motion in Rd . With this stochastic model, the total cost is now a stochastic quantity rather than a deterministic one, and so the rational thing for the agent to do is to minimise the expectation of the cost. In this case, the Hamilton-Jacobi-Bellman equation takes on the following form −∂t u − 21 σ 2 ∇2 u + H(∇x u) = 0 for the expected optimal cost and the optimal velocity is still equal to −H 0 (∇x u). Now let us suppose that there are a huge number N of agents distributed throught the space and all of them have identical motivations, i.e. they are trying to minimise the same cost function. Rather than dealing with each of the agents separately, we will pass to a continuum limit N → ∞ and consider the normalised density R function m(t, x) of the agents, which is a non-negative function satisfying Rd m(t, x)dx = 1 for each t. Intuitively, the number of agents in an infinitesimal box in space [x, x + dt] should be approximately equal to N m(t, x)|dx|. The Fokker-Planck equation evolving forward in time that governs the evolution of the density function m of the agents is the following one: ∂t m(t, x) + ∇ · (mv)(t, x) = 0. If once again we add random noise to the agents movements the above equation transforms into ∂t m(t, x) − 21 σ 2 ∇2 m(t, x) + ∇ · (mv)(t, x) = 0. To obtain a mean field game model, we should take into account that in the presence of other agents throughout the space the cost function of each one of them should depend on the density function m of all the other agents. There many ways to generalise the single agents model. The simplest one would be an additive model, in which the cost function is replaced with the following one RT RT u(x(T ), T ) + 0 C(x0 (t))dt + 0 F (m(t, x(t)))dt, where F : R+ → R represents the marginal cost to an agent of having a given density at the current location. Intuitively, if F is increasing this means that the agent prefers to be away from the other agents. Conversely, a decreasing F should lead to attractive effect. The Hamilton-Jacobi-Bellman equations can be derived for this cost functional by a similar analysis to before, leading to the equation
18
Parking lot simulations −∂t u − 12 σ 2 ∇2 u + H(∇x u) = F (m).
Given that the optimal velocity field v is still equal to −H 0 (∇x u),the FokkerPlanck equation becomes (after reversing sign) −∂t m + 21 σ 2 ∇2 m + ∇x · (mH 0 (∇x u)) = 0) The system of these two equations, with the final data u(T, x) for u at time T , and initial data m(0, x) for m at time 0, is an example of a mean field game. The backward evolution equation represents the agents decisions based on where they want to be in the future and the forward evolution equation represents where they actually end up, based on their initial distribution. As for the parking lot or similiar dynamics applying or at least trying to apply mean field approximation heavily relies as a first step on choosing appropriate cost functional. It is crucial to come up with explicit cost function, which penalises a drivers movement when not complying with the prescribed parking lot geometry or taking into account the locations of the other drivers.For instance,if an agent enters highly dense area then it is possible to employ by adding it to the cost functional the following integral: R −1 m(t, x)dx. In general, we can think of the cost u(t, x) |x0 −x|