2.4 Cannabis
2.4.1 Production In the 2009 World Drug Report, UNODC presented an inventory of the available data on cannabis production and, based on four different methods, estimated that the cannabis herb production ranged from 13,300-66,100 mt and the cannabis resin production from 2,200-9,900 mt. The resulting total area under cannabis cultivation was estimated at 200,000-641,800 ha.1 These estimates provided the magnitude of the problem related to the illicit cannabis cultivation and production, but they also showed a large range, indicating the great uncertainty around the estimates. In this World Drug Report, the above-mentioned estimates were not updated; given the high level of uncertainty and the remaining lack of information in many cannabis-cultivating countries, a new round of estimations would have offered an arithmetical exercise rather than providing policy-relevant information on the global trend of cannabis production and cultivation. The trend analysis presented here focuses on some new information obtained by UNODC in the last year, with a special focus on indoor cannabis cultivation. Cannabis cultivation and production in Afghanistan In 2009, the major new piece of information on cannabis production relates to an important producer, Afghanistan, where the first joint cannabis survey was
undertaken by UNODC and the Afghan Ministry of Counter Narcotics. The results of this survey gave a range of cultivated cannabis area from 10,000 to 24,000 ha, and a resin production range between 1,500 and 3,500 mt. In terms of production, Afghanistan would be the major producer of cannabis resin in the world. This is principally due to the high resin yields measured in Afghanistan (145 kg/ha), which are four times higher than in Morocco (36 kg/ha measured in 2005), where cannabis resin is also produced. However, it is not clear whether the products are directly comparable. There is evidence of cannabis production in almost all countries in the world. The major source of information regarding production continues to be the responses that Member States provide to the Annual Reports Questionnaire (ARQ). Although about 50 countries have reported in the last 10 years on the actual extent of cannabis cultivation, more countries report seizures of plants and eradication of sites, which give another indication of the presence of cannabis cultivation. Other evidence can also be found through seizure statistics, where countries provide information on where the reported seizure originated. Due to the fragmentation and incompleteness of information, it is difficult to do a proper analysis over time and reveal patterns in cannabis cultivation. However, an increase of indoor cultivation has been reported by several sources and will be analysed more closely. Indoor cultivation
1
The calculation was based on the minimum and maximum levels calculated from reported cultivation and production, seizures of cannabis and user prevalence rates.
Several national studies have indicated an increasing trend of indoor cannabis cultivation instead of, or in
183
World Drug Report 2010
Table 23: Update of available information on the extent of cannabis cultivation and production in major producing countries, 2008* Country
Cultivated area (ha) a)
Afghanistanb)
10,000 – 24,000 (2009)
Eradication
Harvestable area (ha) 10,000 – 24,000 (2009)
Production (mt) Resin Herb 1,500 – 3,500 (2009)
Boliviac)
1,831 1,399-3,498 (2007)
Canadad) Colombiae)
5,000 (2006)
Mexico Moroccog)
4,000 (2006) 18,562 hag)
12,000f )
4,377
60,000
64,377
Netherlandsh)
877
1,053,368 plants
323-766 16,500k)
Paraguay
6,000i)
1,838 haj)
South Africal)
1,300
1,275 ha
United States of America
21,500f )
25
7.6 million outdoor plants / 451 000 indoor plantsm)
3,149-7,349
* Or other year, if mentioned. a) In addition, there is some extraction from wild-grown cannabis, for example, areas of 124,000-329,627 ha were estimated in Kazakhstan (1999 UNDCP, Annual Survey reports Cannabis, Opium Poppy and Ephedra (Vienna, 1998 and 1999). In the Russian Federation, wild cannabis is estimated to be cultivated on 1 million ha (US Department of State, International Narcotics Control Strategy Report (INCSR) 2010). b) UNODC, Afghanistan cannabis survey 2009, Vienna, 2010. c) Government of the Plurinational State of Bolivia, quoted in INCSR, 2010 d) Governments of the United States of America and Canada, Drug Threat Assessment 2007, March 2008. e) UNODC, Bulletin on Narcotics, “Review of the world cannabis situation”, Volume LVIII, Vienna, 2006. f) US Department of State, INCSR, 2010 g) UNODC, ARQ 2008. h) KLPD-IPOL, Drug seizures and drug prices in the Netherlands, Zoetermeer, The Netherlands, 2008. i) Secretaria nacional Antidrogas (SENAD), (Asunción, 2008). j) UNODC ARQ 2008. k) Secretaria nacional Antidrogas (SENAD), (Asunción, 2008). l) UNODC, ARQ 2008. m) DEA, Domestic Cannabis Eradication/Suppression Program (DCE/SP) in National Drug Threat Assessment 2010.
addition to, outdoor growing.2 Indoor growing has the benefit of having lower chances of detection, 3 high yields with several harvests per year4 with high potency cannabis5 and elevated selling prices. The equipment, knowledge and seeds for indoor growing have become very accessible, for example, from so-called ‘grow shops’ 2
European Monitoring Centre for Drugs and Drug Addiction, Monograph series 8, Volume 1, Lisbon, 2008.
3
In Canada, a detection rate of 2-3% is estimated. Bouchard, M., Journal of Quantitative Criminology 23: (3): 221–241, 2007. The controlled conditions often allow for up to six harvests per year. The controlled conditions (often hydroponically grown) normally give higher potency of the product, for example, in the production of sinsemilla. Sinsemilla are the unfertilised buds of the female plants which contain the highest concentration of THC. Controlled conditions include the use of optimal varieties and plants, optimal dosage and timing of providing water, nutrients and light.
4 5
184
or from the internet. The costs of building an indoor growing site can be quickly recovered, which makes indoor cultivation a very lucrative business. Based on government reports and scientific literature, UNODC could find evidence of indoor cultivation for commercial purposes in 29 countries, concentrated in the temperate zones of the world: North America, West, North and Central Europe and Oceania. There was only one report of indoor growing in South America (Argentina) and one in Africa (South Africa). Given the lack of a system to monitor indoor cannabis cultivation worldwide, these 29 countries represent the minimum set of indoor cannabis cultivating countries. With the available data, it is not possible to calculate the extent of indoor growing. Often indirect indicators are used to estimate the trend, such as the number of seized
2. Drug statistics and trends Cannabis
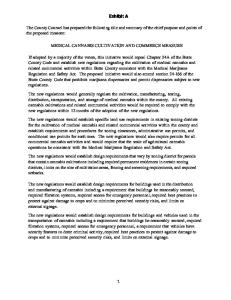
Cannabis resin processing in Afghanistan In 2009, a first cannabis survey was carried out by UNODC and the Afghan Ministry of Counter Narcotics to estimate the extent of cannabis cultivation and production in Afghanistan. The survey covered 20 provinces where cannabis cultivation had been reported. Information was collected from satellite images and interviews with village headmen and farmers in 1,634 villages. The complex area of cannabis resin yield was investigated with focus group interviews in more than 45 villages. The yield study included observation of the actual production of resin, which is a process of threshing and sieving the dried cannabis plants to produce a powdery substance locally called ‘garda’. Garda consists of cannabis resin as well as other plant material. Based on the quantity and quality of the resin, garda is categorized as first, second, third (and sometimes even fourth) grade. At least two farmers are involved in the production of garda. First, they beat the dried cannabis plants on a barrel to separate the buds from the main branches. Then, the dried buds, leaves and seeds are separated, after which the farmers sift the product through a wooden sieve kept in an inclined position. After sieving, they put the product in a bag made of cloth, which is shaken for about five minutes. Most of the dust is filtered out during this process. The sieving takes place three times. The remaining powder is split and put into smaller bags. A small quantity of powder is put in a cloth pouch and beaten by hand to remove the remaining dust. This product is called first garda. Regional differences exist in the processing techniques which give different products and quality levels varying with the amount of resin and plant rests. Generally, the north, north-east and west of the country produce higher quality garda but in smaller amounts, whereas the south and east have a larger production of the first garda but with lower quality. Most farmers sell the garda in its powdery form, but it needs another transformation to produce consumable hashish, which is usually done by traders. Table 24: Potential cannabis resin garda production, 2009 1st garda (mt)
2nd garda (mt)
3rd garda (mt)
4th garda (mt)
Rounded total (mt)
Lower limit
693
471
287
19
1,500
Upper limit
1,648
1,120
683
45
3,500
47%
32%
20%
1%
100%
As % of total garda
Source: UNODC/Afghan Ministry of Counter Narcotics, Afghanistan cannabis survey 2009
plants or the number of seizures of plantations. Since the way of reporting is not consistent between countries, and often not even within one country, it is challenging to compare the production levels.6 For some countries, for example, Australia, New Zealand, the United Kingdom and the Netherlands, indoor growth is known to be the main method of cannabis production. From the Netherlands, indoor cultivation has spread to surrounding countries, for example to
6
Moreover, there is no protocol for the reporting, which makes the numbers hard to compare within countries. The number of plants often do not differentiate for the type of plant, for example, whether the numbers are full grown plants or include seedlings and cuttings. Research in the Netherlands indicate that this can give large divergence in the reports (see: Wouters, Korf and Kroeske, Harde aanpak, hete zomer, WODC, Amsterdam, 2007).
Belgium, where there is an increase of seized indoor plants, to East Europe (the Czech Republic, Poland, Hungary and Slovakia) and Austria, and to northern Europe (Iceland, Finland, Denmark, Norway, Sweden and Latvia). The increases in cultivation are often attributed to Vietnamese organized crime groups.7 In Canada also, Vietnamese/Chinese groups - as well as Hell’s Angels - are involved in cannabis cultivation, including high-tech indoor cannabis growing. The Canadian production is for national consumption, but some is also exported to the United States. In the United States, indoor growing has become significant, but seizures of outdoor-grown plants still exceed the indoor-grown plants. 7
UNODC ARQ 2008; INCSR 2010; Europol, EU Organised crime threat assessment, 2009.
185
World Drug Report 2010
2.4.2 Seizures Trafficking of cannabis derivatives continues to affect most countries worldwide. Of the 147 countries and territories for which UNODC collated records of drug seizures in 2008, 137 had seized at least one of the cannabis derivatives: 129 had made seizures of cannabis herb, 92 of cannabis resin, and 26 of cannabis oil. Based on 2003-2008 data, approximately one half of seizure cases related to all illicit drugs worldwide involved cannabis herb, resin or oil. Cannabis herb was the most frequently seized drug8 in Africa, the Americas and Oceania, while cannabis resin was the most frequently seized drug in Europe, followed by cannabis herb. Cannabis herb Global cannabis herb seizures rose gradually but steadily over the period 2005-2008, reaching 6,587 mt in 2008, slightly exceeding the peak level attained in 2004 (6,539 mt). The Americas continued to be the region with the highest share of global seizures, followed by Africa. Significant increases were registered in South America, Africa, Asia and Europe. Fig. 164: Breakdown of global cannabis herb seizures (mt), 1999-2008 Source: UNODC ARQ/DELTA
From 2001 onwards, the largest and second largest national annual cannabis herb seizures worldwide were reported by Mexico and the United States, respectively. In Mexico, following two consecutive year-on-year increases, cannabis herb seizures fell by almost one quarter, amounting to 1,658 mt in 2008, the lowest level since 2002. In the United States, seizures of cannabis herb remained at the high level (1,447 mt) reached in 2007, at 1,472 mt in 2008. The drop in cannabis herb seizures in Mexico was offset by a significant increase in South America, mainly owing to the contribution of the Plurinational State of Bolivia. Seizures, as reported by the Bolivian Government, more than doubled in 2008, and increased by a further 74% in 2009, continuing a rapidly increasing trend which can be traced back to 1999. Over the period 2003-2009 in particular, cannabis herb seizures in the Plurinational State of Bolivia rose steadily, from 8.5 mt in 2003 to 1,937 mt in 2009. This represented a 228-fold increase over a period of six years, equivalent to six consecutive year-on-year increases of 147%. The level in 2008 was the third highest reported by a single country worldwide, and the level in 2009 was Fig. 165: Cannabis herb seizures in the Plurinational State of Bolivia, Mexico and the United States, 1994-2009 (kg, logarithmic scale) Sources: UNODC ARQ, Bolivia (Plurinational State of), United States (annual reports), Mexico (Government), UNODC field offices, INTERPOL
7,000 6,000 5,000
10,000,000
4,000
1,000,000
3,000
100,000
2,000
10,000
1,000
1,000
0
100 1999 2000 2001 2002 2003 2004 2005 2006 2007 2008
10 North Americ a
S outh Americ a
Afric a
R es t of the world
Mexic o
United S tates
1 1994 1996 1998 2000 2002 2004 2006 2008 B olivia (P lurinational S tate of) Mexic o
8
Frequency measured in terms of number of incidents/seizure cases.
188
United S tates
2. Drug statistics and trends Cannabis
2.4.3 Prices Given the relative ubiquity of cannabis cultivation, local demand for cannabis herb tends to be met by production occurring in proximity to consumption, resulting in trafficking patterns which are generally rather localized. Moreover, cannabis herb undergoes relatively little processing before reaching the consumer. Both of these factors distinguish cannabis herb from other plant-based drugs in terms of the driving forces setting price levels. There are a number of factors that may affect prices of heroin and cocaine: sharp increases or decreases of its cultivation in one or two countries, costs and risks associated with processing the drug and its trafficking to the destination and the country’s role and position in the production and transport chain. All these factors play a much lesser role in setting the wholesale and retail price of cannabis herb. Nevertheless, prices of cannabis herb display a noticeable variability across different countries and regions, even when adjusted for purchasing power parities (interna-
tional dollars). Some regions revealed intra-regional consistency, although comparisons across countries should be considered with caution since prices may relate to different product types. High retail prices were reported by Japan, Singapore and two territories in Eastern Asia (Hong Kong and Macao, China). The high price in Japan may be due to the fact that, as reported by Japan, in 2007 cannabis herb was mainly imported, originating in Canada (74%), South Africa (15%) and the Netherlands (11%).9 This is contrary to the prevalent pattern in other countries, where most cannabis herb is locally sourced. Cannabis herb prices in Europe were also relatively high. The lower end of the scale was occupied mainly by countries in Africa, South America and East, South-East and South Asia. The analysis of the ratio between wholesale and retail prices in selected countries indicates that the markup from wholesale to retail varies across countries and regions. Although the overall estimate indicates a markup
Fig. 167: Typical retail and wholesale cannabis herb prices, adjusted for purchasing power parity, 2008 (log-log scale)
Retail price, International dollars (2008) per gram (log scale)
Note: On a linear scale, the slope of the line of best fit (through the origin) is 2.29. This means that, overall, there is a markup of 129% in price from wholesale to retail level. ‘International dollars’ are used to express PPP-adjusted values. An international dollar represents the purchasing power of one US dollar based on a basket of goods with US prices. Source: UNODC ARQ (price data), World Bank (purchasing power parities)
100.0 y = 2.29x
y=x
Afric a
E urope 10.0 Other
L atin Americ a 1.0 L ine of nil markup L ine of bes t fit 0.1 0.01
0.10
1.00
10.00
100.00
Wholes ale pric e, International dollars (2008) per gram (log s c ale) 9
There are, however, indications of small-scale cultivation of cannabis in Japan.
191
World Drug Report 2010
Fig. 168: High cannabis herb prices, adjusted for purchasing power parities, 2008
Fig. 169: Low cannabis herb prices, adjusted for purchasing power parities, 2008
Source: UNODC (ARQ price data), World Bank (purchasing power parities) Note: ‘International dollars’ are used to express PPP-adjusted values. An international dollar represents the purchasing power of one US dollar based on a basket of goods with US prices.
Source: UNODC (ARQ price data), World Bank (purchasing power parities) Note: ‘International dollars’ are used to express PPP-adjusted values. An international dollar represents the purchasing power of one US dollar based on a basket of goods with US prices.
of 129%, the markup tends to be higher in Africa than in Europe. One possible reason for this could be that production of cannabis herb occurs on a larger scale in Africa, resulting in a more pronounced disparity between wholesale and retail prices. In contrast with cannabis herb, both retail and wholesale prices of cannabis resin are more dispersed when
Togo
Guatemala
P oland
Montenegro
Czech R ep.
F inland
Hungary
Hong Kong, China
Mauritius
Macao China
L ithuania
S ingapore
J apan
0
Tanzania, U.R.
5
Sri Lanka
10
Swaziland
15
Burkina Faso
20
Indonesia
25
Wholes ale
Israel
Wholesale
30
R etail
Bolivia
35
2.0 1.8 1.6 1.4 1.2 1.0 0.8 0.6 0.4 0.2 0.0 Philippines
R etail
Paraguay
40
International Dollars (2008) per gram
International Dollars (2008) per gram
45
expressed in purchasing power parities.10 This may suggest that factors other than the purchasing power of local consumers and traffickers are more important in driving prices. Indeed, cannabis resin is produced in a handful of countries and prices are affected by the interregional nature of trafficking routes. Very low cannabis resin prices were reported in 2008 by
Fig. 170: Typical retail and wholesale cannabis resin prices per gram in US dollars, 2008 Note: The slope of the line of best fit (through the origin) is 2.10. This means that, overall, there is a markup of 110% in price from wholesale to retail level. Source: UNODC ARQ
Retail Price (US Dollar per gram)
30 As ia 25
y = 2.10x Wes tern E urope
20 R es t of E urope 15 Other 10
y=x L ine of nil markup
5
L ine of bes t fit 0 0
2
4
6
8
10
12
Wholes ale pric e (US dollars per gram) 10 For this reason, the prices in the figure are expressed in US$.
192
2. Drug statistics and trends Cannabis
Fig. 171: High cannabis resin prices, 2008
Fig. 172: Low cannabis resin prices, 2008
Source: UNODC ARQ/DELTA
Source: UNODC ARQ/DELTA
10 R etail Wholes ale
25
US dollars per gram
20 15 10 5
9
R etail
8
Wholes ale
7 6 5 4 3 2 1 Pakistan
Iran (Islamic Republic of)
Paraguay
Serbia
Eritrea
Israel
Spain
France
United Kingdom
Pakistan and the Islamic Republic of Iran, reflecting their proximity to the major producing country Afghanistan, as well as Paraguay, another country with significant production of cannabis. Countries in West Europe also reported relatively low prices, notably Spain, the main point of entry for cannabis resin into continental Europe from Morocco. High cannabis resin prices were reported by the Russian Federation and neighbouring Belarus.
0 Moldova, Republic of
Italy Saudi Arabia
Malta
Czech Republic
Greece
Bulgaria
Slovenia
Finland
Canada
Belarus
Russian Federation
0
Germany
US dollars per gram
30
193
World Drug Report 2010
2.4.4 Consumption Cannabis remains the most widely used illicit substance in the world. Globally, the number of people who had used cannabis at least once in 2008 is estimated between 129 and 191 million, or 2.9% to 4.3% of the world population aged 15 to 64. Compared to last year, the lower bound of the estimate decreased and the range widened due to the increased uncertainty of having dropped some countries’ estimates which were more than ten years old. National experts in many parts of the world perceive cannabis use to be either stabilizing or increasing, although about 15 countries reported a decrease in 2007 and 2008. In Africa, where quantitative information on illicit drugs use is scarce, the majority of national experts perceive an increase in the use of cannabis.
In North America, cannabis use has been declining or stabilizing over the past years In North America, there are an estimated 29.5 million people who had used cannabis at least once in 2008, a decrease from the 31.2 million estimated in 2007. This decrease reflects the availability of new data for Canada, which in 2008 showed a considerably lower number of cannabis users compared to their previous 2004 survey estimates. Cannabis use in the United States and Canada has been declining or stabilizing over the past years, although a slight increase was observed in the United States in 2008 (from 12.3% of the population aged 15-64 in 2007 to 12.5% in 2008). In the United States, between 2002-2007, there was a significant decrease in
Table 25: Estimated number of people who used cannabis at least once in the past year and prevalence among population aged 15-64, by region, 2008
Region/subregion
Estimated number of users annually (lower)
-
Estimated number of users annually (upper)
Percent of population aged 15-64 (lower)
-
Percent of population aged 15-64 (upper)
Africa Eastern Africa North Africa Southern Africa West and Central Africa
27,680,000 4,500,000 4,680,000 4,450,000
-
52,790,000 9,190,000 10,390,000 11,170,000
5.0 3.4 3.6 4.0
-
9.6 7.0 8.0 10.1
14,050,000
-
22,040,000
7.8
-
12.3
Americas Caribbean Central America North America South America
38,210,000 430,000 540,000 29,950,000 7,300,000
-
40,030,000 1,960,000 600,000 29,950,000 7,530,000
6.3 1.6 2.2 9.9 2.9
-
6.6 7.4 2.5 9.9 3.0
Asia Central Asia East/South-East Asia Near and Middle East South Asia
31,510,000 1,860,000 5,370,000 7,790,000 16,490,000
-
64,580,000 2,140,000 23,940,000 10,950,000 27,550,000
1.2 3.7 0.4 3.1 1.9
-
2.4 4.3 1.6 4.4 3.1
Europe East/South-East Europe Western/Central Europe
29,370,000 8,520,000
-
29,990,000 9,010,000
5.3 3.0
-
5.4 3.2
20,850,000
-
20,990,000
7.7
-
7.8
2,140,000
-
3,410,000
9.3
-
14.8
128,910,000
-
190,750,000
2.9
-
4.3
Oceania Global
194
2. Drug statistics and trends Cannabis
Oceania
the annual prevalence of cannabis use within the population aged 12 and older, from 11% to 10.1%. In 2008, the annual prevalence of cannabis use increased for the first time after 2002, reaching the level observed in 2006 (10.3% of the population aged 12 and older).11 A similar trend has been observed among secondary school students.
25
Africa
2008
Africa
120 2007
Asia
130
0 Americas
140
50
Americas
150
100
Europe
160
150
Europe
170
Asia
180
200
20 15 10 5 0 Oceania
190
250
Global
200
Global
Number of drug users in milions
Source: UNODC ARQ/DELTA
Lower/ Upper Prevalence Range (in Millions)
Fig. 175: Cannabis: lower and upper range of numbers and annual prevalence, globally and by region
Lower/ Upper Prevalence Range (%)
Fig. 173: World annual cannabis users
Fig. 174: Global trend in the perception of cannabis use: unweighted average of trends as reported by national experts* * The graph measures the trend from countries reporting an increase or decrease in drug use (it does not measure the trend in number of drug users). Source: UNODC ARQ
Cumulative unweighted average of perceived trends in cannabis use as reported by countries
10
Average inc reas e over pas t year
8 B as eline (if all c ountries had perc eived 's ome' inc reas e)
6 4 2 0 1998 (67)
2000 (55)
2002 (97)
2004 (107)
2006 (99)
2008 (90)
Year (Member S tate E xpert R es pons es )
11 Substance Abuse and Mental Health Services Administration Results from the 2008 National Survey on Drug Use and Health, National Findings, Office of Applied Studies (OAS), SAMHSA, US Department of Health and Human Services, September 2009.
195
World Drug Report 2010
Fig. 177: Proportion of recent cannabis users diagnosed as ‘dependent’ in some Latin American countries
Source: Data from the Monitoring the Future study, 2009, National Institute of Drug Abuse, USA
Source: UNODC and CICAD, First comparative Study on Drug Use and Associated Factors in the General Population aged 15-64
40
60
35
25 20 15 10 5 2009
2008
2007
2006
2005
2004
2003
2002
2001
0
% among the recent uses
51.2
30
2000
Annaul prevalence of cannabis use
Fig. 176: Annual prevalence of cannabis use among US high school students, 2000-2009
50 40
35.7 27.5
30 20.4
20.7
Uruguay
Chile
20 10 0
Grade 12
Grade 10
Grade 8
Despite the large decline from 2002, cannabis remains the most commonly used illicit drug among US drug users. In 2008, cannabis was used by 75.7% of current illicit drug users and was the only drug used by 57.3% of them.12 The annual prevalence among the population aged 15 and older in Canada has also decreased significantly, from 14.1% in 2004 to 11.4% in 2008.13 In 2008, the 32.7% prevalence of cannabis use among youth aged 15 to 24 was more than four times higher than the prevalence of 7.3% for adults 25 and older. Compared with the national average of 11.4%, the prevalence of pastyear use of cannabis was fairly consistent across the provinces in Canada.14 In 2008, Mexico conducted a national representative household survey for urban and rural populations aged 12 to 65. Compared with results of the last survey in 2002, the annual prevalence of cannabis use among the general population had increased from 0.6% to 1%.15 Despite the recent increase, and Mexico’s role as an important cannabis supplier to the US market, household survey results continue to show considerably lower prevalence rate for Mexico than for Canada or the United States.
12 Ibid. 13 Health Canada, Canadian Centre on Substance Abuse, Canadian Alcohol and Drug Use Monitoring Survey, summary of results for 2008. 14 Ibid. 15 Mexico, Secretaria de Salud Mexico, Instituto Nacional de Salud Publica, Encuesta Nacional de Adicciones 2008, Cuernavaca, Morelos 2009.
196
Argentina
P eru
E cuador
Increase in cannabis use has been reported in South America In contrast to North America, a perceived increase in cannabis use has been reported from almost all national experts in South America, although the annual prevalence of cannabis use in South America remains considerably lower than in North America. Around 3%, or an estimated 7.3 -7.5 million people among the population aged 15 to 64, had used cannabis at least once in the past year in 2008, which is a decrease from the 8.5 million estimated for 2007. This drop does not reflect a real change in cannabis use in the region between 2007 and 2008, but rather a revision of 2005 data reported for the Bolivarian Republic of Venezuela, where the prevalence estimates were revised from 7.5% to 0.9 %. The highest prevalence of cannabis use is found in Argentina (7.2%), Chile (6.7%) and Uruguay (6%). However, compared to the general population, the highest cannabis use prevalence among school students was reported among those in Chile (15.6%), Uruguay (14.8%) and Colombia (8.4 %).16 The comparative study on drug use and associated factors conducted by CICAD and UNODC in six Latin American countries showed that among the recent cannabis users (used in the past year) who were interviewed in the study, between 20.4% of cannabis users in Argentina to almost half of the recent users in Ecuador were diagnosed as dependent users,17 based on the clinical criteria of International Classification of Diseases (WHO – ICD revision 10).18 16 UNODC and CICAD, Informe Subregional sobre Uso de Drogas en Poblacion Escolarizada, 2009/2010. 17 UNODC and CICAD, First comparative Study on Drug Use and Associated Factors in the General Population aged 15-64, April 2008. 18 See: www.who.int/classifications/icd/en.
2. Drug statistics and trends Cannabis
Fig. 178: Annual prevalence of cannabis use among secondary school students* in selected South American countries
Fig. 179: Annual prevalence of cannabis use among the population aged 15-64 in selected South American countries
Source: UNODC data based on UNODC – CICAD, Informe Subregional sobre Uso de Drogas en Pobacion Escolarizada, 2009/2010 and ARQ * The age groups are different for the countries. For Argentina and Uruguay, 13-17; Chile 13-18; Brazil, Colombia and Paraguay, 15-16; Peru 11-17 and Ecuador 12-17 year old students.
Source: UNODC data based on UNODC estimates for 2007, UNODC and CICAD, First comparative Study on Drug Use and Associated Factors in the General Population aged 15-64 and ARQ
Argentina
7.2
Chile
6.7
15.6
Chile
Uruguay
14.8
Uruguay
B olivia
8.4
Columbia
P araguay
3.1 1.9
P eru 0
5
2.3 1.6
P araguay
4.2
E cuador
2.6
Colombia
6.3
B razil
4.3
B razil
7.6
Argentina
6
10
15
P eru
0.7
E cuador
0.7
20
0
2
Annual prevalenc e (%)
4
6
8
Annual prevalenc e (%)
prevalence of cannabis use among the general population is registered in the Bahamas (from 4.7% in 2003 to 5.5% in 2008), Grenada (from 6.7% in 2003 to 10.8% in 2005), Saint Vincent and the Grenadines (from 6.2% in 2002 to 7.1% in 2006), Trinidad and Tobago (from 3.7% in 2002 to 4.7% in 2006). A decreasing trend, in contrast, was observed in the Dominican Republic (from
Most of the countries in the Caribbean also have higher than world average prevalence of cannabis use, with rates such as 11.7% in Saint Kitts and Nevis and 10.8% in Dominica and Grenada. Haiti (1.4%) and the Dominican Republic (0.3%) are the two countries with low prevalence of cannabis use. Trends in cannabis use in the Caribbean are mixed. An increasing trend in
Fig. 180: Trends in the annual prevalence of cannabis use in the general population in Caribbean countries which reported new data in 2008 Source: UNODC 1.9
Dominican Republic '00 Dominican Republic '08
0.3 3.7
Trinidad&Tobago '02 Trinidad&Tobago '06
4.7 4.7
Bahamas '03
5.5
Bahamas '08
6.2
St. Vincent&Grenadines '02 St. Vincent&Grenadines '06
7.1 10.7
Jamaica '01 Jamaica '06
9.9 6.7
Grenada '03 Grenada '05
10.8 0
2
4
6
8
10
12
Annual Prevalence (%)
197
World Drug Report 2010
Fig. 181: Annual cannabis users in Africa Source: UNODC ARQ
Source: Source: Pluddemann A., Parry C., Bhana A., et al, Alcohol and Drug Abuse Trends, January – June 2009, Phase 26 (SACENDU reports data biannually)
Number of drug users in milions
60 55
25 in % of all treatment
50 45 40 35 30 25 20 2007
1.9% in 2000 to 0.3% in 2008) and in Jamaica (from 10.7% in 2001 to 9.9% in 2006). The 2005 estimates for Haiti were revised from 6.2% to 1.4% based on a school survey undertaken by CICAD. Africa continues to lack quantitative information, but cannabis use is perceived to be increasing in most parts of the continent Except for South Africa, there is no quantitative information available for Africa for 2008. The estimates provided for the continent are based on older data reported by UNODC in previous World Drug Reports. Compared to last year, the estimate for Ghana (annual prevalence 21.5%) was dropped because it was more than ten years old. Based on the available information, an estimated 27.7 to 52.8 million people, or 5.0% to 9.6% of the population aged 15 to 64, used cannabis in Africa in 2008. This wide range in the estimated number is mainly due to missing information and data from most of the African countries. In 2008, experts from 73% of the responding states in Africa reported increases in cannabis use compared with the previous year, with decreases noted only in North Africa. Zambia (17.7%) and Nigeria (13.8%) remain the countries with high prevalence of cannabis use. The only systematic monitoring of drug use in Africa is in South Africa where it is based on treatment demand. Based on annual data from the different regions in South Africa, between 26% and 58% of patients attending specialist treatment centres had reported cannabis as their primary or secondary drug of abuse.19 Pluddemann A., Parry C., Bhana A., and others, Alcohol and Drug Abuse Trends: January – June 2009 (Phase 26), South African Community Epidemiology Network on Drug Use (SACENDU), November 2009.
198
20 15 10 5
1997a 1997b 1998a 1998b 1999a 1999b 2000a 2000b 2001a 2001b 2002a 2002b 2003a 2003b 2004a 2004b 2005a 2005b 2006a 2006b 2007a 2007b 2008a 2008b 2009a
0 2008
19
Fig. 182: South Africa: cannabis as primary drug of abuse in treatment demand, 1997-2009
In Europe, cannabis use has been stabilizing in the past few years, but it is still increasing in some countries In Europe, an estimated 29.5 million people, or around 5.4% of the general population aged 15 to 64, used cannabis in the previous year. Cannabis use is largely concentrated among young people (15 – 34 years old). Within Europe, cannabis use differs considerably among the general population, with higher prevalence (7.7%) reported in West and Central Europe, compared to East and South-East Europe (3%). The Czech Republic (15.2% - 2008), Italy (14.6% - 2008) and Spain (10.1% - 2007) are the three countries with the highest cannabis use prevalence rates, accounting for about one third of all cannabis users in Europe (5 million only in Italy). The use of cannabis in Europe has evolved considerably over the last decade. In most countries, cannabis use increased during the 1990s and early 2000s, and this may now be moving into a new phase in some countries where data from the general population and school surveys point to a stabilizing or even decreasing trend. Countries that started to indicate a decrease in prevalence over the previous years include Spain, France, Germany, Austria, Hungary and Sweden. England and Wales (the third largest European market of cannabis users after Italy and the Russian Federation) had shown a strong decline between 2003 and 2008 (from 10.8% to 7.4% of the general population), however, in 2009, the prevalence increased to 7.9%. New data for Scotland, Finland, Romania and Bosnia and Herzegovina show a decrease. However, the majority of countries with new data in 2008 reported an increase in cannabis use from previous estimates. These are Bulgaria, the Czech Republic, Denmark, Estonia and Lithuania. The last few years have also seen a growing understand-
2. Drug statistics and trends Cannabis
Fig. 183: Europe: Annual prevalence of cannabis use among general population in countries reporting an increase in 2008 Source: UNODC
15.2
16
14.2
14 12 10.9
10.510.8 9.3
10
9.7
8.7 8.2
8
7.4 7.9 6
6
5.6
4.6
4
6.2
5.2 5.5
2.4 2.2
2
0.6
0.5
1.5
2.2 2.5
Bulgaria '08
Bulgaria '07
Bulgaria '05
Bulgaria '01
Denmark '08
Denmark '05
Denmark '00
Lithuania '08
Lithuania '04
Lithuania '03
Lithuania '02
Estonia '08
Estonia '03
Estonia '01
England & Wales '09
England & Wales '08
England & Wales '06
England & Wales '05
England & Wales '04
England & Wales '03
England & Wales '00
Czech Rep '08
Czech Rep '04
Czech Rep '02
0
Fig. 184: Europe: Annual prevalence of cannabis use among general population in countries reporting a decrease in 2008 Source: UNODC
11
Annual prevalence (%)
12 10 8
8.4 7.4 6.3
6 2.9
4
3.6
3.1
3
2.8
2
0.3
0.1
0.9
0.4
ing of the public health implications of long-term, widespread use of cannabis and rising reported levels of treatment demand for cannabis-related problems in Europe. Increases in cannabis use among school students occurred in a number of European countries between 1995 and 2003, but in most countries, it stabilized or decreased in 2007, although different patterns can be found across Europe. Seven countries, mainly in northern and southern Europe (Greece, Cyprus, Malta, Romania, Finland, Sweden and Norway), have reported overall stable and low lifetime prevalence of cannabis use between 2003 and 2007. Most West European countries, as well as
Romania '07
Romania '04
Romania '02
Bosnia & Her '08
Bosnia & Her. '05
Finland '08
Finland '06
Finland '04
Finland '02
Scotland '09
Scotland '06
Scotland '04
Scotland '03
0
Croatia and Slovenia, which had high or strongly increasing lifetime cannabis prevalence until 2003, saw a decrease or stabilization in 2007 – most noticeable among these countries is Ireland. In most parts of Central and East Europe, the increasing trend observed between 1995 and 2003 appears to be levelling out.20
20 EMCDDA, Statistical Bulletin 2009 and Hibell, et al, ESPAD Surveys 1995, 1999, 2003 and 2007.
199
World Drug Report 2010
Fig. 185: Varying trends of cannabis use among 15-16 year old students in Europe, 1995-2007
Lifetime prevalence of cannabis use
Source: ESPAD
45 F ranc e United Kingdom Netherlands B elgium (F landers ) Italy S lovenia Germany (6 B undes l.) Ireland C roatia Aus tria
40 35 30 25 20 15 10 5
Liifetime prevalence of cannabis use
0 50
1995
1999
2003
2007 C zec h R epublic
45
S lovakia
40
E s tonia
35
B ulgaria
30
L atvia
25
L ithuania P oland
20
Hungary
15 10 5 0 1995
1999
2003
2007
Liifetime prevalence of cannabis use
14 Malta F inland
12
S weden 10
Greec e Norway
8
C yprus R omania
6 4 2 0 1995
1999
Cannabis use in Oceania is also declining In the Oceania region, between 2.1 and 3.4 million people are estimated to have used cannabis in the past year (9.3% – 14.8% of the general population aged 15 – 64). Except for Australia, Fiji and New Zealand, there are no recent or reliable estimates available of cannabis use in the remaining parts of the region. However, information from school surveys done in the US Pacific
200
2003
2007
Island territories indicate considerable cannabis use among the youth where the lifetime prevalence ranges from 54.9% in the Commonwealth of Northern Mariana Islands, Guam 45.5%, American Samoa 17.6 and the Marshall Islands 13.9%.21 21 Centers for Disease Control and Prevention (CDC), Youth Risk Behavior Surveillance – Selected Steps Communities, United States, 2007.
2. Drug statistics and trends Cannabis
The 2008 range became larger, due to a higher prevalence in New Zealand and new data for some territories in the Pacific.
Fig. 186: Australia: annual prevalence of cannabis use among the population aged 14 and above, 1998-2007
In Australia, the annual prevalence of cannabis use has been declining since 1998, with an almost one fifth decline between 2004 and 2007. The major decline in cannabis use has been observed in the younger population (aged 14 to 19) from a prevalence of 34.6% in 1998 to 12.9% in 2007. In New Zealand, the annual prevalence of cannabis use fell from 20.4% in 2003 to 13.3% in 2006, to increase again in 2008 to 14.6%. The cannabis use prevalence was highest for men in the 18 – 24 age group and for women in the 16-17 and 18-24 year age groups.22
Source: National Drug Strategy Household Survey, Australia, 2007
In Asia, it is estimated that between 31.5 million and 64.6 million people had used cannabis in the past year. Higher annual prevalence rates of cannabis use is reported from Central Asia (3.7% to 4.3% of the general population) and the Near and Middle East (3.1% to 4.3% of the general population). The most populated countries in Asia, China and India, do not have estimates of cannabis users among the general population. A survey carried out in India in 2001 estimated a monthly prevalence rate of cannabis use at 3% of the male population aged 12-60. The lack of information on cannabis use among the female population prevents the development of an accurate estimate of the prevalence rate among the Indian population. The national drug authorities reporting to UNODC indicate a rise in cannabis use in the region over the past year. Since for many parts of the region there are no recent or reliable estimates available, the perceived trends by experts need to be treated with caution. In 2008, experts from 15 countries in Asia reported an increase in cannabis use compared to 13 in 2007 and nine in 2005. Experts from seven countries reported a stable trend and eight countries in Asia reported declines in cannabis use in 2008.
Annual prevalence of cannabis use in % of population
Limited or no recent data on cannabis use trends are available from Asia, but experts perceive an increase.
40 1998 2001 2004 2007
35 30 25 20 15 10 5 0 14-19
20-29
30-39
40-49
50-59
14+
22 Ministry of Health, Drug Use in New Zealand: Key results of the 2007/08, New Zealand Alcohol and Drug Use Survey, 2010.
201