CSAS
SCCS
Canadian Science Advisory Secretariat
Secrétariat canadien de consultation scientifique
Research Document 2011/002
Document de recherche 2011/002
Maritimes Region
Région des Maritimes
A Framework for the Assessment of the Scotian Shelf and Southern Grand Banks Atlantic Halibut Stock
Cadre d’évaluation du stock de flétan de l’Atlantique du plateau néo-écossais et du sud des Grands Bancs
M.K. Trzcinski, S.L. Armsworthy, S. Wilson, R.K. Mohn, and S.E. Campana
Population Ecology Division Bedford Institute of Oceanography PO Box 1006, Dartmouth, Nova Scotia B2Y 4A2 Canada
This series documents the scientific basis for the evaluation of aquatic resources and ecosystems in Canada. As such, it addresses the issues of the day in the time frames required and the documents it contains are not intended as definitive statements on the subjects addressed but rather as progress reports on ongoing investigations.
La présente série documente les fondements scientifiques des évaluations des ressources et des écosystèmes aquatiques du Canada. Elle traite des problèmes courants selon les échéanciers dictés. Les documents qu’elle contient ne doivent pas être considérés comme des énoncés définitifs sur les sujets traités, mais plutôt comme des rapports d’étape sur les études en cours.
Research documents are produced in the official language in which they are provided to the Secretariat.
Les documents de recherche sont publiés dans la langue officielle utilisée dans le manuscrit envoyé au Secrétariat.
This document is available on the Internet at: Ce document est disponible sur l’Internet à: www.dfo-mpo.gc.ca/csas-sccs ISSN 1499-3848 (Printed / Imprimé) ISSN 1919-5044 (Online / En ligne) © Her Majesty the Queen in Right of Canada, 2011 © Sa Majesté la Reine du Chef du Canada, 2011
Maritimes Region
Framework and Assessment: Atlantic Halibut Stock
TABLE OF CONTENTS Abstract ..................................................................................................................................... v Résumé .................................................................................................................................... vi Introduction ............................................................................................................................. Landings.............................................................................................................................. Life History and Biology ...................................................................................................... Population Assessment History .......................................................................................... Management Unit and Tagging........................................................................................... Fisheries Data ..................................................................................................................... Indices of Abundance.......................................................................................................... Ageing Data ........................................................................................................................
1 1 1 2 3 4 5 6
Assessment Model ................................................................................................................. Methods .............................................................................................................................. Model Testing......................................................................................................................
7 7 8
Assessment Results............................................................................................................... 8 Sensitivity and Model Comparisons .................................................................................... 9 Reference Points................................................................................................................. 10 Discussion............................................................................................................................... 11 Acknowledgements ................................................................................................................ 12 References............................................................................................................................... 12 Tables....................................................................................................................................... 15 Figures ..................................................................................................................................... 29 Appendix A. Atlantic halibut length frequency and proportions at length ................................ 69 Appendix B. Estimated selectivities and numbers at age used in the halibut simulation model .................................................................................................................. 80 Appendix C. Atlantic halibut proportions at length (points) and model fit (line) for each data component. Residual plots plotted against length and year ............................... 82 Appendix D. Monte Carlo Markov-Chain (MCMC) simulations and Maximum Likelihood Estiamtes (MLE, vertical dashed line)................................................................. 105 Appendix E. Model fit and residual plots from the halibut catch at age (CAA) model ............. 108 Appendix F. Residual plots for the RV and halibut survey index (HSI) catch at age, fit to the RV and HSI abundance index, and projections for the virtual population analysis (VPA) model.......................................................................................... 111
iii
Maritimes Region
Framework and Assessment: Atlantic Halibut Stock
iv
Maritimes Region
Framework and Assessment: Atlantic Halibut Stock
Correct citation for this publication: La présente publication doit être citée comme suit : Trzcinski, M.K., S.L. Armsworthy, S. Wilson, R.K. Mohn, and S.E. Campana. 2011. A Framework for the Assessment of the Scotian Shelf and Southern Grand Banks Atlantic Halibut Stock. DFO Can. Sci. Advis. Sec. Res. Doc. 2011/002 vi + 112 p.
ABSTRACT The literature and data on Atlantic halibut was reviewed with the primary goal of supporting the first quantitative age-structured assessment of the Scotian Shelf and southern Grand Banks Atlantic halibut stock. The Canadian and foreign landings back to 1970 were used in the assessment. The catch at length was estimated using observer and port sampling data from 1988 for the longline fishery and from 1984 for the otter trawl fishery. The long-term average discard rate was used to estimate the total catch back to 1970. The total catch in the longline fishery was further divided into males and females based on observer data. A length-based, age-structured model was fitted to the length compositions in the catch and to the catch rate and length composition of halibut caught in the Scotia-Fundy groundfish Research Vessel survey (1970-2009) and halibut survey (1998-2009). Simulation testing, model fit and model comparisons indicate that the catch at length (CAL) model was good for estimating stock size and the impact of the fishery. Model estimates indicate a high population biomass and recruitment in the 1970s, increased biomass, but poor recruitment in the 1980s, low biomass and recruitment in the 1990s, and increasing biomass and recruitment in the 2000s. The spawning stock biomass in 2009 was estimated at 6527t (2592t females only). Exploitation rates were about 0.2 for the longline and otter trawl fisheries in 1970, but rapidly increased to 0.4 or greater in the late 1980s and early 90s as the population decreased. Current fishing mortality is about 0.2 for the longline fishery, but in recent years there was increased pressure on females with fishing mortality of 0.30 compared to 0.14 for males in 2009. Fishing mortality from the otter trawl fishery has been low since the mid 1990s and in 2009 was estimated at 0.02. Candidate biological reference points were estimated from the catch at length (CAL) and virtual population analysis (VPA) models using the approach outline by Sissenwine-Shepherd (1987). Both assessment models gave similar results (BMSY=4900t, FMSY=0.36). Based on assessment model results, 3NOPs4VWX5Zc Atlantic halibut population is in a productive period due to high recruitment. The SSB is estimated to be in the healthy zone; above the BMSY. Current fishing mortality (0.2) is well below FMSY (0.36). Although catch projections were not made, recent high recruitment would be expected to result in higher SSB at the current fishing mortality rate in the near term. The proposed framework for assessing Atlantic halibut takes advantage of length frequency and catch rate data from multiple datasets and is both robust and effective in estimating stock status, the impact of the fishery, and the provision of management advice.
v
Maritimes Region
Framework and Assessment: Atlantic Halibut Stock
RÉSUMÉ On a procédé à une analyse des documents et des données sur le flétan de l’Atlantique, qui avait pour but principal d’appuyer la première évaluation quantitative, structurée selon l’âge, du stock de flétan de l’Atlantique du plateau néo-écossais et du sud des Grands Bancs. Les débarquements canadiens et étrangers (remontant jusqu’à 1970) ont servi à cette évaluation. Les captures selon l’âge ont été estimées d’après les données des observateurs et les données d’échantillonnage au port de 1988 pour ce était de la pêche à la palangre et de 1984 pour ce qui était de la pêche au chalut à panneaux. Le taux moyen de rejets à long terme a servi à estimer les captures totales rétrospectivement jusqu’en 1970. Les captures totales dans la pêche à la palangre ont ensuite été réparties entre mâles et femelles, selon les données des observateurs. Un modèle fondé sur la longueur des captures et structuré selon l’âge a été calé sur la composition des captures selon la longueur, ainsi que sur le taux de captures et la composition, selon la longueur, des flétans échantillonnés dans le relevé par navire scientifique sur le poisson de fond de Scotia Fundy (1970 2009) et le relevé sur le flétan (1998-2009). Il ressort des simulations, du calage des modèles et des comparaisons entre ces derniers que le modèle fondé sur les captures selon la longueur (CSL) produisait une bonne estimation de l’effectif du stock et de l’incidence de la pêche. Les estimations du modèle dénotent une forte biomasse et un recrutement élevé parmi la population dans les années 1970, une hausse de la biomasse, mais un piètre recrutement dans les années 1980, une faible biomasse et un faible recrutement dans les années 1990 et une hausse de la biomasse et du recrutement dans les années 2000. La biomasse du stock de reproducteurs en 2009 a été estimée à 6 527 t (2 592 t de femelles exclusivement). Le taux d’exploitation était d’environ 0,2 dans la pêche à la palangre et au chalut à panneaux en 1970, mais il a rapidement augmenté pour se situer à au moins 0,4 à la fin des années 1980 et au début des années 1990, alors que la population diminuait. La mortalité par pêche actuelle est d’environ 0,2 dans la pêche à la palangre, mais ces dernières années la pression exercée sur les femelles a augmenté et la mortalité parmi elles a été de 0,30 en 2009, comparativement à 0,14 chez les mâles. La mortalité par pêche dans la pêche au chalut à panneaux est faible depuis le milieu des années 1990 et en 2009 elle a été estimée à 0,02. On a établi des points de référence estimatifs d’après le modèle de captures selon la longueur (CSL) et d’après le modèle d’analyse de population virtuelle (APV), en suivant l’approche décrite dans Sissenwine Shepherd (1987). Les deux modèles ont produit des résultats semblables (BPME = 4 900 t, FPME = 0,36). Selon le modèle d’évaluation, la population de flétan de l’Atlantique de 3NOPs4VWX5Zc traverse une période productive en raison du fort recrutement. On estime que l’état de la BSR se situe dans la zone saine, audessus de la BPME. La mortalité par pêche actuelle (0,2) est bien inférieure à FPME (0,36). Bien qu’on n’ait pas effectué de projections de captures, au taux de mortalité par pêche actuel le fort recrutement récent devrait se traduire à court terme par une BSR plus élevée. Le cadre proposé pour l’évaluation du flétan de l’Atlantique tire parti des données sur les fréquences de longueur et sur les taux de captures provenant de multiples ensembles de données et c’est un outil à la fois solide et efficace pour estimer l’état du stock et l’incidence de la pêche, et pour formuler un avis sur la gestion du stock.
vi
Maritimes Region
Framework and Assessment: Atlantic Halibut Stock
INTRODUCTION This document presents a new framework for the assessment of the Atlantic halibut (Hippoglossus hippoglossus) stock on the Scotian Shelf and southern Grand Banks. The assessment model can be broadly described as a length- based, age-structured model. The model fits to the length composition of the catch from the longline and otter trawl fisheries, and to survey catch rates and length composition. The document was organized into three main sections: 1) data, including fishery, survey and life history data, 2) assessment model structure with equations and assumptions, and 3) assessment results with estimates of spawning stock biomass, fishing mortality and biological reference points. LANDINGS Atlantic halibut has been exploited in Eastern Canadian waters for more than a century (Fig. 1a). The earliest records show that most of the halibut catch was landed in Nova Scotia. From 1870 to 1910, 85% of the total landings were landed in Nova Scotia (477 metric tons; Table 1). Nova Scotia landings nearly tripled from 1911 to 1949 averaging 1273t, or approximately 95% of the reported landings. Landings increased dramatically in 1950 and 1951 to 5122 and 3475t respectively (Fig. 1a) and over 8000t in 1967 and 1968, but it was likely that Greenland halibut (i.e. turbot) and Atlantic halibut were not differentiated and these high values represent a mixture of landings of both of these species. With the creation of the International Commission for the Northwest Atlantic Fisheries (ICNAF) and later the North Atlantic Fisheries Organization (NAFO) landing statistics were reported in regions called sub-areas and divisions. The landings for what would eventually be defined as the Scotian Shelf and Southern Grand Banks (3NOPs4VWX5Zc) stock were 3780t in 1960 (Table 2, Fig. 2). Landings declined to 984t in 1974 and increased to 4109t in 1985. Until 1988 the fishery was unregulated, at which point a total allowable catch (TAC) of 3200t was implemented. The TAC remained at this level for six years during which landings declined. In 1994, the TAC was decreased to 1500t and the following year it was further reduced to 850t. A legal size limit of 81cm was also implemented in 1994. Since 1995, the TAC and landings have steadily increased and the TAC was set at 1700t for the 2010-2011 fishing year (Fig. 1b). The landings are primarily caught by Canadian fishermen using longline gear (Fig. 2). Foreign landings were high in the 1960s and comprised 20 to 30% of the catch, but declined in 1973 to 69t. In 1977, foreign effort was excluded from most of the stock area with the implementation of the 200 mile limit, with the exception of the tail of the Grand Banks (SE portion in 3N). In 2009, foreign catch was only ~1% of the landings (Fig. 3a). Canadian landings also declined over a slightly longer period up until 1975. Canadian landings increased in 1986 to approximately the 1960’s levels. Canadian landings declined and reached an all time low in 1994 but have steadily increased over the past 16 years (Fig. 2). The proportion of the landings caught by the longline and otter trawl fisheries was fairly even in the 1960s and 70s, but landings have primarily come from the longline fishery since 1980 (Fig. 3b). LIFE HISTORY AND BIOLOGY The Atlantic halibut is a large-bodied long-lived species that has captured the imagination and curiosity of fisherman and scientists. It is the largest of the flatfish species and is sexually dimorphic where females grow to a larger size than males. In Eastern Canada, the largest female on record was caught in 2004, measured 2.33m in length, and weighed approximately 173kg. The largest male was caught in 2003 and measured 2.13m. Halibut are found throughout the coastal waters of Eastern Canada from depths less than 50m to more than 1,250m, but are typically caught between 200 and 450m. Males are caught in deeper waters than females (p < 0.001, Fig 4), but the difference of only 16m may not be 1
Maritimes Region
Framework and Assessment: Atlantic Halibut Stock
biologically relevant. Our results are opposite to McCracken’s (1958) conclusion, however, McCracken only examined relatively shallow waters (90 – 147m), and his sample size (n=185) was much smaller than ours (n=10,168). Both McCracken (1958) and Zwanenberg et al. (1997) concluded that larger fish preferred deeper water. Zwanenberg et al. (1997) examined a greater range of depths than McCracken (1958) but the relationship was weak, possibly because the research survey use an otter trawl which selects for smaller halibut. A cursory examination of fisheries data (longline and otter trawl combined) indicates that there was little depth preference by size (Fig. 5). It is well known that halibut prefer cold water along the edge of the continental shelf, typically within a few degrees of 5C (Neilson et al. 1993, Bowering 1986). Preliminary work using pop-up satellite tags confirms this habitat preference. Large halibut can be extremely fecund. A 90.7kg female may produce over 2 million eggs (Lonning et al. 1982) and in another study a 195cm female produced ~7 million eggs (Haug and Gilliksen 1988). Current data on the size at maturity of fish on the Scotian Shelf or the southern Grand Banks are lacking, older work in the region found that females reached 50% maturity at about 119cm (total length), while males reached 50% maturity at about 77cm (Trumble et al. 1993, Table 3). Recent work in the Gulf of St. Lawrence found that fish matured at a slightly smaller length (Archambault 2007, Table 3). Using our growth data (described below) and the length at maturity from Trumble et al. (1993) we estimated that females and males reach 50% maturity at 9 years, and 5 years of age, respectively. Halibut are long-lived. The oldest halibut observed was a 50 year old male (Armsworthy and Campana 2010), however, individuals over 25 years old were rare in our collection. Natural mortality should be less than 0.2 in order for individuals to reach this age. In this assessment, we assumed a natural mortality of 0.1. POPULATION ASSESSMENT HISTORY The assessment of Atlantic halibut has gone through several stages. The first stock assessment was by Perley et al. (1985), where they examined distributional patterns, patterns in exploitation and a commercial catch per unit effort (CPUE) index. The recommendation for the Scotian Shelf and southern Grand Banks management unit was made by Neilson et al. (1987) based largely on the tagging study by Stobo et al. (1988). Neilson et al. (1987) also compared length/weight relationships and growth rates and concluded that the Gulf of St. Lawrence was a separate stock. Neilson and Bowering (1989) examined the effect of a minimum size limit on yield and concluded that a minimum legal size of 81cm would not have a significant effect on yield unless natural mortality was low (~0.1). A minimum legal size of 81cm was adopted on an interim basis in 1988, and was ‘enforced’ in 1990, but Annand and Beanlands (1993) commented that the minimum size limit was not strictly enforced. In the observed portion of the otter trawl fleet, enforcement only became strongly apparent in 1994 when the length frequency of kept individuals became truncated. Annand and Beanlands (1993 and 1996) examined the catch rate of halibut in the groundfish research trawl survey (RV), and commercial fishery (CPUE) and recommended a decrease in the TAC based largely on low catch and decreasing catch rates. Zwanenberg et al. (1997) provided the first in-depth review and analysis of halibut data: landings, distribution, catch rate of several groundfish RV surveys, CPUE for the commercial fishery, and estimates of total mortality. In particular, they demonstrated that there was a reduction in the number of larger individuals from 1960’s to the 1990’s. From these data, they estimated that Z increased from 0.32 in the 1960’s to 0.51-0.53 in the 1990’s. Their yield per recruit analysis resulted in F0.1 = 0.08 and Fmax = 0.24. Assessments up to 1997 relied heavily on fishery data and the RV survey data which typically catches only 40 to 70 small (30 to 70 cm) halibut per year. In response to the lack of data on larger halibut, a joint industry/DFO 2
Maritimes Region
Framework and Assessment: Atlantic Halibut Stock
halibut survey was initiated in 1998. Assessment and science advice from 1998 to present have relied heavily on the trends in the halibut survey (e.g. Trzcinski et al. 2009). This framework assessment attempts to take full advantage of the wealth of data generated from the halibut survey. In particular, the halibut survey produces estimates of annual catch rate and length composition. Further, joint industry/DFO projects on halibut ageing and tagging were also made possible through collaboration with the Atlantic Halibut Council, a consortium representing the industry. The principal sources of data for this framework assessment are the length composition in the catch, ageing data, the catch rate in the halibut survey and in the Scotia-Fundy groundfish RV survey. It should be noted that the data have limitations inherent in the biology of the species (long-lived, large, highly mobile). Cohorts can only be followed in the RV survey for the first few ages. The halibut survey catches larger and older individuals, the segment of the population we are principally interested in, but cohorts are not distinguishable. The model integrates these datasets. MANAGEMENT UNIT AND TAGGING The current management unit for Atlantic halibut on the Scotian Shelf and southern Grand Banks (3NOPs4VWX5Zc) is the largest of any groundfish in Canadian waters (Fig 6). Early tagging studies found that halibut could move long distances as two fish tagged off of Anticosti Island were recovered in Icelandic waters (Martin and McCracken 1950), and 4 of 8 fish tagged in Iceland were recaptured in Canadian waters (Trumble et al. 1993). Many groundfish, including Atlantic halibut were tagged in the early years of the ICNAF and NAFO organizations to help define stock boundaries. Stobo et al. (1988) found that Atlantic halibut moved long distances, which provided the basis for the current management unit. Between 1953 and 1973, 290 tags were recovered out of 1296 tagged halibut, for a recovery rate of 22.4% (Stobo and Fowler 2006). A joint Industry/DFO tagging study was initiated in 2006 and halibut were tagged and released in 2006, 2007 and 2008. This study was more rigorously implemented as fishermen were allocated a given batch of tags, tagging was done by observers and in proportion to abundance, fish of all sizes were tagged, all fish were double tagged, fishermen were compensated for releasing legal size fish, and a reward of $100 was given for returned tags. Analyses of these data, including estimates of fishing mortality are presented in Den Heyer et al. (2011). Estimates of fishing mortality based on tagging provide an independent ‘check’ of the assessment model results. Here we analyze the release and recovery location of 2064 halibut tagged on the Scotian Shelf and southern Grand Banks. A total off 411 halibut were recovered. Halibut were generally recaptured in the same NAFO division in which they were tagged, with only 12 recaptured in the Gulf of St. Lawrence (4RST, Table 4). An analysis of the Gulf of St. Lawrence tagging program show similarly low levels of interchange (Table 5). Recent tagging in the Gulf of Maine indicates considerable transboundary movement, as 33% of the recaptured halibut were caught in Canadian waters (Kanwit 2007, Col and Legault 2009). However, none of the halibut tagged between 2006 and 2008 on the Scotian Shelf and southern Grand Banks were recaptured in US waters. Overall, it appears that the management unit is supported by the current tagging data.
3
Maritimes Region
Framework and Assessment: Atlantic Halibut Stock
FISHERIES DATA Despite the economic importance of Atlantic halibut, onboard observer and port sampling have been sparse. The number of trips observed on the otter trawl fleet peaked during the collapse of the cod fishery, and then rapidly declined averaging 20 trips/year from 1997-2007. Only a few halibut fishing trips were observed from 1988 to 1995, averaged 17 trips from 1996 to 2009 but only 8, 6 and 10 trips were observed in 1997, 2004, and 2006 (Fig. 7). Seasonal coverage of the otter trawl fleet (1977-2007) peaked in April and steadily declined through the rest of the year, whereas longline coverage from 1988-2009 was highest in January, and lowest in autumn (Fig. 8). In the last three years, only 0.2% of halibut landings by the otter trawl fleet are observed (by weight), whereas 11.7% of the longline landings are observed. The groundfish port sampling program started in 1948, but halibut were not measured because most fish were landed with their head off. Halibut length was first recorded in our port sampling database in 1989. Between 0.007% and 0.53% of the landings by the otter trawl fleet were port sampled. On average, 0.28% of the halibut landed by longline fishermen were port sampled prior to 1998. When the halibut survey started in 1998, the majority of commercial index landings were port sampled, and the percentage of the landings port sampled increased to 3.6% on average. Table 6 presents a timeline of changes in the halibut fishery data. The catch-at-length is one of the most important data inputs to this assessment model. However, a full catch-at-length has not previously been estimated for Atlantic halibut. Zwanenberg et al. (1997) examined the length composition for the longline catch in 1960 and both the longline and otter trawl catch from 1994 to 1996. The catch-at-length was estimated using various assumptions about what the available samples represent in the context of overall landings. The accuracy of the resulting catch-at-length is ultimately determined by the degree to which natural variation in the catch (in time, space, length) was properly sampled. Both observer and port samples are used to estimate the catchat-length in the otter trawl and longline fishery. However, the legal size limit of 81cm implemented in 1994 poses certain problems. The proportion of the catch 9 or 10 ♀ or ♂ 7♀ 4.5 ♂ 13 ♀ 12 ♂ 8-18 ♀ 7-17 ♂
Reference DFO 2009a CSAS 2009/023 DFO 2007 CSAS 2007/007 Kohler 1967 McCracken 1958 Sigourney 2006 Trumble et al. 1993 Methven et al. 1992 Bowering, 1986 Miller et al. 1991 Jespersen 1917
110-115 (18kg) ♀ 55 (1.7kg) ♂
Jákupsstovu and Haug 1988 Haug and Tjemsland 1986 Devold 1938
20
Maritimes Region
Framework and Assessment: Atlantic Halibut Stock
Table 4. Cross tabulation of release and recapture by NAFO division Atlantic halibut tagged as part of the most recent (2006-2008) DFO-Industry tagging program in 3NOPs4VWX. (n=2064, release period of 12 days to 4 years). Release Area
Total
Return Area
Released
3N
3O
3P
3N
201
5
44
2
3O
147
5
7
3P
410
8
63
4V
554
1
10
4W
463
4X
289
Total
2064
1
6
58
4R
4T
4V
Total 4W
4X
5Y
2 1 10
4
57
1
14
6
90
9
123
13
61
10
3
4
35
6
5
3
10
40
3
5
66
102
55
50
3
38
411
3
6
Recaptured
85
90
2
2
Unknown
6
21
Maritimes Region
Framework and Assessment: Atlantic Halibut Stock
Table 5. Cross tabulation of release and recapture by NAFO division of Atlantic halibut tagged by commercial fishermen in the Gulf of St. Lawrence (4RST) and 3Pn between 1998 and 2008 (Diane Archambault, pers. comm.). The time between release and recapture events was between one day and 9 years.
Return Area Release Area
Total Released
3Pn
3Ps
4R
4S
4T
4Vn
Unknown
Total Recaptured
3Pn
213
17
0
5
0
0
1
0
23
4R
5984
5
0
147
31
0
0
7
190
4S
127
0
0
0
12
0
0
0
12
4T
997
5
2
2
7
55
16
1
88
Total
7321
27
2
154
50
55
17
9
313
Table 6. Time line of changes to halibut fishery data.
Year
Description
1867 - 1950
Landings recorded by province by Statistics branch
1951 – present
Landings recorded by ICNAF then by NAFO
1948
Groundfish port sampling started, but halibut not measured because fish were landed with heads off.
1977 – present
Observers on board otter trawl fleet
1988 – present
Observers on board longline fleet
1989
First halibut port samples recorded
1994
Legal limit of 81cm
1998 – present
Halibut survey started. Associated commercial index provides many samples with which to estimate commercial catch at length
22
Maritimes Region
Framework and Assessment: Atlantic Halibut Stock
Table 7. Equations for the halibut population assessment model.
Population dynamics
Ft ,s N t ,s (1 exp( Z ))
(1)
Ct , s
(2)
N t 1,s ,a 1 N t ,s ,a exp(( M Ft ,s ,a ))
(3)
Ft i,s ,a sai ,s Ft i
(4)
SSBt , F N t , F ,a mF ,a wF ,a / 1000
Z
LL survey and fishery ( i ) selectivity: (5)
s ai , s
1 1 exp (a )
RV surveys and OT fishery ( i ) selectivity:
(6)
(a s ifull ) 2 exp i v L i sa i 2 (a s full ) i exp v R
if a s ifull if a s ifull
Abundance indices ( i ): NS RV survey, halibut survey, commercial index (7)
I ti q i exp( hM )(1 - h ti,s ,a ) s ai ,s N t ,s ,a ,
where h = 0.5
s ,a
23
Maritimes Region
Framework and Assessment: Atlantic Halibut Stock
Sex specific predicted length composition in the catch
s f N s f N i,s a
(8)
Pt i,l, s
s l |a
t , s ,a
a
i,s a
a
s l |a
t , s ,a
a
Sex-specific length proportion-at-age (9)
( xls l as ) 2 exp f (l , ) s 2 2 as 2( a ) s l |a
s a
s a
Log likelihoods for each survey (k) (10)
kindex n ln k 2 I t t
1 2
(ln I
2 k
t
2 ln Iˆt )
t
Multinomial likelihood for length frequency data (11) kLF ( NOi ) * log( Ei 1e -6 ) ( NOi ) * log(Oi 1e -6 ) , i
i
where O = observations, E = fitted values and N the effective sample size
Constraint on recruitment (12)
penality (log( N t ,s ,1 / N t 1,s ,1 ) / 2 ) 2 * 0.5 t
Objective function value (ofv) (13) ofv kLF kindex penalities
24
Maritimes Region
Framework and Assessment: Atlantic Halibut Stock
Table 8. Data used to fit population dynamics mode of Atlantic halibut. The length composition data for the longline (LL) fishery was separated by sex. Sigma’s are assumed. Years of data
Likelihood form
or sample size
FISHERY DATA Canadian landings (LL and OT) Foreign landings (OT) Catch length composition (LL)
1970-2009 1970-2009 1988-2009
None None Multinomial
None None nt 150
Catch length composition (OT)
1984-2009
Multinomial
nt 150
1970-2009
Lognormal
= 0.1
1998-2009
Lognormal
= 0.1
NS RV summer survey (4VWX)
1970-2009
Multinomial
nt 150
Halibut survey
1998-2009
Multinomial
nt 150
1998-2009
Lognormal
= 0.1
Data component
ABUNDANCE INDICES Total numbers caught NS RV summer survey (4VWX)
Standardized catch rate Halibut survey
Length composition
SEX RATIO Halibut survey
25
Maritimes Region
Framework and Assessment: Atlantic Halibut Stock
Table 9. Penalties or constraint
Penalties Fishing mortality
Objective
Form
Keep below 1.0
Posfun
Reduce annual variance in recruitment
Random walk, lognormal error
Constraint Recruitment
= 0.5
26
Maritimes Region
Framework and Assessment: Atlantic Halibut Stock
Table 10. Parameter estimates and state variables (F, SSB) using maximum likelihood (MLE) and the asymptotic normal standard error (SE). Parameters without an SE indicates that it was fixed and not estimated. The MLE and the Bayesian posteriors are plotted in Appendix D.
SELECTIVITY PARAMETERS Shape parameter Otter trawl fishery Otter trawl fishery NS RV summer survey NS RV summer survey Longline fishery Longline fishery Halibut survey Halibut survey 50% retention Otter trawl fishery NS RV summer survey Longline fishery Longline fishery Halibut survey Halibut survey CATCHABILITY COEFFICIENTS
Symbol
Period
vLi v Ri vLi v Ri
1977-2009
MORTALITY PARAMETERS Fishing mortality (males) Fishing mortality (females) Natural mortality Spawning stock biomass
1970-2009 1970-2009
male female male female
1988-2009
s ifull
1977-2009
i full
1970-2009
s
1988-2009 1998-2009 1998-2009
SE
1.2 20.0 0.1 6.42
3.1 x 10⁻¹
7.0 7.0 7.0 7.0
5.00 2.80
5.8 x 10⁻²
5.47
2.8 x 10⁻²
5.88
2.5 x 10⁻²
5.55
3.7 x 10⁻²
5.51
5.0 x 10⁻²
1970-2009 1998-2009
8.78 x 10⁻¹ -1.74
1.7 x 10⁻² 4.1 x 10⁻²
N1 Z1970
1970 1970
1.49 x 10⁵ 0.2
2.6 x 10³
F F M
2009 2009 1970-2009
0.14 0.31 0.1
SSB
2009
6527
male female male female
1988-2009 1988-2009 1998-2009 1998-2009
qi
NS RV summer survey Halibut survey INITIALIZATION PARAMETERS Starting recruitment (age-1) Total mortality in first year used to estimate ages 2 to 20
1977-2009
MLE
27
3.3 x 10⁻³ 8.8 x 10⁻³ 170
Maritimes Region
Framework and Assessment: Atlantic Halibut Stock
Table 11. Contribution of each data set to the overall fit of the model. Data component FISHERY DATA Catch length composition ABUNDANCE INDICES NS RV summer survey Halibut survey LENGTH COMPOSITION ALL SURVEYS NS RV summer survey Halibut survey
Proportion of total likelihood 0.29 0.41 0.01 0.29
Table 12. Comparisons between the catch at length model (CAL; used in this assessment), the statistical catch-at-age (CAA) model and virtual population analysis (VPA). Model Type
Number of parameters
Fitting time step
SSB2009 (t)
CAL
46
Forward
6527
F2009 0.14 males 0.30 females
CAA
88
Forward
5280
0.17
VPA
10
Backward
5790
0.18
28
Maritimes Region
Framework and Assessment: Atlantic Halibut Stock
A)
B)
Figure 1. A) Atlantic halibut landings in Nova Scotia, New Brunswick, Prince Edward Island, and Quebec (SA4) and Newfoundland (SA3). B) Atlantic halibut landings in NAFO Divs. 3NOPs4VWX and Total Allowable Catch (TAC) in red.
29
Maritimes Region
Framework and Assessment: Atlantic Halibut Stock
Figure 2. Atlantic halibut total catch (including discards since 1994) by Canadian and foreign fishing fleets by longline (LL) and otter trawl (OT) gear.
30
Maritimes Region
Framework and Assessment: Atlantic Halibut Stock
Figure 3. Proportion of landings caught by a) the foreign fishing fleet and b) longline gear.
31
Maritimes Region
Framework and Assessment: Atlantic Halibut Stock
0.0010 0.0000
Density
0.0020
A) Males
0
200
400
600
800
1000
1200
1000
1200
0.0010 0.0000
Density
0.0020
B) Females
0
200
400
600
800
Depth, m Figure 4. Density distribution of depths for A) males and B) females. The black line was the Gaussian fit to the distributions. The red line was a Weibull fit with WinBugs.
32
Maritimes Region
Framework and Assessment: Atlantic Halibut Stock
Commercial fishery Male 250
Length (cm)
200
150
100
50
0 50
150
250
350
450
550
650
750
850
950
1100
1250
250
350
450
550
650
750
850
950
1100
1250
Female 250
Length (cm)
200
150
100
50
0 50
150
Depth (m) Figure 5. Length of males and females caught at depth in the commercial fishery (1977-2007). N = 5402 males, N = 4766 females.
33
Maritimes Region
Framework and Assessment: Atlantic Halibut Stock
4S
4R
4T 3L
4Vn
3Ps
5Y
3O
3N
4V 5Zc
4W 4X
Figure 6. Map of the management unit (NAFO 3NOPs4VWX5Zc) for Atlantic halibut. The Gulf of St. Lawrence (4RST), the northern Grand Banks (3L), and US waters are outside the management unit. The white line indicates the Exclusive Economic Zone (EEZ).
34
Maritimes Region
Framework and Assessment: Atlantic Halibut Stock
Figure 7. The annual number of observed halibut longline fishing trips.
Figure 8. Number of observed halibut longline fishing trips by month.
35
Maritimes Region
Framework and Assessment: Atlantic Halibut Stock
Figure 9. The proportion of the observed catch less than 82cm in the longline and otter trawl fishery.
36
Maritimes Region
Framework and Assessment: Atlantic Halibut Stock
Figure 10. Proportion female in the commercial fishery by year, and length.
37
Maritimes Region
Framework and Assessment: Atlantic Halibut Stock
Figure 11. The proportion of fish that were unsexed in observed longline trips.
38
Maritimes Region
Framework and Assessment: Atlantic Halibut Stock
Figure 12. The measured catch (observer + port samples), landings, and bump-up factors for the longline fishery.
39
Maritimes Region
Framework and Assessment: Atlantic Halibut Stock
Figure 13. The measured catch (observer + port samples), landings, and bump-up factors for the otter trawl fishery.
40
Maritimes Region
Framework and Assessment: Atlantic Halibut Stock
Figure 14. The Atlantic halibut landings and estimated total catch in the otter trawl and longline fishery.
41
Maritimes Region
Framework and Assessment: Atlantic Halibut Stock
Figure 15. The Atlantic halibut estimated total catch of males and females in the longline fishery.
42
Maritimes Region
Framework and Assessment: Atlantic Halibut Stock
Figure 16. Mean lengths of male and female halibut caught in the longline (LL) fishery and for sexes combined in the otter trawl (OT) fishery.
43
Maritimes Region
Framework and Assessment: Atlantic Halibut Stock
A)
B)
Figure 17. A) The standardized catch rate in the halibut survey using three approaches: a generalized linear model (GLM) of all stations covered 5 years or more, where vessels participated in > 3 years, and for 57 stations covered every year since 1999. The model was not fit to the 2010 point (+), but was shown for comparison. B) Trends in the commercial index catch rates. Error bars are 2SE.
44
Maritimes Region
Framework and Assessment: Atlantic Halibut Stock
250
Length (cm)
200
150
100
50 Male Female 0 0
5
10
15
Age Figure 18. Length at age for male and female Atlantic halibut.
45
20
25
30
Maritimes Region
Framework and Assessment: Atlantic Halibut Stock
Male 30
Std. Length (cm)
25
20
15
10
5
0 0
5
10
15
20
25
30
5
10
15
20
25
30
Female 30
Std. Length (cm)
25
20
15
10
5
0 0
Age Figure 19. Standard deviation of length at age for male and female Atlantic halibut.
46
Maritimes Region
Framework and Assessment: Atlantic Halibut Stock
Figure 20. Simulated longline landings used for model testing.
47
Maritimes Region
Framework and Assessment: Atlantic Halibut Stock
Figure 21. Simulated longline (LL) and RV survey proportions at length used for model testing.
48
Maritimes Region
Framework and Assessment: Atlantic Halibut Stock
Figure 22. Simulated RV summer and halibut survey abundance indices used for model testing.
49
Maritimes Region
Framework and Assessment: Atlantic Halibut Stock
Figure 23. Simulated halibut survey proportions at length used for model testing.
50
Maritimes Region
Framework and Assessment: Atlantic Halibut Stock
Figure 24. Simulated (in color) and estimated (black) biomass, recruits and numbers.
51
Maritimes Region
Framework and Assessment: Atlantic Halibut Stock
Figure 25. Simulated (dashed line) and estimated (solid line) fishing mortality.
52
Maritimes Region
Framework and Assessment: Atlantic Halibut Stock
Figure 26. Gear selectivity at age for male and female Atlantic halibut.
53
Maritimes Region
Framework and Assessment: Atlantic Halibut Stock
Figure 27. Model fit (line) to abundance indices (points). The model was not fit to the 2010 point (+), but was shown for comparison.
54
Maritimes Region
Framework and Assessment: Atlantic Halibut Stock
A)
B)
Figure 28. A) Spawning stock biomass, spawner numbers, and the number of age-1 recruits, B) total biomass and total number of Atlantic halibut.
55
Maritimes Region
Framework and Assessment: Atlantic Halibut Stock
Figure 29. Stock-recruitment relationship for Atlantic halibut. Numbers plotted indicate year at age-1.
56
Maritimes Region
Framework and Assessment: Atlantic Halibut Stock
Figure 30. Bubble plot of the predicted number of Atlantic halibut at age. Larger circles indicate large numbers
57
Maritimes Region
Framework and Assessment: Atlantic Halibut Stock
Figure 31. Fishing mortality for fully exploited halibut caught on longline (LL) and otter trawl (OT) gear.
58
Maritimes Region
Framework and Assessment: Atlantic Halibut Stock
Figure 32. Residual proportions at length of females caught by the RV summer survey. Red: positive residual, black: negative.
59
Maritimes Region
Framework and Assessment: Atlantic Halibut Stock
Figure 33. Residual proportions at length of males caught by the RV summer survey. Red: positive residual, black: negative.
60
Maritimes Region
Framework and Assessment: Atlantic Halibut Stock
Figure 34. Residual proportions at length of females caught by the longline fishery. Red: positive residual, black: negative.
61
Maritimes Region
Framework and Assessment: Atlantic Halibut Stock
Figure 35. Residual proportions at length of males caught by the longline fishery. Red: positive residual, black: negative.
62
Maritimes Region
Framework and Assessment: Atlantic Halibut Stock
Figure 36. Residual proportions at length caught by the otter trawl fishery. Red: positive residual, black: negative.
63
Maritimes Region
Framework and Assessment: Atlantic Halibut Stock
Figure 37. Comparisons between the catch at length model (CAL; used in this assessment), the statistical catch-at-age (CAA) model and virtual population analysis (VPA for a) spawning stock biomass and b) fishing mortality.
64
Maritimes Region
Framework and Assessment: Atlantic Halibut Stock
Figure 38. Fully exploited fishing mortality calculated as a weighted average of male and female fishing mortality for ages 8 to 20 (solid line) ± 2SE (dashed lines). Fishing mortality for halibut >81cm estimated from tagging (points ± 2SE, Den Heyer et al. 2011).
65
Maritimes Region 5
Framework and Assessment: Atlantic Halibut Stock
Prod TotB
1
S-R
4 1978 2008 19801982 2006
3
1976 1994 1990 1986 2002 2004 1974
2
2000 1970 1972 1992 1988 1
1976 1974 2008 2002 2006 19721988 1986 1998 1978 2000 1970 1984 1992 1996 1990 1994 1982 1980
1984
1998 1996
0 5 0
Yield 5
10
15
0.5
2004
20
25
30
0 5
Yield
4
4 1986 1984
3
3 1990
1982
1988
1980 1970 1978 2002 19921972 2004 20062008 1974 1976 1994 1998 2000 1996
2
1
2
1
0
0 0
0.5
1 0
5
F
10
15
SSB
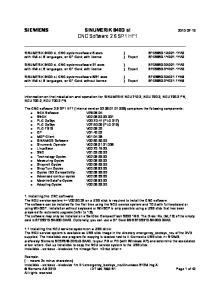
Figure 39. Sissenwine-Shepherd production model. The upper left plot is production as a function of total biomass (in 1000t) with equilibrium lines shown. The black line is based on stock-recruit data while the red line is from the production data. The peak of this line at 1450t is MSY. The upper right plot is a stockrecruit relationship showing a Ricker curve. The lower left plot is yield (in 1000t) as a function of fully recruited fishing mortality, and it shows Fmsy at 0.36. And the lower right plot is yield as a function of spawning stock biomass.
66
Maritimes Region
12000
Framework and Assessment: Atlantic Halibut Stock
SSB and reference levels
11000 10000 9000 8000 t
7000 6000 5000 4000 3000 2000 1000 0 1971 1974 1977 1980 1983 1986 1989 1992 1995 1998 2001 2004 2007 2010 Year
Figure 40. Spawning stock biomass plotted with trial biological reference levels (80 and 40% BMSY).
0.8
Fully recruited F
0.7 0.6 0.5 0.4 0.3 0.2 0.1 0 1971 1974 1977 1980 1983 1986 1989 1992 1995 1998 2001 2004 2007 2010 Year
Figure 41. Fully recruited fishing mortality plotted with trial reference level (F=0.36).
67
Maritimes Region
0.8
Framework and Assessment: Atlantic Halibut Stock
HCR
0.7 0.6
19921990
1989
0.5
1988
F
1991
0.4
1986
1985
1987
0.3
19982003 1973 1971 1984 19962004 1972 19741997 1970 2009 1975 2001 2002 2007 1983 2005 1995 1976 2000 2008 1980 1981 1982 1978 1979 1999 1977 2006 1994
1993
0.2 0.1 0 0
1
2
3
4
5
6 SSB(kt)
7
8
9
10
11
12
Figure 42. Harvest control rule for halibut using CAL model results. The red vertical lines mark the boundaries between critical, cautious and healthy domains. The history of the stock is shown as labelled points.
68
Maritimes Region
Framework and Assessment: Atlantic Halibut Stock
Appendix A. Atlantic halibut length frequency and proportions at length.
69
Maritimes Region
Framework and Assessment: Atlantic Halibut Stock
70
Maritimes Region
Framework and Assessment: Atlantic Halibut Stock
71
Maritimes Region
Framework and Assessment: Atlantic Halibut Stock
72
Maritimes Region
Framework and Assessment: Atlantic Halibut Stock
73
Maritimes Region
Framework and Assessment: Atlantic Halibut Stock
74
Maritimes Region
Framework and Assessment: Atlantic Halibut Stock
75
Maritimes Region
Framework and Assessment: Atlantic Halibut Stock
76
Maritimes Region
Framework and Assessment: Atlantic Halibut Stock
77
Maritimes Region
Framework and Assessment: Atlantic Halibut Stock
78
Maritimes Region
Framework and Assessment: Atlantic Halibut Stock
79
Maritimes Region
Framework and Assessment: Atlantic Halibut Stock
Appendix B. Estimated selectivities and numbers at age used in the halibut simulation model.
80
Maritimes Region
Framework and Assessment: Atlantic Halibut Stock
81
Maritimes Region
Framework and Assessment: Atlantic Halibut Stock
Appendix C. Atlantic halibut proportions at length (points) and model fit (line) for each data component. Residual plots plotted against length and year.
82
Maritimes Region
Framework and Assessment: Atlantic Halibut Stock
83
Maritimes Region
Framework and Assessment: Atlantic Halibut Stock
84
Maritimes Region
Framework and Assessment: Atlantic Halibut Stock
85
Maritimes Region
Framework and Assessment: Atlantic Halibut Stock
86
Maritimes Region
Framework and Assessment: Atlantic Halibut Stock
87
Maritimes Region
Framework and Assessment: Atlantic Halibut Stock
88
Maritimes Region
Framework and Assessment: Atlantic Halibut Stock
89
Maritimes Region
Framework and Assessment: Atlantic Halibut Stock
90
Maritimes Region
Framework and Assessment: Atlantic Halibut Stock
91
Maritimes Region
Framework and Assessment: Atlantic Halibut Stock
92
Maritimes Region
Framework and Assessment: Atlantic Halibut Stock
93
Maritimes Region
Framework and Assessment: Atlantic Halibut Stock
94
Maritimes Region
Framework and Assessment: Atlantic Halibut Stock
95
Maritimes Region
Framework and Assessment: Atlantic Halibut Stock
96
Maritimes Region
Framework and Assessment: Atlantic Halibut Stock
97
Maritimes Region
Framework and Assessment: Atlantic Halibut Stock
98
Maritimes Region
Framework and Assessment: Atlantic Halibut Stock
99
Maritimes Region
Framework and Assessment: Atlantic Halibut Stock
100
Maritimes Region
Framework and Assessment: Atlantic Halibut Stock
101
Maritimes Region
Framework and Assessment: Atlantic Halibut Stock
102
Maritimes Region
Framework and Assessment: Atlantic Halibut Stock
103
Maritimes Region
Framework and Assessment: Atlantic Halibut Stock
104
Maritimes Region
Framework and Assessment: Atlantic Halibut Stock
Appendix D. Monte Carlo Markov-Chain (MCMC) simulations and Maximum Likelihood Estiamtes (MLE, vertical dashed line).
105
Maritimes Region
Framework and Assessment: Atlantic Halibut Stock
106
Maritimes Region
Framework and Assessment: Atlantic Halibut Stock
107
Maritimes Region
Framework and Assessment: Atlantic Halibut Stock
Appendix E. Model fit and residual plots from the halibut catch at age (CAA) model.
108
Maritimes Region
Framework and Assessment: Atlantic Halibut Stock
109
Maritimes Region
Framework and Assessment: Atlantic Halibut Stock
110
Maritimes Region
Framework and Assessment: Atlantic Halibut Stock
Appendix F. Residual plots for the RV and halibut survey index (HSI) catch at age, fit to the RV and HSI abundance index, and projections for the virtual population analysis (VPA) model. 1970
1975
1980
1985
1990
1995
2000
2005
2010
1970
1975
1980
1985
1990
1995
2000
2005
2010
2 3 4 RV
5 6 7 8 5 6 7
HSI 8 9 10 11 12
Bias Corrected Pop. Numbers vs Q adjusted indices 2800
RV
2400 2000 1600 1200 800 400 0 1400
HSI
1200 1000 800 600 400 200 0 1971 1974 1977 1980 1983 1986 1989 1992 1995 1998 2001 2004 2007 2010
111
Maritimes Region
0.8
Framework and Assessment: Atlantic Halibut Stock
HCR 1992 1991
0.7
1989
1993
0.6
1990
1988 1987
1986
1985
F
0.5 0.4
19972002 1994 1996 2003 1999 2004 2001 1998 2005 2008 2009 1995 2007 2006 2000
0.3
1984 2010 2011 1983 1982 2012 1971 1970 1972 1980 1979 1981 1973 1978 1974 1975 19761977
0.2 0.1 0 0
1
2
3
4
5 6 SSB(kt)
7
8
9
10
11
12
Figure F1. Harvest control rule for halibut using VPA data. The red lines mark the boundaries between critical, cautious and healthy domains. The history of the stock is shown as labelled points and uncertainty as ovals (1SD in each dimension). The stock was projected ahead for 3 years using 2000t per year.
112